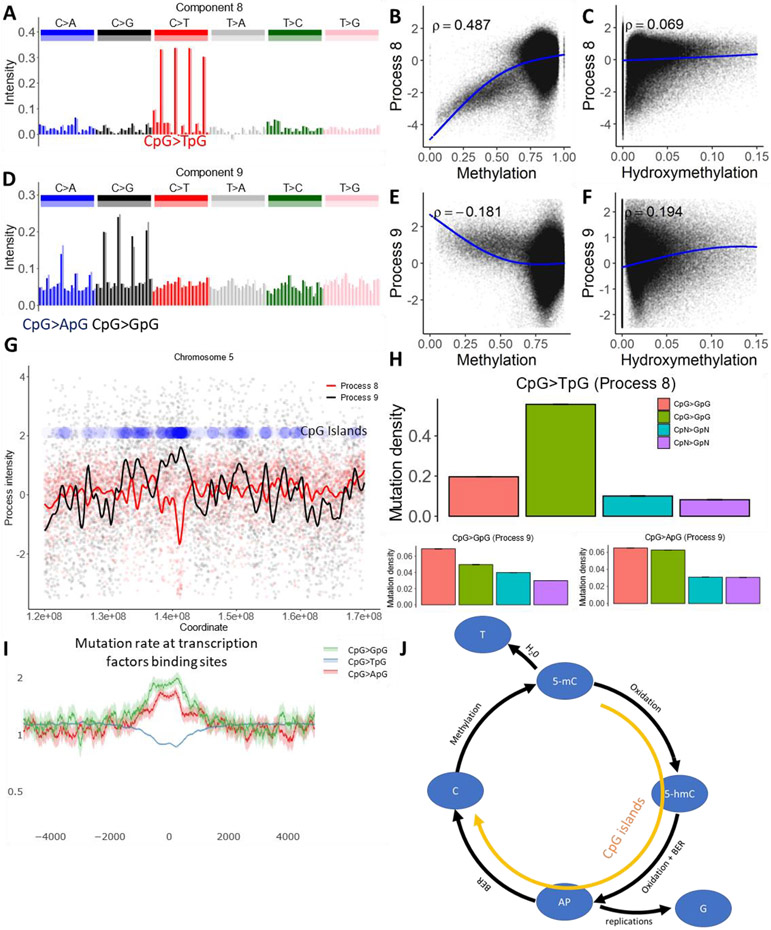
Fig 4. Cytosine deamination and cytosine demethylation.
(A and D) The mutational spectrum of component 8 is dominated by CpG>TpG (top), while component 9 is dominated by CpG>GpG and CpG>ApG (bottom).
(B, C, E and F) Association between the intensity of components 8 and 9 and cytosine methylation or cytosine hydroxymethylation.
(G) Process 8 is inversely correlated with the density of CpG islands, while process 9 is positively correlated. Blue dots represent density of CpG islands across a 50 MB long region of chromosome 5.
(H) Effect of CpG islands on mutation rate in CpG context and in cytosines outside of CpG context.
(I) Mutation rate in CpG context at transcription factor binding sites located outside of annotated CpG islands, as determined by ChIP-seq peaks (see Methods), normalized to the genome average mutation rate. 95% binomial proportion confidence intervals are displayed in transparent lines. Higher levels of demethylation at these sites lead to the accelerated rate of CpG transversions.
(J) Illustration of the biochemical mechanisms suggested for processes 8 and 9. Enzymatic oxidation of methylcytosine (5-mC) leads to hydroxymethylcytosine (5-hmC) (35), which after additional steps of oxidation should be removed by glycosylase, leaving an abasic site (AP). During DNA replication, AP sites will frequently be converted to CpG>GpG mutations and more rarely to CpG>ApG mutations, matching the spectra of process 9 (36). Alternatively, successful repair of AP sites creates non-methylated cytosines. Alternately, spontaneous deamination of methylcytosine creates a T to G mismatch, enhancing the rate of CpG>TpG mutations. While deamination should be prevalent in CpG sites with high methylation levels, the mutagenic effect of demethylation should be prominent in CpG islands.

