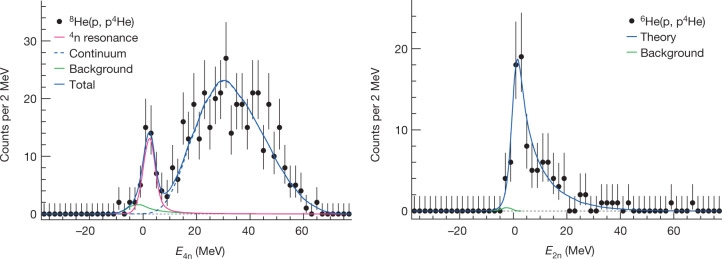
Fig. 3. Missing-mass spectra.
Left: missing-mass spectrum of the four-neutron system extracted from the reaction. The different curves represent a Breit–Wigner resonance (pink), a non-resonant continuum (dashed blue), the background from two-step processes (green) and the total sum (solid blue). Right: missing-mass spectrum of the two-neutron system extracted from the reaction. The blue curve represents the theoretical calculation17 convoluted with the experimental acceptance and resolution, and the green curve represents the background from the two-step reaction.

