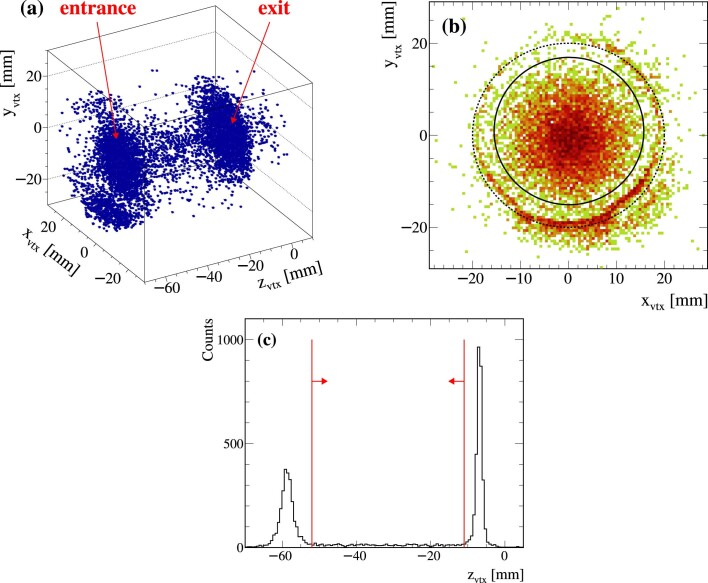
Extended Data Fig. 2. Reaction vertex.
(a) 3D representation of the reconstructed reaction vertex from empty target runs. In such a case the incoming beam particle can interact with the material of the target cell at the entrance/exit of the cell, or with the residual hydrogen gas inside the target cell. (b) Reconstructed vertex in the XY plane. The region outside the solid circle is excluded in the analysis, to avoid reactions produced at the target cell and the support structure of the target. The dashed circle indicates the target cell, which has radius of 20 mm. (c) Projection onto the z–axis. The red lines represent the cut applied in the analysis. By fitting the peaks with Gaussians distributions, the vertex resolution is extracted to be at the entrance of the target, and at the exit of the target. The first silicon plane in these plots is located at z = 0 mm

