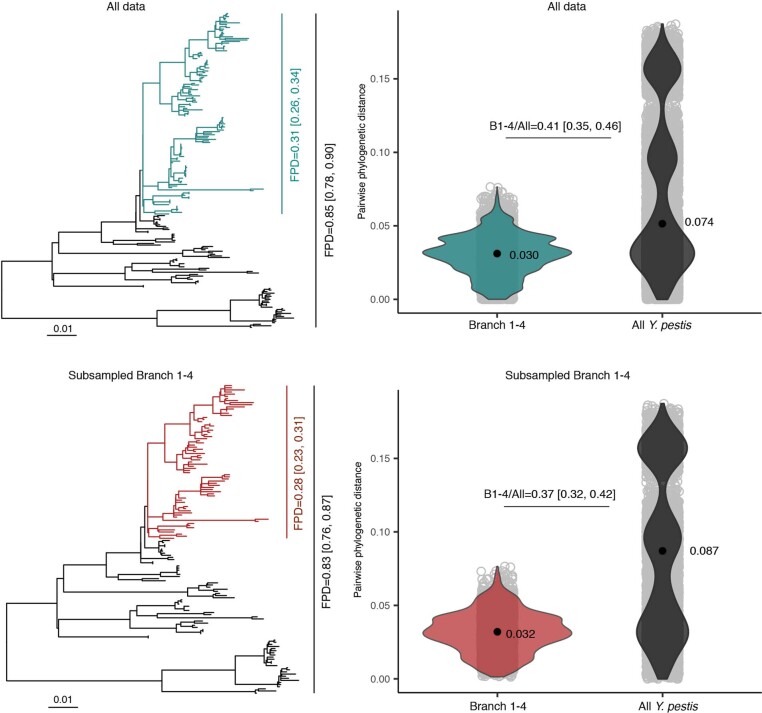
Extended Data Fig. 7. Comparison of phylogenetic diversity measures computed for the complete modern Y. pestis phylogeny against the Branch 1-4 subclade.
The left panels show maximum likelihood substitution trees considering only extant Y. pestis genomes, annotated based on the compared clades and their corresponding Faith’s phylogenetic diversity index (FPD). Phylogenetic branches considered for the Branch 1-4 FPD computation are shown in green (full dataset) and red (subsampled dataset). The right panels show violin plots indicating the distribution and mean of pairwise phylogenetic distances based on maximum likelihood trees (MPD). Median estimates and 95% percentile intervals were derived from the resampled bootstrap trees (1,000 bootstrap iterations). Points within violin plots indicate the mean estimated phylogenetic distance for all datasets.

