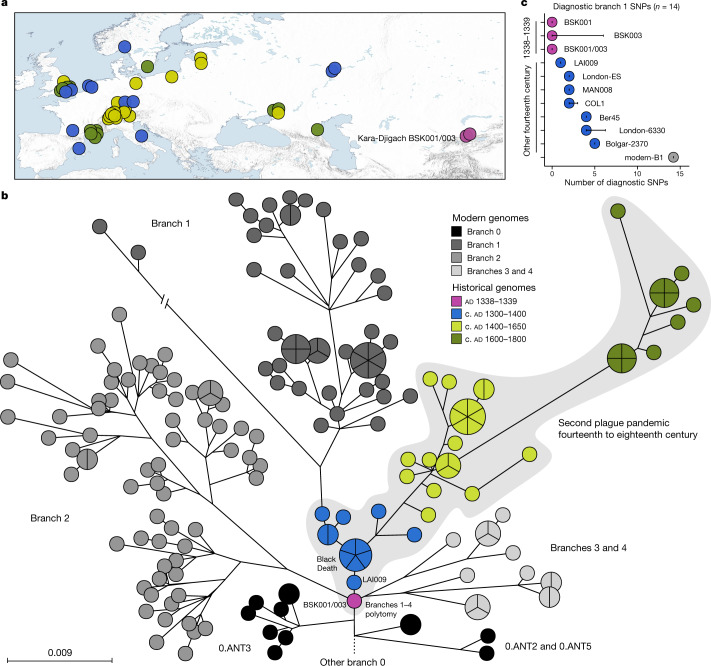
Fig. 2. Comparisons between BSK001/003 and published Y. pestis genomic diversity.
a, Map of all historical Y. pestis genomes used in the present study (n = 48). The colours represent different genome ages on a scale between 1300 and 1800, as depicted in b. The colour scale is maintained across all panels of this figure. To aid visibility in overlapping symbols, a jitter option was implemented for plotting genomes on the map. The map was created with QGIS v.3.22.1 (ref. 51) and uses Natural Earth vector map data from https://www.naturalearthdata.com/. b, Y. pestis maximum likelihood phylogeny based on 2,960 SNPs, visualized using GrapeTree50. The depicted portion of the phylogeny contains the closest related lineages to BSK001/003. (For a fully labelled tree, see Extended Data Fig. 5). The colours of published historical strains are consistent with a. The scale denotes the number of substitutions per genomic site. c, Abundance of diagnostic SNP sharing in fourteenth-century Y. pestis genomes. The number of diagnostic SNPs (n) shared between all modern genomes on branch 1, and therefore defining this branch, were retrieved from a comparative SNP table of 203 modern Y. pestis genomes. SNP sharing was assessed by determining the allele status of each diagnostic position according to a threefold SNP calling threshold. The error bars denote the degree of missing data (n) in the respective ancient genome. Refer to Extended Data Fig. 6 and Supplementary Table 18 for an overview of diagnostic SNP sharing on different phylogenetic branches.

