Abstract
Background
Pulmonary arterial hypertension (PAH) patients have altered right atrial (RA) function and right ventricular (RV) diastolic stiffness. This study assessed the impact of RV diastolic stiffness on RA–RV interaction.
Methods
PAH patients with low or high end-diastolic elastance (Eed) (n=94) were compared with controls (n=31). Treatment response was evaluated in 62 patients. RV and RA longitudinal strain, RA emptying and RV filling were determined and diastole was divided into a passive and active phase. Vena cava backflow was calculated as RA active emptying−RV active filling and RA stroke work as RA active emptying×RV end-diastolic pressure.
Results
With increased Eed, RA and RV passive strain were reduced while active strain was preserved. In comparison to controls, patients had lower RV passive filling but higher RA active emptying and RA stroke work. RV active filling was lower in patients with high Eed, resulting in higher vena cava backflow. Upon treatment, Eed was reduced in ~50% of the patients with high Eed, which coincided with larger reductions in afterload, RV mass and vena cava backflow and greater improvements in RV active filling and stroke volume in comparison with patients in whom Eed remained high.
Conclusions
In PAH, RA function is associated with changes in RV function. Despite increased RA stroke work, severe RV diastolic stiffness is associated with reduced RV active filling and increased vena cava backflow. In 50% of patients with high baseline Eed, diastolic stiffness remained high, despite treatment. A reduction in Eed coincided with a large reduction in afterload, increased RV active filling and decreased vena cava backflow.
Short abstract
Despite increased RA stroke work in PAH patients, severe RV diastolic stiffness is associated with lower RV active filling and high vena cava backflow. Upon treatment, severe RV diastolic stiffness and RA–RV interaction improve in only ~50% of patients. https://bit.ly/31qai5Z
Introduction
Right ventricular (RV) adaptation is essential in pulmonary arterial hypertension (PAH) patients, given that RV failure is the main determinant of symptoms and mortality [1]. One of the hallmarks of ventricular adaptation, hypertrophy, comes at the cost of ventricular stiffening, which is exacerbated by changes in collagen deposition and titin phosphorylation [2, 3]. Some stiffening may be beneficial because it prevents overt dilatation of the right ventricle, but excessive stiffening may have detrimental effects. The degree of RV diastolic stiffness is associated with other parameters of disease severity and is a predictor of mortality [4, 5]. It may also affect right atrial (RA) function, as was recently suggested by correlations of RV diastolic stiffness with vena cava backflow and RA longitudinal strain [6, 7]. However, it is unclear whether changes in RA function reflect impaired RA contraction or develop as a (potentially reversible) consequence of RV diastolic stiffness. We used an integrative approach combining RA and RV strain measurements with pressure–volume analysis in PAH patients before and after treatment to assess RA–RV interaction and vena cava backflow at different gradations of RV diastolic stiffness to answer the following questions: 1) Are changes in RA function a consequence of RV diastolic stiffness or do they reflect impaired RA contraction? 2) To what extent is severe RV diastolic stiffness reversible and does reversal lead to improvement of RA–RV interaction and reduction of vena cava backflow?
Methods
Study subjects
Patients with idiopathic, hereditary or connective tissue disease (CTD)-associated PAH diagnosed between December 2002 and May 2019 at a tertiary referral centre for PAH (Amsterdam University Medical Center, The Netherlands) were evaluated for eligibility (supplementary figure S1). Patients (n=178) had undergone cardiac magnetic resonance imaging (CMR) within 2 weeks of right heart catheterisation at baseline and at follow-up. Medication use at baseline, poor quality RV pressure curves or CMR image were exclusion criteria (n=84). This resulted in 94 eligible patients, who were divided into two subgroups based on median end-diastolic elastance (Eed), with high Eed identifying PAH patients with severe RV diastolic stiffness. The median Eed of 0.63 mmHg·mL−1 closely corresponds to the optimal cut-off for survival prediction [5]. Subjects who had dyspnoea or a positive mutation carrier status but normal pulmonary artery pressures were included as controls (n=31). None of these had pulmonary or cardiovascular disease, diabetes or systemic hypertension. Treatment response was evaluated in 62 patients after a median follow-up of 11 months (interquartile range 6–13 months). Owing to the retrospective character of this study using data obtained for clinical purposes, the medical ethics review committee of the VU Medical Center did not consider this study to fall within the scope of the Medical Research Involving Human Subjects Act. Therefore, no additional approval was required (approval number 2012288).
Pressure–volume analysis
Right heart catheterisation was performed using a balloon-tipped flow-directed 7.5 F triple lumen Swan-Ganz catheter (Edwards Lifesciences LLC, Irvine, CA, USA). Cardiac output was measured by direct Fick or thermodilution method. All pressure curve analyses were performed by one researcher (JNW). End-systolic elastance (Ees) in PAH patients was derived according to the single-beat method [8], using systolic pulmonary artery pressure to estimate end-systolic pressure [9]. A sine wave was fitted over the RV pressure curve using the isovolumic contraction period (from end diastole to the point of maximal rate of pressure rise (dP/dtmax)) and the isovolumic relaxation period (from minimal dP/dt to start diastole). The point of end diastole was identified using the R-wave of the ECG and, when needed, shifted manually to the point before the upslope of the ascending limb. RV isovolumic pressures were averaged over >10 heartbeats. Beats with significant catheter artefacts were excluded. Arterial elastance (Ea) was calculated as systolic pulmonary artery pressure/stroke volume and RV–arterial coupling as Ees/Ea [10]. Eed was derived by fitting a curve through (0,0), the start-diastolic and the end-diastolic points on the pressure–volume curve. Eed is the slope of this curve at end-diastolic volume [4, 5]. We estimated RA stroke work by multiplying RA active emptying volume by RV end-diastolic pressure (unit: mL·mmHg−1).
Cardiac magnetic resonance
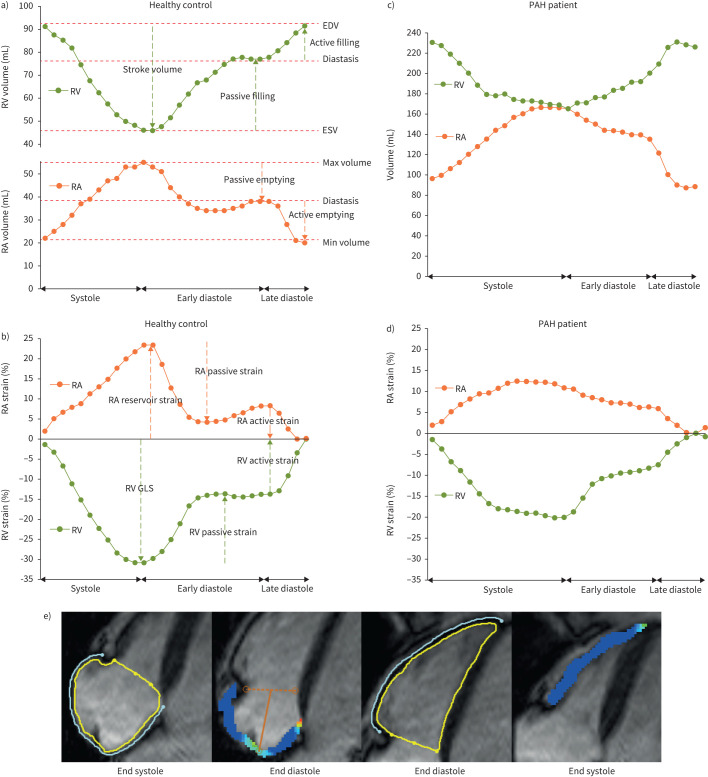
All images were acquired on a 1.5 T Avanto or Sonata scanner equipped with a six-element phased array coil (Siemens Medical Solutions, Erlangen, Germany). Images were analysed as previously described [11]. RV volume was also measured during atrial diastasis, just before the start of atrial contraction. Because a stack of images through the atria was not available (the typical protocol for a short axis stack is to start just above the tricuspid valve), RA volume was determined by applying the area-length method on the four-chamber view. This method results in an underestimation of the volume [12] but it correlated excellently with the volume determined on a transverse stack of slices in 42 patients with pulmonary hypertension (supplementary figure S2). We added the difference between the two methods to the four-chamber volume to derive accurate RA volumes. RA volumes were measured in three phases (maximal, diastasis and minimal). RA passive emptying was defined as the difference between RA maximal and RA diastasis volume, and RA active emptying as the difference between RA diastasis and RA minimal volume [7, 13]. RV passive and active filling were calculated similarly. We derived vena cava backflow by subtracting RV active filling from RA active emptying. A detailed description of the cardiac phases and corresponding volumes is given in figure 1. To measure the possible impact of tricuspid regurgitation (TR), we estimated TR volume by subtracting left ventricular from RV stroke volume [14].
FIGURE 1.
Example of right atrial (RA) and right ventricular (RV) volume and strain in a healthy control and a patient with pulmonary arterial hypertension (PAH). a, b) RA and RV volume and strain throughout the cardiac cycle in a healthy control. c, d) RA and RV volume and strain throughout the cardiac cycle in a PAH patient. e) RA endo- and epicardial contours drawn at end systole and maximal negative strain (global longitudinal strain (GLS)) at end diastole (left panels). RV contours were drawn at end diastole, while maximal negative strain (GLS) was reached at end systole (right panels). EDV: end-diastolic volume; ESV: end-systolic volume.
Strain analysis
Strain analysis was performed by CMR feature tracking using commercially available software (Circle CVI42). RV longitudinal strain was determined on a four-chamber view by drawing epicardial and endocardial contours in the end-diastolic phase (L0), excluding trabeculations. The analysis included only the RV free wall [15]. Similarly, RA longitudinal strain was determined by drawing contours in the phase with maximal RA volume (L0). The automated feature tracking was visually checked and corrections to the initial contours were made if deemed necessary. Both RA and RV strain were divided in a passive and active phase [13]. Representative examples of contouring, feature tracking and division of strain in three phases are given in figure 1.
Statistical analysis
Statistical analyses were performed using R version 3.6.1 (https://cran.r-project.org/). Distribution of all variables was visually checked using histograms and qqplots (rcompanion; https://cran.r-project.org/package=rcompanion). Data are reported as mean±sd or median (interquartile range) depending on distribution. Categorical variables are reported as n (%). Non-normally distributed variables were normalised by logarithmic transformation. N-terminal pro-brain natriuretic peptide could not be normalised and was compared with a Wilcoxon's test. Comparison of multiple groups was done with ANOVA and post hoc Tukey's test to correct for the family-wise error-rate. Differences between baseline and follow-up measurements were tested with a paired t-test for continuous variables and Fisher's exact test for categorical variables. All statistical tests were done with rstatix (https://cran.r-project.org/package=rstatix) and visualisation of data with ggplot2 (https://cran.r-project.org/package=ggplot2). To visualise the RA and RV strain curve over one cardiac cycle, the mean strain values for all patients who had 30 CMR phases was used (other patients had 20–29 phases). These 56 patients were representative of the full cohort (supplementary table S1). Furthermore, patients with follow-up (n=62) were representative of the full cohort (supplementary table S1). Patients with baseline Eed >0.63 mmHg·mL−1 were divided into two groups at follow-up based on the improvement of Eed to <0.63 mmHg·mL−1. About 50% of the patients had a large and significant improvement in Eed from 0.92 mmHg·mL−1 (0.88–1.15 mmHg·mL−1) to 0.37 mmHg·mL−1 (0.31–0.46 mmHg·mL−1) (p<0.001). In the remaining patients, Eed did not change. Changes in haemodynamic and CMR parameters in these groups were compared with repeated measures ANOVA and post hoc pairwise t-tests with Bonferroni correction.
Results
Baseline characteristics
The study population consisted of 63 patients with idiopathic PAH, nine with hereditary PAH and 25 with CTD-PAH. Patients were 58±18 years old and predominantly female (65%). On average, the Eed in patients (0.70±0.41 mmHg·mL−1) was 3.5 times that of controls (0.20±0.08 mmHg·mL−1), indicating significant RV diastolic stiffness. Patients were divided into low Eed and high Eed groups, based on the median value of 0.63 mmHg·mL−1. A comparison of baseline variables in both patient groups and controls is given in table 1.
TABLE 1.
Patient characteristics
| Variable | Control | PAH low Eed | PAH high Eed | p-value |
| Subjects, n | 31 | 47 | 47 | |
| Age, years | 43±14 | 55±18* | 59±18* | <0.001 |
| Female, n (%) | 20 (65%) | 29 (62%) | 32 (68%) | 0.81 |
| NYHA 1/2/3/4 | 16/11/4/0 | 3/19/22/3* | 1/14/28/4* | <0.001 |
| NTproBNP, pg·mL−1 (n=121) | 38 (19.5–58.5) | 443 (233–1366)* | 2052 (1100–3281)*,# | <0.001 |
| Catheterisation | ||||
| Heart rate, bpm | 75±12 | 79±13 | 81±14 | 0.15 |
| mPAP, mmHg | 15±4 | 46±11* | 56±16*,# | <0.001 |
| PAWP, mmHg | 8±3 | 9±3 | 9±3 | 0.33 |
| Cardiac index, L·min−1·m−2 | 3.6±1.0 | 2.7±0.8* | 2.4±0.9* | <0.001 |
| PVR, mmHg·L−1·min−1 | 1.0 (0.7–1.5) | 7.5 (4.9–9.7)* | 11.1 (7.2–15.4)*,# | <0.001 |
| mRAP, mmHg | 4 (3–6) | 6 (4–9)* | 8 (4–11)* | 0.001 |
| RVEDP, mmHg | 8±4 | 14±6* | 18±8*,# | < 0.001 |
| SvO2, % | 76±5 | 65±8* | 60±12*,# | <0.001 |
| CMR | ||||
| RVEDV index, mL·m−2 | 66±13 | 82±21* | 83±23* | <0.001 |
| RVESV index, mL·m−2 | 27±7 | 50±22* | 57±20* | <0.001 |
| SV index, mL·m−2 | 39±8 | 32±8* | 27±9*,# | <0.001 |
| RVEF, % | 60±6 | 41±13* | 33±10*,# | <0.001 |
| RV mass index, g·m−2 | 21±5 | 46±14* | 53±17*,# | <0.001 |
| RA maximum volume index, mL·m−2 | 48 (43–56) | 68 (57–89)* | 78 (62–95)* | <0.001 |
| TR volume, mL No/<30 mL/30–59 mL/>59 mL |
24/7/0/0 | 27/19/1/0 | 26/20/1/0 | 0.38 |
| Pressure-volume analysis | ||||
| Ees, mmHg·mL−1 (n=119) | NA | 0.45 (0.34–0.74)* | 0.52 (0.38–0.83)* | <0.001 |
| Ea, mmHg·mL−1 (n=123) | NA | 1.23 (0.94–1.70)* | 1.85 (1.40–2.40)*,# | <0.001 |
| Ees/Ea (n=119) | NA | 0.42 (0.26–0.61)* | 0.30 (0.23–0.42)* | <0.001 |
| Eed, mmHg·mL−1 (n=119) | 0.20 (0.15–0.24) | 0.39 (0.24–0.52)* | 0.93 (0.78–1.14)*,# | <0.001 |
Data presented as mean±sd or median (interquartile range) when data were not normally distributed. PAH: pulmonary arterial hypertension; Eed: end-diastolic elastance; NYHA: New York Heart Association; NT-proBNP: N-terminal pro-brain natriuretic peptide; mPAP: mean pulmonary artery pressure; PAWP: pulmonary arterial wedge pressure; PVR: pulmonary vascular resistance; mRAP: mean right atrial pressure; RVEDP: right ventricular end-diastolic pressure; SvO2: mixed venous oxygen saturation; CMR: cardiac magnetic resonance; RVEDV: right ventricular end-diastolic volume; RVESV: right ventricular end-systolic volume; SV: stroke volume; RVEF: right ventricular ejection fraction; TR: tricuspid regurgitation; Ees: end-systolic elastance; Ea: arterial elastance. *: p<0.05 versus control; #: p<0.05 versus low Eed.
RV and RA passive strain reduced in patients with high Eed, active strain preserved
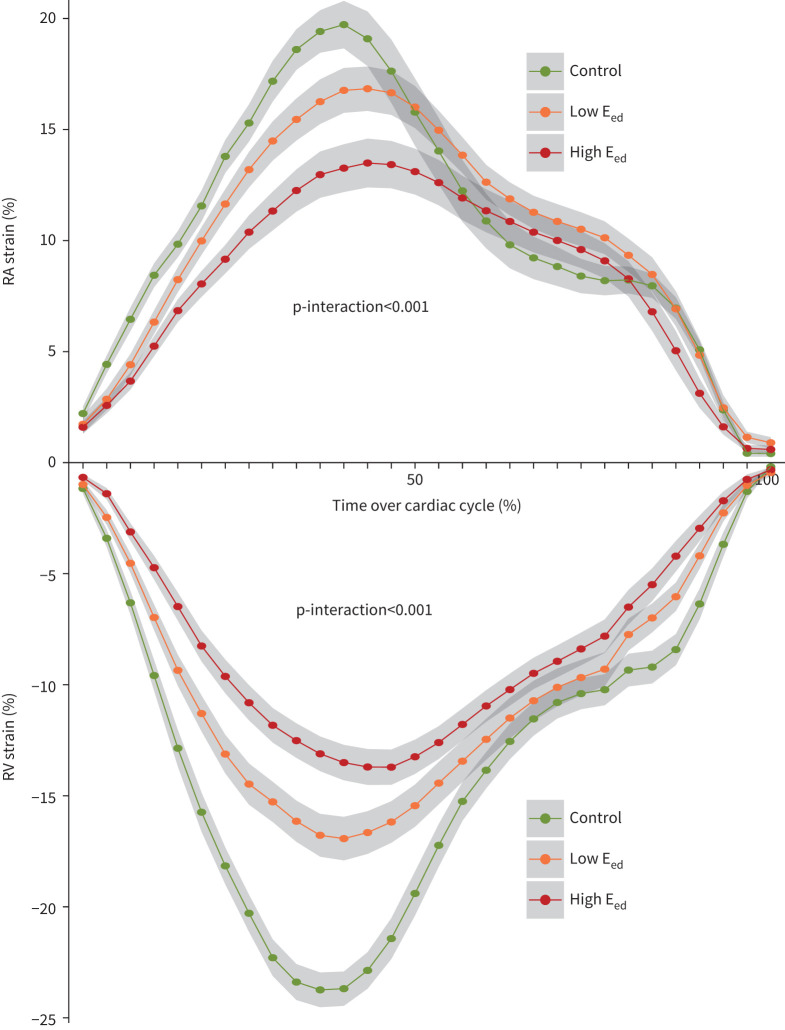
We evaluated the association between strain patterns and RV diastolic stiffness (figure 2). The atrium and ventricle are oppositely directed, but the pattern is very similar. RA reservoir and passive strain in patients with high Eed were strongly reduced in comparison to those with low Eed (supplementary figure S3). There were no differences in RA active strain. RV global longitudinal strain was slightly lower in patients with high Eed. The RV passive strain was reduced to a similar degree as RA passive strain, with the strongest reduction in patients with severe RV diastolic stiffness. RV active strain did not differ between the groups. A comparison of the whole PAH cohort with the control group is given in supplementary table S2. In addition to the differences between patients with low and high Eed, RA passive strain was lower in patients with low Ees/Ea than in those with high Ees/Ea (supplementary figure S4). There was no difference in RA active strain. RV global longitudinal and passive strain were slightly lower in patients with low Ees/Ea, but RV active strain was not. To assess the possible impact of TR on RA volumes and strain, TR volume was correlated to RA maximal volume (Pearson R=0.24, p=0.02). There were no correlations between TR volume and RA strain parameters (data not shown).
FIGURE 2.
Mean right atrial (RA) and right ventricular (RV) longitudinal strain curves during one cardiac cycle. Control, n=20; low end-diastolic elastance (Eed) (<0.63 mmHg·mL−1 ), n=28; high Eed (>0.63 mmHg·mL−1), n=28. Shaded region represents 95% CI. p-interaction represents the interaction between patient group and cardiac magnetic resonance imaging phase assessed by repeated measures ANOVA.
High RA active emptying and vena cava backflow in patients with high Eed
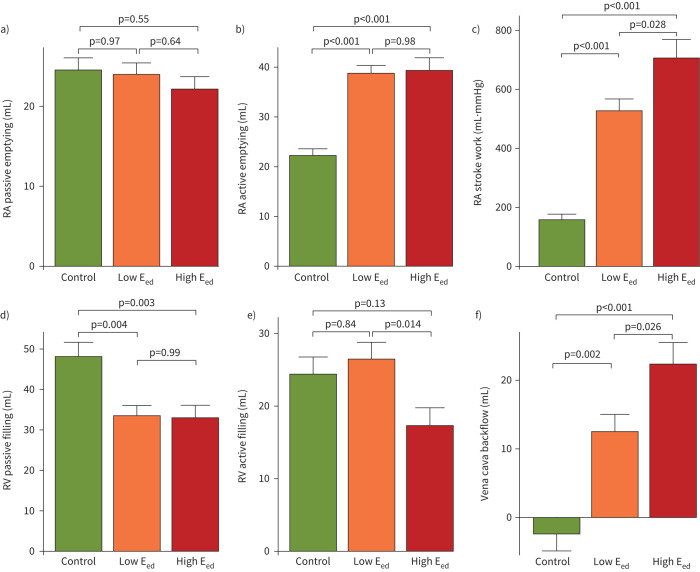
To further evaluate the consequences of RV diastolic stiffness for RA–RV interaction, RA passive and active emptying and RV passive and active filling were determined (figure 3). While there were no differences in RA passive emptying, RA active emptying was higher than that in controls in patients with both low and high Eed. RA stroke work was approximately three-fold greater in patients with low Eed and four-fold greater in patients with high Eed, compared to controls (figure 3c). RV passive filling was markedly reduced in all PAH patients. RV active filling, by contrast, was preserved in patients with low Eed, but reduced in those with high Eed. Vena cava backflow was negligible in controls, but present in patients with low Eed. In patients with high Eed, the backflow was almost twice that in patients with low Eed. In other words, the surplus of RA active emptying results in a significant portion of backward flow into the caval veins (figure 3f). RV active filling was moderately correlated to stroke volume (Pearson R=0.42, p<0.001). There were no differences in RV active filling or vena cava backflow between patients with low and high Ees/Ea (supplementary figure S5). Vena cava backflow was lower in CTD-PAH patients, but a similar pattern was observed for Eed groups (supplementary figure S6).
FIGURE 3.
Right atrial (RA) emptying, right ventricular (RV) filling and vena cava backflow. Data are presented as mean±sem. p-values were calculated with Tukey's post hoc analysis and family-wise correction for multiple testing. a) RA passive emptying was similar in all groups. b) RA active emptying was much higher in all patients with pulmonary arterial hypertension. c) RA stroke work was estimated by multiplying RA active emptying with the end-diastolic pressure. d) RV passive filling was strongly reduced in all patients. e) RV active filling was preserved in patients with low end-diastolic elastance (Eed) (<0.63 mmHg·mL−1), but lower in patients with high Eed (>0.63 mmHg·mL−1). f) Vena cava backflow represents the difference between RA active emptying and RV active filling.
Treatment response
Almost a third of patients (31%) received monotherapy, 63% received oral combination therapy and 6% received triple therapy. The changes in haemodynamic and CMR parameters for the PAH cohort are shown in supplementary table S3. As expected, pulmonary vascular resistance dropped from 9.6 mmHg·L−1·min−1 (6.8–12.9 mmHg·L−1·min−1) to 4.7 mmHg·L−1·min−1 (3.7–7.1 mmHg·L−1·min−1) (p<0.001), mean pulmonary artery pressure decreased by 10 mmHg (95% CI 6–13 mmHg, p<0.001), cardiac index increased by 0.7 L·min−1 (95% CI 0.5–0.9 L·min−1, p<0.001) and RV stroke volume index increased by 6 mL (95% CI 4–8 mL, p<0.001). The Eed decreased by almost 40%, but did not normalise. Passive filling of the right ventricle did not increase significantly, but active filling did. Backflow to the caval veins decreased substantially.
Severe RV diastolic stiffness improves in ∼50% of patients
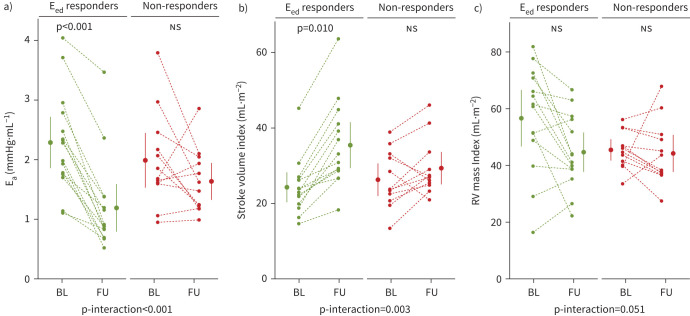
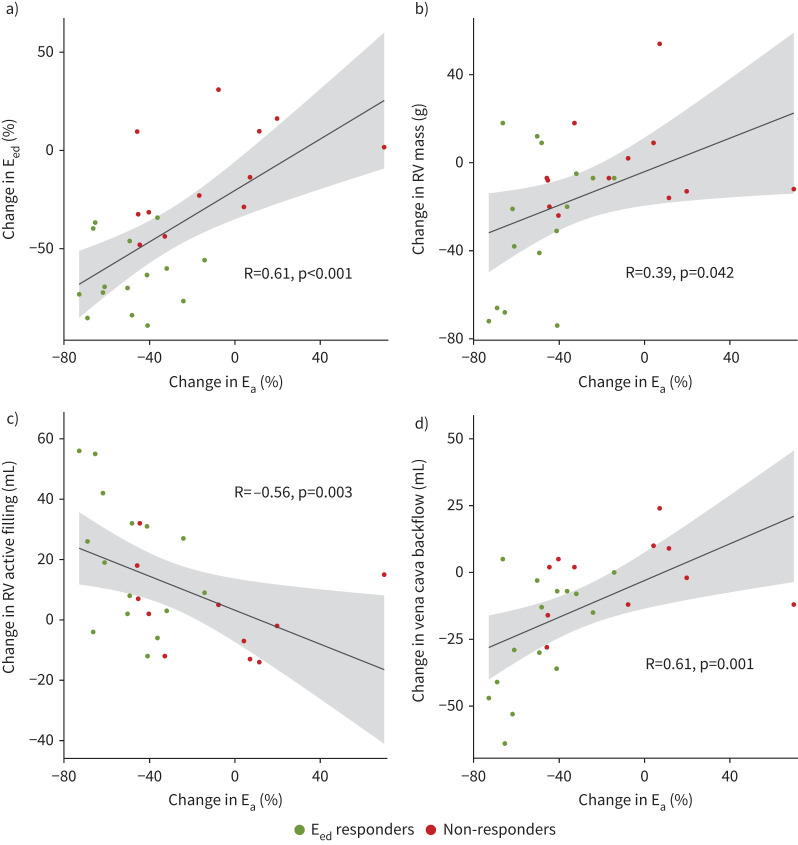
To identify which factors are associated with improvement of severe RV diastolic stiffness, we classified patients with a high baseline Eed as responders when they converted to a low Eed (<0.63 mmHg·mL−1) at follow-up or as non-responders when the Eed remained elevated. Convergence to a low Eed could not be explained by differences in gender or treatment, but it did coincide with greater reduction in Ea (reduction of 48±17% in responders versus 13±34% in non-Eed responders, p-interaction<0.001), greater improvement in RV stroke volume index (47±25% versus 16±28%, p-interaction=0.003) and greater reduction in RV mass (15±31% versus 2±28%, p-interaction=0.051) (figure 4). Furthermore, the change in Ea correlated with the change in Eed, RV mass, RV active filling and vena cava backflow (figure 5).
FIGURE 4.
Changes in afterload, stroke volume and right ventricular (RV) mass after the start of treatment. Patients with high baseline end-diastolic elastance (Eed) either improved to <0.63 mmHg·mL−1 (green; Eed responders) or remained high at >0.63 mmHg·mL−1 (red; non-responders). Dots and whiskers represent mean±sem. p-values were determined through pairwise t-test with Bonferroni correction. p-interaction values represent repeated measures ANOVA. a) Arterial elastance (Ea) improved in the Eed responders. b) RV stroke volume index improved significantly in Eed responders, while there was no change in non-responders. c) The change in RV mass index was stronger in Eed responders. BL: baseline; FU: follow-up; ns: nonsignificant.
FIGURE 5.
Correlations between change in afterload (arterial elastance (Ea)) at follow-up and several right ventricular (RV) parameters. a) End-diastolic elastance (Eed), b) RV mass, c) RV active filling and d) vena cava backflow. R-values represent Spearman correlations.
RA–RV interaction improves in Eed responders
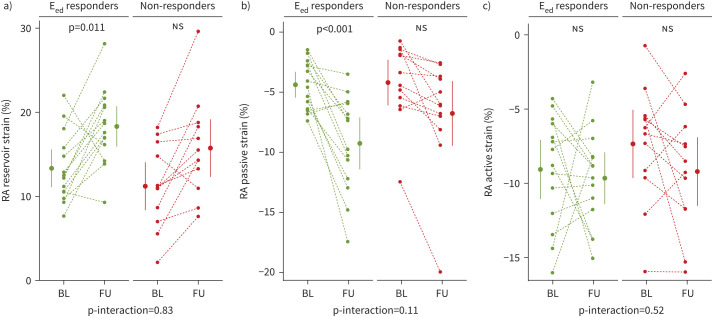
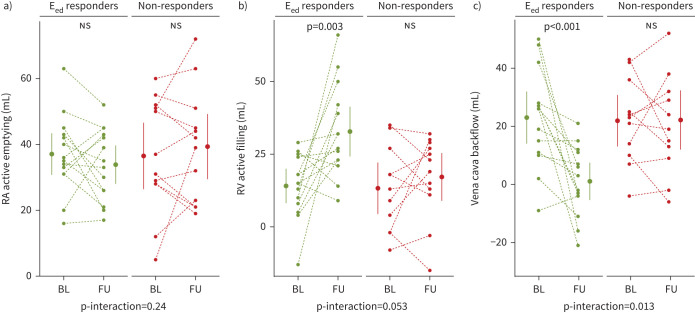
RA reservoir and passive strain improved in Eed responders, while RA active strain did not change (figure 6). In non-Eed responders, there was no change in any of the RA strain parameters. RV global longitudinal strain improved in Eed responders, but not in non-Eed responders (table 2). RV passive and active strain did not change significantly in either group. RA passive emptying and RV passive filling did not change after treatment, RA stroke work did not change significantly, and active emptying remained elevated in both groups. However, in Eed responders, RV active filling increased by 19 mL (95% CI 12–25 mL, p=0.003). This was associated with a normalisation of vena cava backflow (figure 7) while non-Eed responders had no improvement in RV active filling or vena cava backflow. In summary, ~50% of the patients with a high Eed at baseline had a favourable response. RA active emptying became more efficient (increased forward flow, decreased backward flow) as the RV became less stiff (figure 8).
FIGURE 6.
Changes in right atrial (RA) reservoir, passive and active strain after the start of treatment. Patients with high baseline end-diastolic elastance (Eed) either improved to <0.63 mmHg·mL−1 (green; Eed responders) or remained high at >0.63 mmHg·mL−1 (red; non-responders). Dots and whiskers represent mean±sem. p-values were determined through pairwise t-test with Bonferroni correction. p-interaction values represent repeated measures ANOVA. a) RA reservoir strain improved in Eed responders. b) RA passive strain improved significantly in Eed responders, while there was no change in non-responders. c) RA active strain did not change in either of the groups. BL: baseline; FU: follow-up; ns: nonsignificant.
TABLE 2.
Treatment response of patients with high Eed, categorised as patients with improvement of Eed and patients in whom Eed remained high
| Variable | Eed improved (n=14) | Eed stable >0.63 (n=12) | p-interaction | ||
| Baseline | Follow-up | Baseline | Follow-up | ||
| Female, n (%) | 10 (71%) | 8 (67%) | 1 | ||
| ERA/PDE5i/double/triple | 2/1/8/3 | 3/3/6/0 | 0.33 | ||
| Catheterisation | |||||
| mPAP, mmHg | 58±20 | 43±17 | 53±8 | 49±10 | 0.052 |
| Cardiac index, L·min−1·m−2 | 2.1±0.7 | 3.1±0.7** | 2.3±0.7 | 2.4±0.7 | 0.020 |
| PVR, mmHg·L−1·min−1 | 11.9 (8.2–15.5) | 4.5 (3.7–7.3)** | 12.7 (8.1–14.9) | 8.5 (5.9–11.7) | 0.14 |
| mRAP, mmHg | 5.0 (3.3–10.5) | 4.0 (3.3–6.0) | 10.0 (5.0–15.0) | 8.5 (5.8–10.2) | 0.85 |
| RVEDP, mmHg | 17.4±9.1 | 11.1±5.1 | 18.1±5.7 | 17.4±4.4 | 0.08 |
| CMR | |||||
| RVEDV index, mL·m−2 | 82±24 | 77±23 | 74±19 | 70±24 | 0.89 |
| RVESV index, mL·m−2 | 57±22 | 42±16 | 47±17 | 41±21 | 0.10 |
| SV index, mL·m−2 | 24±7 | 35±11** | 26±7 | 29±7 | 0.003 |
| RVEF, % | 31±9 | 47±10** | 37±12 | 44±12 | 0.014 |
| RV mass index, g·m−2 | 57±19 | 45±13 | 46±7 | 44±11 | 0.051 |
| RA maximum volume index, mL·m−2 | 76 (60–86) | 63 (57–71) | 80 (72–97) | 75 (64–106) | 0.26 |
| Pressure–volume | |||||
| Ees, mmHg·mL−1 | 0.69 (0.40–0.84) | 0.26 (0.18–0.48) | 0.55 (0.40–0.83) | 0.52 (0.40–0.86) | 0.15 |
| Ea, mmHg·mL−1 | 2.28 (1.77–2.63) | 0.89 (0.76–1.29)** | 1.77 (1.61–2.24) | 1.55 (1.22–1.96) | <0.001 |
| Ees/Ea | 0.29 (0.23–0.34) | 0.36 (0.16–0.58) | 0.32 (0.24–0.41) | 0.39 (0.25–0.63) | 0.83 |
| Eed, mmHg·mL−1 | 0.92 (0.88–1.15) | 0.37 (0.31–0.46)** | 1.02 (0.81–1.42) | 0.82 (0.74–0.97) | <0.001 |
| Strain analysis, % | |||||
| RA reservoir strain | 13.3±4.2 | 18.3±4.5* | 11.2±4.9 | 15.7±5.9 | 0.83 |
| RA passive strain | −4.4±2.0 | −9.3±4.0** | −4.2±3.3 | −6.8±4.7 | 0.11 |
| RA active strain | −9.1±3.7 | −9.7±3.3 | −7.4±4.0 | −9.2±4.0 | 0.52 |
| RV GLS | −12.6±3.4 | −18.2±3.9** | −14.2±5.0 | −16.9±4.7 | 0.21 |
| RV passive strain | 5.9±3.1 | 8.6±3.4 | 5.8±3.2 | 8.0±3.9 | 0.74 |
| RV active strain | 7.0±3.4 | 9.8±3.4 | 8.4±4.5 | 9.2±4.5 | 0.32 |
| RA–RV interaction | |||||
| RA passive emptying, mL | 23±10 | 22±9 | 22±9 | 23±13 | 0.57 |
| RA active emptying, mL | 37±12 | 34±11 | 37±18 | 39±17 | 0.24 |
| RV passive filling, mL | 31±21 | 33±18 | 37±19 | 40±26 | 0.85 |
| RV active filling, mL | 14±11 | 33±16** | 13±15 | 16±14 | 0.053 |
| RA stroke work, mL·mmHg | 634±365 | 409±275 | 691±464 | 709±421 | 0.073 |
| Vena cava backflow, mL | 23±17 | 1±12** | 22±15 | 20±17 | 0.013 |
Data presented as mean±sd or median (interquartile range) when data were not normally distributed. p-values represent the interaction of time and group as determined with repeated measures ANOVA. Eed: end-diastolic elastance; ERA: endothelin receptor antagonist; PDE5i: phosphodiesterase 5 inhibitor; double: combination of ERA and PDE5i; triple: combination of ERA, PDE5i and prostacyclin agonist; mPAP: mean pulmonary artery pressure; PVR: pulmonary vascular resistance; mRAP: mean right atrial pressure; RVEDP: right ventricular end-diastolic pressure; CMR: cardiac magnetic resonance; RVEDV: right ventricular end-diastolic volume; RVESV: right ventricular end-systolic volume; SV: stroke volume; RVEF: right ventricular ejection fraction; RV: right ventricular; RA: right atrial; Ees: end-systolic elastance; Ea: arterial elastance; GLS: global longitudinal strain. *: p<0.05 in comparison with baseline, after Bonferroni correction for multiple testing; **: p<0.01 in comparison with baseline, after Bonferroni correction for multiple testing.
FIGURE 7.
Changes in right atrial (RA) active emptying, right ventricular (RV) active filling and backflow after the start of treatment. Patients with high baseline end-diastolic elastance (Eed) either improved to <0.63 mmHg·mL−1 (green; Eed responders) or remained high at >0.63 mmHg·mL−1 (red; non-responders). Dots and whiskers represent mean±sem. p-values were determined through pairwise t-test with Bonferroni correction. p-interaction values represent repeated measures ANOVA. a) RA active emptying did not change in either of the groups. b) RV active filling improved significantly in Eed responders, while there was no change in non-responders. c) Vena cava backflow normalised in Eed responders, while it did not change in non-responders. BL: baseline; FU: follow-up; ns: nonsignificant.
FIGURE 8.
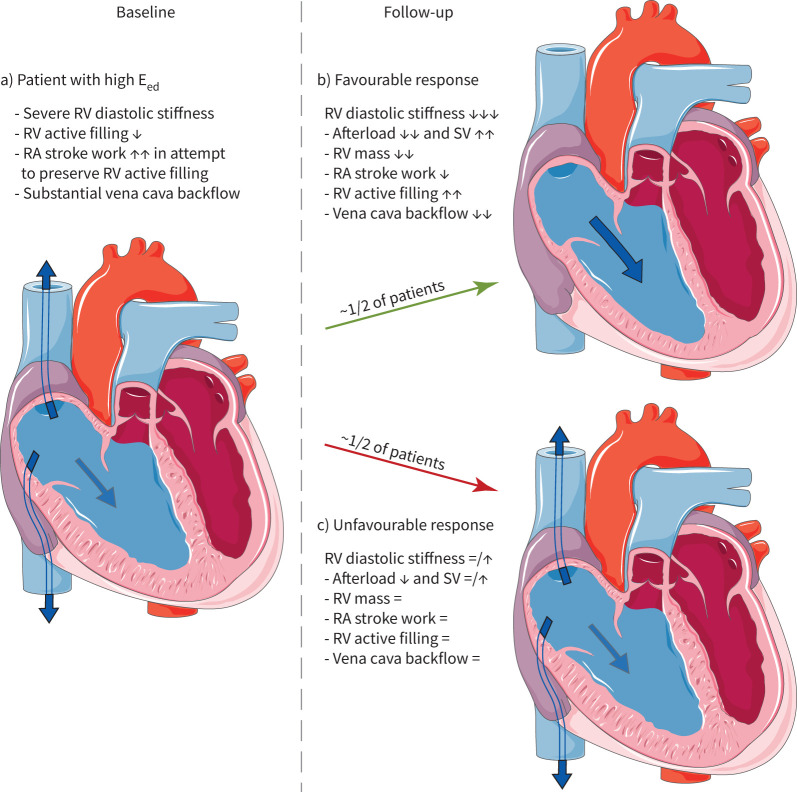
Treatment response in patients with severe right ventricular (RV) diastolic stiffness. a) In pulmonary arterial hypertension (PAH) patients with severe RV diastolic stiffness, RV active filling was reduced even though right atrial (RA) stroke work was enhanced. Consequently, there was substantial backflow to the caval veins. b) Approximately 50% of the patients showed a favourable response. RV afterload was lowered with increase in stroke volume (SV). RV mass decreased with a corresponding decrease in RV diastolic stiffness. RV active filling improved tremendously and vena cava backflow normalised. In other words, with improvement of RV compliance, RA efficiency improved. c) Approximately 50% of the patients did not have a significant decrease of RV mass or RV diastolic stiffness. In these patients, RV active filling remained low and vena cava backflow substantial.
Discussion
By combining measurements of RV diastolic stiffness, RV filling, RA and RV longitudinal wall motion and RA stroke work in PAH patients and controls, we were able to demonstrate the following: 1) RA function is associated with RV diastolic stiffness, with RV passive filling reduced in all patients while increased RA stroke work and active emptying preserve RV active filling in patients with mild, but not severe, RV diastolic stiffness. The surplus of RA active emptying results in significant vena cava backflow. 2) Approximately 50% of the patients with severe RV diastolic stiffness have a relevant reduction in RV diastolic stiffness in response to treatment, which coincides with a large reduction in afterload, improvement of RV stroke volume and reduction in RV mass. In these patients, RV active filling increased and vena cava backflow normalised.
Importance of RA parameters
Both RA pressure and volume parameters are used for risk stratification of PAH patients [16]. We believe RA parameters are important not because they reflect RA failure, but because they are a consequence of RV diastolic stiffness. RA function has recently been assessed by speckle-tracking echocardiography studies [17–21], which showed decreased RA reservoir and passive strain, while active strain was either preserved or increased. RA passive emptying was also lower in PAH, while active emptying was higher [20, 21]. The RA strain pattern in the present study and another recent CMR feature tracking study [13] is in accordance with the echocardiography studies. A relation between RV diastolic dysfunction and RA function has recently been suggested [7, 22]. The peak early diastolic strain rate was associated with RV end-diastolic pressure, Eed, Tau and Ea [22]. CMR feature tracking RA strain in all three cardiac phases correlated with Eed and end-diastolic pressure [7]. Our study is the first to directly compare RA and RV strain patterns. We found that the RV strain pattern was in accordance with RA strain, suggesting a strong interaction between the ventricle and atrium. Furthermore, both RV and RA strain patterns were more severely affected in patients with high Eed than low Eed.
Atrial contraction compensates for loss of passive RV filling
Despite high RV end-diastolic pressure, RA stroke work in PAH was high enough (3–4× that of controls) to induce increased RA active emptying. RV passive filling was strongly reduced, while active filling was preserved in patients with low Eed but not high Eed. With higher Eed, increasingly more backflow occurs [6]. In other words, because of RV diastolic stiffness, the atrium has to contract harder against a higher afterload, whereby substantial backflow to the caval veins occurs. We speculate that this mechanism is probably sufficient to preserve RV filling, preload and stroke volume in most patients, but in severe RV diastolic stiffness this mechanism may fall short. RA–RV uncoupling may occur, as suggested by a weak correlation between RV active filling and stroke volume. From clinical observations this is evident in patients with PAH and atrial fibrillation. As soon as they convert from sinus rhythm to atrial fibrillation, their symptoms may worsen tremendously. Therefore, rhythm control is essential in these patients. Furthermore, patients with severe RV diastolic stiffness have high vena cava backflow, which may induce congestive hepatopathy or cardiorenal syndrome.
Changes in Eed in relation to RV filling
After initiating treatment, we saw a relevant improvement of RV diastolic stiffness in ~50% of the patients (figure 8b). Their afterload decreased by 48%, RV stroke volume improved by 47% and there was a larger decrease of RV mass in this group. Afterload reduction is an important goal of therapy because it may induce a decrease in RV mass. The improvement in Eed may partly be a consequence of decreased RV mass, as described before [5]. However, intrinsic changes in RV myocardium, like collagen deposition and sarcomeric stiffening, may also play a role [3]. As a consequence of the large reduction in Eed (∼50–90%), RV active filling improved and backflow to the caval veins diminished. The other ~50% of the patients had an unfavourable response (figure 8c). Their afterload and RV stroke volume only showed a small, nonsignificant improvement and their RV mass and Eed did not decrease significantly. RV active filling did not improve and vena cava backflow remained substantial. Although fibrosis and sarcomeric stiffening have been implicated in RV stiffening [4], we were not able to investigate this in the current study. Further research is needed to elucidate these different phenotypes of RV diastolic stiffness and their clinical consequences.
Limitations
This was a single-centre study involving three patients groups: idiopathic, hereditary and CTD-PAH. Although there are important differences between these groups, Eed was not different. Vena cava backflow was lower in CTD-PAH, but the distribution across Eed groups was similar. Because a stack of images through the atria was not available in all patients, we determined atrial volumes on the four-chamber view. Although this results in an underestimation of volume, we were able to correct for this by measuring the difference in a set of patients for whom we did have a stack of images through the atria. RA volumes may have been influenced by TR, but none of the patients had severe TR and the prevalence of mild and moderate TR was similar between low and high Eed groups. TR may also induce vena cava backflow, but this is only of significance in a small minority of patients, and very small in comparison with the backflow during atrial contraction [6]. We included patients who were diagnosed between 2002 and 2019. Treatment strategies were therefore subject to changing guidelines over time. Relatively few patients received parenteral prostacyclins, which might have influenced the treatment response. However, because we compared treatment responders with non-responders (irrespective of specific PAH medication), this will not have affected our results. Ees and Eed measurements were based on a single-beat method. Eed has only been validated in an animal model, but it is an often-used and valued measure of RV stiffness. Pressures were measured through fluid-filled catheters, but because Eed is a relative measure, this does not lead to artefacts. Pressures were averaged over at least 10 heartbeats to minimise the influence of respiration.
Conclusion
In PAH, RA function is associated with changes in RV function. Severe RV diastolic stiffness is associated with reduced RV active filling and increased vena cava backflow, while RA stroke work and active emptying are increased. In 50% of patients with high baseline Eed, diastolic stiffness remains high, despite treatment. Eed reduction coincided with a large reduction in afterload, increased RV active filling and decreased vena cava backflow.
Supplementary material
Please note: supplementary material is not edited by the Editorial Office, and is uploaded as it has been supplied by the author.
Supplementary material ERJ-01454-2021.Supplement (1.7MB, pdf)
Shareable PDF
Footnotes
Conflict of interest: J.N. Wessels has nothing to disclose.
Conflict of interest: S.A. Mouratoglou has nothing to disclose.
Conflict of interest: J. van Wezenbeek has nothing to disclose.
Conflict of interest: M.L. Handoko has nothing to disclose.
Conflict of interest: J.T. Marcus has nothing to disclose.
Conflict of interest: L.J. Meijboom has nothing to disclose.
Conflict of interest: B.E. Westerhof has nothing to disclose.
Conflict of interest: H.J. Bogaard was supported by research grants from Actelion, GSK and Ferrer (Therabel).
Conflict of interest: G.J. Strijkers has nothing to disclose.
Conflict of interest: A. Vonk Noordegraaf was supported by research grants from Actelion, GSK and Ferrer (Therabel).
Conflict of interest: F.S. de Man has nothing to disclose.
Support statement: H.J. Bogaard, A. Vonk Noordegraaf and F.S. de Man were supported by the Netherlands CardioVascular Research Initiative: the Dutch Heart Foundation, Dutch Federation of University Medical Centres, the Netherlands Organisation for Health Research and Development and the Royal Netherlands Academy of Sciences (CVON-2012–08 PHAEDRA, CVON-2018–29 PHAEDRA-IMPACT and CVON-2017–10 Dolphin-Genesis). A. Vonk Noordegraaf and F.S. de Man were further supported by The Netherlands Organisation for Scientific Research (NWO-VICI: 918.16.610, NWO-VIDI: 917.18.338). F.S. de Man was supported by the Dutch Heart Foundation Dekker senior post doc grant (2018T059). Funding information for this article has been deposited with the Crossref Funder Registry.
References
- 1.Vonk-Noordegraaf A, Haddad F, Chin KM, et al. Right heart adaptation to pulmonary arterial hypertension: physiology and pathobiology. J Am Coll Cardiol 2013; 62: D22–D33. doi: 10.1016/j.jacc.2013.10.027 [DOI] [PubMed] [Google Scholar]
- 2.Rain S, Andersen S, Najafi A, et al. Right ventricular myocardial stiffness in experimental pulmonary arterial hypertension: relative contribution of fibrosis and myofibril stiffness. Circ Heart Fail 2016; 9: e002636. doi: 10.1161/CIRCHEARTFAILURE.115.002636 [DOI] [PMC free article] [PubMed] [Google Scholar]
- 3.Rain S, Bos Dda S, Handoko ML, et al. Protein changes contributing to right ventricular cardiomyocyte diastolic dysfunction in pulmonary arterial hypertension. J Am Heart Assoc 2014; 3: e000716. doi: 10.1161/JAHA.113.000716 [DOI] [PMC free article] [PubMed] [Google Scholar]
- 4.Rain S, Handoko ML, Trip P, et al. Right ventricular diastolic impairment in patients with pulmonary arterial hypertension. Circulation 2013; 128: 2016–2025. doi: 10.1161/CIRCULATIONAHA.113.001873 [DOI] [PubMed] [Google Scholar]
- 5.Trip P, Rain S, Handoko ML, et al. Clinical relevance of right ventricular diastolic stiffness in pulmonary hypertension. Eur Respir J 2015; 45: 1603–1612. doi: 10.1183/09031936.00156714 [DOI] [PubMed] [Google Scholar]
- 6.Marcus JT, Westerhof BE, Groeneveldt JA, et al. Vena cava backflow and right ventricular stiffness in pulmonary arterial hypertension. Eur Respir J 2019; 54: 1900625. doi: 10.1183/13993003.00625-2019 [DOI] [PubMed] [Google Scholar]
- 7.Tello K, Dalmer A, Vanderpool R, et al. Right ventricular function correlates of right atrial strain in pulmonary hypertension: a combined cardiac magnetic resonance and conductance catheter study. Am J Physiol Heart Circ Physiol 2020; 318: H156–HH64. doi: 10.1152/ajpheart.00485.2019 [DOI] [PubMed] [Google Scholar]
- 8.Trip P, Kind T, van de Veerdonk MC, et al. Accurate assessment of load-independent right ventricular systolic function in patients with pulmonary hypertension. J Heart Lung Transplant 2013; 32: 50–55. doi: 10.1016/j.healun.2012.09.022 [DOI] [PubMed] [Google Scholar]
- 9.Tello K, Richter MJ, Axmann J, et al. More on single-beat estimation of right ventriculoarterial coupling in pulmonary arterial hypertension. Am J Respir Crit Care Med 2018; 198: 816–818. doi: 10.1164/rccm.201802-0283LE [DOI] [PubMed] [Google Scholar]
- 10.Brener MI, Burkhoff D, Sunagawa K. Effective arterial elastance in the pulmonary arterial circulation: derivation, assumptions, and clinical applications. Circ Heart Fail 2020; 13: e006591. doi: 10.1161/CIRCHEARTFAILURE.119.006591 [DOI] [PubMed] [Google Scholar]
- 11.van de Veerdonk MC, Kind T, Marcus JT, et al. Progressive right ventricular dysfunction in patients with pulmonary arterial hypertension responding to therapy. J Am Coll Cardiol 2011; 58: 2511–2519. doi: 10.1016/j.jacc.2011.06.068 [DOI] [PubMed] [Google Scholar]
- 12.Li W, Wan K, Han Y, et al. Reference value of left and right atrial size and phasic function by SSFP CMR at 3.0T in healthy Chinese adults. Sci Rep 2017; 7: 3196. doi: 10.1038/s41598-017-03377-6 [DOI] [PMC free article] [PubMed] [Google Scholar]
- 13.Leng S, Dong Y, Wu Y, et al. Impaired cardiovascular magnetic resonance-derived rapid semiautomated right atrial longitudinal strain is associated with decompensated hemodynamics in pulmonary arterial hypertension. Circ Cardiovasc Imaging 2019; 12: e008582. doi: 10.1161/CIRCIMAGING.118.008582 [DOI] [PubMed] [Google Scholar]
- 14.Zoghbi WA, Adams D, Bonow RO, et al. Recommendations for noninvasive evaluation of native valvular regurgitation: a report from the American Society of Echocardiography developed in collaboration with the Society for Cardiovascular Magnetic Resonance. J Am Soc Echocardiogr 2017; 30: 303–371. doi: 10.1016/j.echo.2017.01.007 [DOI] [PubMed] [Google Scholar]
- 15.Marcus JT, Gan CT, Zwanenburg JJ, et al. Interventricular mechanical asynchrony in pulmonary arterial hypertension: left-to-right delay in peak shortening is related to right ventricular overload and left ventricular underfilling. J Am Coll Cardiol 2008; 51: 750–757. doi: 10.1016/j.jacc.2007.10.041 [DOI] [PubMed] [Google Scholar]
- 16.Galie N, Humbert M, Vachiery JL, et al. 2015 ESC/ERS guidelines for the diagnosis and treatment of pulmonary hypertension: the Joint Task Force for the Diagnosis and Treatment of Pulmonary Hypertension of the European Society of Cardiology (ESC) and the European Respiratory Society (ERS). Eur Respir J 2015; 46: 903–975. doi: 10.1183/13993003.01032-2015 [DOI] [PubMed] [Google Scholar]
- 17.Alenezi F, Mandawat A, Il'Giovine ZJ, et al. Clinical utility and prognostic value of right atrial function in pulmonary hypertension. Circ Cardiovasc Imaging 2018; 11: e006984. doi: 10.1161/CIRCIMAGING.117.006984 [DOI] [PMC free article] [PubMed] [Google Scholar]
- 18.Bhave NM, Visovatti SH, Kulick B, et al. Right atrial strain is predictive of clinical outcomes and invasive hemodynamic data in group 1 pulmonary arterial hypertension. Int J Cardiovasc Imaging 2017; 33: 847–855. doi: 10.1007/s10554-017-1081-7 [DOI] [PMC free article] [PubMed] [Google Scholar]
- 19.D'Alto M, D'Andrea A, Di Salvo G, et al. Right atrial function and prognosis in idiopathic pulmonary arterial hypertension. Int J Cardiol 2017; 248: 320–325. doi: 10.1016/j.ijcard.2017.08.047 [DOI] [PubMed] [Google Scholar]
- 20.Meng X, Li Y, Li H, et al. Right atrial function in patients with pulmonary hypertension: a study with two-dimensional speckle-tracking echocardiography. Int J Cardiol 2018; 255: 200–205. doi: 10.1016/j.ijcard.2017.11.093 [DOI] [PubMed] [Google Scholar]
- 21.Querejeta Roca G, Campbell P, Claggett B, et al. Right atrial function in pulmonary arterial hypertension. Circ Cardiovasc Imaging 2015; 8: e003521. doi: 10.1161/CIRCIMAGING.115.003521 [DOI] [PMC free article] [PubMed] [Google Scholar]
- 22.Richter MJ, Fortuni F, Wiegand MA, et al. Association of right atrial conduit phase with right ventricular lusitropic function in pulmonary hypertension. Int J Cardiovasc Imaging 2020; 36: 633–642. doi: 10.1007/s10554-019-01763-x [DOI] [PubMed] [Google Scholar]
Associated Data
This section collects any data citations, data availability statements, or supplementary materials included in this article.
Supplementary Materials
Please note: supplementary material is not edited by the Editorial Office, and is uploaded as it has been supplied by the author.
Supplementary material ERJ-01454-2021.Supplement (1.7MB, pdf)
This one-page PDF can be shared freely online.
Shareable PDF ERJ-01454-2021.Shareable (435.5KB, pdf)


