

Abstract
Longer exclusive breastfeeding duration has been associated with differences in neural development, better satiety responsiveness, and decreased risk for childhood obesity. Given hippocampus sensitivity to diet and potential role in the integration of satiety signals, hippocampus may play a role in these relationships. We conducted a secondary analysis of 149, 7–11‐year‐olds (73 males) who participated in one of five studies that assessed neural responses to food cues. Hippocampal grey matter volume was extracted from structural scans using CAT12, weight status was assessed using age‐ and sex‐adjusted body mass index (%BMIp85), and parents reported exclusive breastfeeding duration and satiety responsiveness (Children's Eating Behaviour Questionnaire). Separate path models for left and right hippocampus tested: (1) the direct effect of exclusive breastfeeding on satiety responsiveness and its indirect effect through hippocampal grey matter volume; (2) the direct effect of hippocampal grey matter volume on %BMIp85 and its indirect effect through satiety responsiveness. %BMIp85 was adjusted for maternal education, yearly income, and premature birth while hippocampal grey matter volume was adjusted for total intercranial volume, age, and study from which data were extracted. Longer exclusive breastfeeding duration was associated with greater bilateral hippocampal grey matter volumes. In addition, better satiety responsiveness and greater left hippocampal grey matter volume were both associated with lower %BMIp85. However, hippocampal grey matter volumes were not associated with satiety responsiveness. Although no relationship was found between breastfeeding and child weight status, these results highlight the potential impact of exclusive breastfeeding duration on the hippocampal structure.
Keywords: brain, breastfeeding, child, feeding behavior, grey matter, hippocampus, obesity
Given that hippocampus is sensitive to diet, it may play a role in the associations between longer exclusive breastfeeding duration, better satiety responsiveness, and decreased risk for childhood obesity. Longer exclusive breastfeeding duration was associated with greater bilateral hippocampal grey matter volumes. While breastfeeding duration was not associated with child weight status, better satiety responsiveness and greater left hippocampal grey matter volume were both associated with lower weight status. These results highlight the potential impact of exclusive breastfeeding duration on the hippocampal structure.
Key messages
Longer exclusive breastfeeding was associated with greater bilateral hippocampal grey matter volume but not satiety responsiveness in children.
While exclusive breastfeeding duration was not directly associated with weight status, better satiety responsiveness and greater left hippocampal grey matter volume were both associated with lower weight status in children.
This study highlights the potential impact of exclusive breastfeeding on hippocampal structure, providing a possible mechanism in which breastfeeding may reduce the risk for excess childhood weight gain.
Future studies need to determine the relative impact that complementary periods of breastfeeding may have on regional brain development and satiety responsiveness.
Abbreviations
- ARA
arachidonic acid
- BMI, kg/m2
body mass index
- CEBQ
Child Eating Behavior Questionnaire
- CFI
comparative fit index
- DHA
docosahexaenoic
- MRI
magnetic resonance imaging
- RMSEA
root mean square error of approximation
- SB
Satorra–Bentler
- SD
standard deviation
- SRMR
standardised root mean square residual
- TIV
total intercranial volume
- %BMIp85
85th percentile BMI cutoff
1. INTRODUCTION
As one in three of children in the United States have overweight or obesity, it is important to understand how early‐life modifiable factors like breastfeeding impact the risk for obesity (Fryar et al., 2018). Longer exclusive breastfeeding durations are associated with decreased risk for childhood obesity (Arenz et al., 2004; Birth to 24 Month Subcommittee, 2020; Metzger & McDade, 2010), however, the mechanisms underlying this association remain unclear. One proposed mechanism is that breastfeeding improves the ability to eat in response to internal satiety signals because the baby has more control over the amount consumed due to the absence of external visual cues present when bottle feeding (Brown & Lee, 2012). This is proposed to reduce maternal feeding pressure for the infant to eat beyond satiation (Bartok & Ventura, 2009; Brown & Lee, 2012; Carnell & Wardle, 2007). Adding support to this mechanism, children and adolescents who were breastfed for longer durations show better trait‐related response to satiety signals compared with those who were breastfed for shorter durations (Brown & Lee, 2012; Reyes et al., 2014). Although satiety responsiveness is heritable (Carnell et al., 2008), these studies suggest it is also influenced by modifiable factors such as infant feeding practices. Given its association with lower adiposity and weight status in children and adolescents (Carnell & Wardle, 2008), increased satiety responsiveness may be one mechanism through which a longer duration of exclusive breastfeeding is associated with decreased risk for childhood obesity.
Breastfeeding may also impact childhood obesity through its influence on early brain development (Bartok & Ventura, 2009; Das, 2001). Breastmilk contains greater amounts of the long‐chain fatty acids docosahexaenoic (DHA) and arachidonic acid (ARA; Das, 2001; Fu et al., 2016) than formula (Lien et al., 2018). DHA and ARA are important for the development of myelin, the fatty white matter that sheaths neuronal axons to improve neurotransmission (Butt et al., 2014; Deoni et al., 2018; Lien et al., 2018; Singh, 2005). Therefore, greater global myelination in exclusively breastfed relative to formula‐fed infants and young children may be due to higher concentrations of DHA and ARA in breastmilk (Deoni et al., 2018). Although the mechanism is unclear, breastfeeding has also been associated with differences in grey matter which consists of neuronal cell bodies, glial cells, and synapses. Longer breastfeeding durations have been associated with greater hippocampal volume in infants born prematurely (Belfort et al., 2016) as well as greater total (Luby et al., 2016) and regional (e.g., parietal and temporal; Ou et al., 2016) grey matter volume in children born full‐term. Overall, this suggests that breastfeeding may have an impact on both grey and white matter brain development in children.
Although breastfeeding has been associated with differences in brain structure across many regions, differences in hippocampal structure may be particularly important when considering risk for excess weight gain (Clasen et al., 2020; Masterson, Bobak et al., 2019; Z. L. Mestre et al., 2017; Stevenson & Francis, 2017). Hippocampus is sensitive to diet and contributes to the regulation of food intake through the integration of hormonal (e.g., ghrelin, leptin) and cognitive (e.g., memory, learning, craving) signals (Stevenson & Francis, 2017). However, the relationship between hippocampal volume and weight status remains unclear as some studies have reported no association in children (Adise et al., 2021; Ou et al., 2016; Perlaki et al., 2018) or adolescents (Z. Mestre et al., 2020), while other studies show a mixed pattern of results. There is evidence that greater child weight status is associated with both lower left hippocampal volume (Bauer et al., 2015; Z. L. Mestre et al., 2017) and higher right hippocampal volume (Masterson, Bobak et al., 2019). Longitudinally, there is also evidence in children and adolescents that smaller increases in body mass index (BMI) over 3 years were associated with greater increases in right medial temporal lobe grey matter volume, an area that includes the hippocampus (Hashimoto et al., 2015). Therefore, while the hippocampal structure may be sensitive to breastfeeding, it remains unclear whether differences in hippocampal structure contribute to the reduced risk for childhood obesity associated with breastfeeding.
The objective of this secondary data analysis was to use path analyses to test the hypothesis that exclusive breastfeeding duration would be associated with childhood weight status through its influence on satiety responsiveness and hippocampal volume. The proposed analyses will contribute to our understanding of the mechanisms through which breastfeeding impacts childhood weight status.
2. SUBJECTS AND METHODS
2.1. Participants
Children from the ages of 7–11 years old (mean = 9, SD = 1.21) were enroled in one of five prior studies designed to assess child eating behaviour and neural responses to food cues. All studies were approved by the Institutional Review Board at The Pennsylvania State University. Assent and consent were obtained from the children and parents, respectively. In total, 149 children were included (73 males and 76 females). Exclusion criteria for participants across the five prior studies included any contraindications for magnetic resonance imaging (MRI; e.g., metal implants, claustrophobia), medications that could influence taste, psychological or learning disorders (e.g., attention‐deficit hyperactivity disorder), left‐handedness, food allergies, and parents reporting that the child disliked the food served in the primary studies (Adise et al., 2018; English et al., 2017; Keller et al., 2018; Masterson, Bermudez et al., 2019). The sample ranged in weight status, with 73% (n = 108) of children classified as having healthy weight (healthy weight < 85th percentile), 14% (n = 20) as having overweight (overweight 85th‐94.9th percentile), and 13% (n = 20) as having obesity (obese > 95th percentile; Kuczmarski et al., 2002). No children had underweight (<5th percentile). The ethnic and racial diversity of the cohort was limited but in line with the demographics of rural central Pennsylvania (94.5% Caucasian). There were no differences in demographic characteristics by sex (p's > 0.250). Full participant demographics are presented in Table 1.
Table 1.
Participant characteristics
| Full sample | Males | Females | |
|---|---|---|---|
| Total, N | 149 | 73 | 76 |
| Age, years, mean (SD) | 8.99 (1.21) | 8.96 (1.20) | 9.00 (1.23) |
| %BMIp85, mean (SD) | 98.2 (17.5) | 97.2 (18.1) | 99.2 (16.9) |
| Race, N | |||
| Black/African American | 7 | 5 | 2 |
| White | 136 | 64 | 72 |
| Other/mixed | 6 | 4 | 2 |
| Ethnicity, N | |||
| Hispanic/Latino | 6 | 3 | 3 |
| Not Hispanic/Latino | 120 | 59 | 61 |
| Not reported | 23 | 11 | 12 |
| Yearly income, N | |||
| >$100,000 | 49 | 26 | 23 |
| $51,000–$100,000 | 69 | 30 | 39 |
| <$50,000 | 28 | 16 | 12 |
| Not reported | 3 | 1 | 2 |
| Maternal education, N | |||
| >BA degree | 50 | 22 | 28 |
| BA degree | 54 | 30 | 24 |
| Associates/technical degree | 12 | 5 | 7 |
| High school/some college | 21 | 10 | 11 |
| Other/not reported | 12 | 6 | 6 |
| Parental education, N | |||
| >BA degree | 57 | 28 | 29 |
| BA degree | 38 | 22 | 16 |
| Associates/technical degree | 8 | 2 | 6 |
| High school/some college | 31 | 12 | 19 |
| Other/not reported | 15 | 9 | 6 |
| Exclusive breastfeeding duration, N | |||
| >6 months | 54 | 24 | 30 |
| 4–6 months | 55 | 29 | 26 |
| 0–3 months | 40 | 20 | 20 |
Note: Sex differences were tested with χ 2 and Fisher exact tests. There were no sex differences; p's > 0.250.
Abbreviations: %BMIp85, body mass index/body mass index at 85th percentile; BA, bachelor's level degree; SD, standard deviation.
2.2. Measures
2.2.1. Family and early life
Yearly family income and parental education were used as proxies for socioeconomic status (Bradley & Corwyn, 2002). These measures were reported through a demographic survey by the parent that accompanied the child to the visit, which was the mother 90.6% of the time (n = 135). Exclusive breastfeeding, defined as a diet consisting of breastmilk with no other food or drink (Infant, 2002), was measured by asking parents: ‘If breastfed, for how many months was he/she exclusively breastfed?’ Due to some parents providing a range of months rather than a discrete number, length of exclusive breastfeeding was subsequently divided into the following intervals: 0–3, 3–6, and >6 months. Children whose parents reported 0 months of exclusive breastfeeding were included in the interval ‘0–3 months’. These intervals were chosen as 6 months of exclusive breastfeeding is the current recommendation from the American Academy of Pediatrics (American Academy of Pediatrics, 2012). Prematurity was determined by a parent reporting if their child was born premature.
2.2.2. Satiety responsiveness
The Children's Eating Behavior Questionnaire (CEBQ) was used to assess child appetitive traits. This instrument is a validated parent‐report questionnaire that assesses eight appetitive traits (Wardle et al., 2001). While parents completed the entire questionnaire, the current study only used the satiety responsiveness subscale, which asks parents to rate the frequency of five behaviours related to the child's ability to recognise and respond to internal hunger and satiety signals (Carnell & Wardle, 2007). The frequency of each behavior was rated on a 5‐point scale (never = 1, rarely = 2, sometimes = 3, often = 4, always = 5) and responses showed good internal reliability ( = 0.75).
2.2.3. Anthropometrics
Child height and weight were measured twice using a stadiometer (Detecto model 437; precision to the nearest 0.1 cm) and standard electronic scale (Seca model 202; precision to nearest 0.1 kg). Averaged measured height and weight were used to calculate BMI (weight, kg/height2, m2). To account for age and sex, we divided the child's BMI by the BMI at the Centers for Disease Control age‐ and sex‐specific cutoff for overweight (85th percentile BMI cutoff %BMIp85 = 100x(BMI/BMI at 85th percentile); Freedman et al., 2017; Kuczmarski et al., 2002). Therefore, a value of 100% indicates the child's BMI is equal to the BMI at the overweight cutoff (i.e., 85th percentile), a value less than 100% indicates the child's BMI is below the overweight cutoff (i.e., does not have overweight), and a value greater than 100% means the child's BMI is above the overweight cutoff (i.e., has overweight or obesity). The calculated %BMIp85 was used as it is more strongly associated with adiposity measures in children than that of BMIz or BMI percentile (Freedman et al., 2017). For demographic purposes, children were also classified according to weight status using percentile cutoffs (healthy weight < 85th percentile, overweight 85th–94.9th percentile, and obese > 95th percentile).
2.2.4. Mock training for MRI
Before the MRI scan, participants completed a training session using a mock MRI scanner. These sessions familiarized the participants with the MRI environment while allowing them to practice holding still under observation. Participants were instructed to lie still in the mock scanner while they heard sounds similar to those heard in the MRI scanner. For full protocol details, see previous functional MRI publications (Adise et al., 2019; English et al., 2017; Keller et al., 2018; Masterson, Bermudez et al., 2019).
2.2.5. MRI acquisition
To restrict movement, padding around the head, arms, and body was used. While all data were acquired using the same Siemens Prisma Fit 3T scanner, the exact parameters used for MPRAGE acquisition varied between studies (see Table S1). Previous studies have demonstrated scan variability can be mitigated with the inclusion of study as a covariate (Chen et al., 2014; Fennema‐notestine et al., 2007; Pardoe et al., 2008; Takao et al., 2014), therefore, study number was controlled for in all statistical models.
2.3. Analytic approach
2.3.1. Structural data
Before processing the structural MRI scans, all scans were manually reviewed for quality by two trained raters (authors R. C. H. and J. A.). Each scan was rated for warping, clipping, ringing, ghosting, and blurriness based on the following scale: 0‐perfect, 1‐isolated errors, 2‐local moderate errors, 3‐distributed moderate errors, 4‐distributed severe errors, 5‐immediate exclusion. The raters had complete agreement on warping and clipping and showed good reliability on all other categories based on intraclass correlation coefficients (ringing = 0.89, ghosting = 0.76, and blurriness = 0.81). Any participant with an average rating of 4 or higher was excluded from our data set (n = 3). For participants that were included in multiple studies, the participant's best quality scan was used.
All scans were analysed using the SPM12 software (https://www.fil.ion.ucl.ac.uk/spm; version 7771) and the Computational Anatomy Toolbox (http://www.neuro.uni-jena.de/cat/; version 12.6, 1444) in Matlab R2018a. As the standard tissue probability maps are derived from adults, who differ in cortical anatomy from children (Yoon et al, 2009), a study‐specific tissue probability map was generated using the CerebroMatic toolbox with age and sex as covariates of no interest (Wilke et al., 2017). In native space, the scans were bias‐ and noise‐corrected, skull stripped, and segmented into grey matter, white matter, and cerebrospinal fluid. Individual total intercranial volume (TIV) was computed by adding these tissue volumes in native space. Estimation of hippocampal volumes was derived from the neuromorphometrics atlas (Neuromorphometrics, Inc.) in native space. Image quality was assessed via a weighted measure of noise and bias. Total grey matter volume was extracted for the left and right hippocampus for offline analyses.
2.3.2. Path models
All analyses were conducted in R (Team, 2012) with path analyses completed using the package lavaan (version 0.6‐7; Rosseel, 2012). The same model (Figure 1a) using maximum likelihood estimation was tested for both left and right hippocampus.
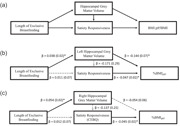
Figure 1.

Exclusive breastfeeding model for childhood obesity development. (a) Path model; (b) exclusive breastfeeding model for left hippocampal grey matter volume; and (c) exclusive breastfeeding model for right hippocampal grey matter volume. Path unstandardised model coefficients and standard errors are listed. 85th Percentile BMI cutoff% (BMIp85): ratio of child's body mass index (BMI, kg/m2) to child's age‐ and sex‐specific BMI cutoff for overweight (i.e., Centres for Disease Control growth chart 85th percentile). Dashed grey line: indicates nonsignificant association, *solid black line: indicates significant association (p < 0.05)
The model tested direct associations between (1) exclusive breastfeeding duration and satiety responsiveness and hippocampal grey matter volume and between (2) hippocampal grey matter volume and %BMIp85 and satiety responsiveness. Additionally, the model tested the indirect associations between (1) exclusive breastfeeding duration and satiety responsiveness through hippocampal grey matter volume and (2) hippocampal grey matter volume and %BMIp85 through satiety responsiveness. We hypothesised that longer breastfeeding duration would be associated with greater hippocampal grey matter volume and that hippocampal grey matter volume would mediate the positive association between exclusive breastfeeding duration and satiety responsiveness. Additionally, we hypothesised greater hippocampal grey matter volume would be associated with better satiety responsiveness and that satiety responsiveness would mediate the association between hippocampal grey matter volume and %BMIp85. As socioeconomic status and prematurity can impact breastfeeding and body size, paths (see Figure 1a) predicting breastfeeding duration and %BMIp85 controlled for prematurity, maternal education, and yearly income. In paths that included hippocampal grey matter volume, we adjusted for TIV, age, and study.
Model goodness of fit was assessed with Satorra–Bentler scaled χ 2 test statistic (Satorra & Bentler, 1988, 1994), root mean square error of approximation (RMSEA; Brosseau‐Liard et al., 2012), comparative fit index (CFI; Brosseau‐Liard & Savalei, 2014), and the standardised root mean square residual (SRMR). Model fits were considered acceptable if they conformed to the following guidelines: χ 2 p > 0.05, RMSEA < 0.08, CFI > 0.90, and SRMR < 0.08 (Hooper et al., 2008). The path models showed a good fit for both left hippocampus (χ 2(3) = 3.50, p = 0.321; RMSEA = 0.036; CFI = 0.996; and SRMR = 0.013) and right hippocampus (χ 2(3) = 2.65, p = 0.448; RMSEA < 0.001; CFI = 1.00; and SRMR = 0.013). The α value that was used to determine statistical significance was 0.05.
3. RESULTS
3.1. Descriptive
An overview of the associations between model covariates and primary outcomes of interest is presented with a full report of the descriptive, statistical, and post‐hoc tests in the Supporting Information. Exclusive breastfeeding duration did not differ by any covariates included in the model (p's > 0.078). While satiety responsiveness was positively associated with yearly family income (p = 0.038), it was not associated with age, TIV, sex, maternal education, or prematurity (p's > 0.254). Left and right hippocampal grey matter volume were smaller in younger children (left: p = 0.009, right: p = 0.040), in children with smaller TIV (left: p < 0.001; right: p < 0.001), in females compared with males (left: p = 0.001; right: p = 0.003), and in children whose parents reported that they were born prematurely compared with those who were not (left: p = 0.036; right: p = 0.020; see Supporting Information). While both left and right hippocampal grey matter volume were positively associated with income (left: p = 0.008; right: p = 0.003), neither were associated with maternal education (left: p = 0.643; right: p = 0.349). %BMIp85 was negatively associated with maternal education (p = 0.013; see Supporting Information for post‐hoc comparisons). There were no other differences in model covariates by %BMIp85 (p's > 0.124).
3.2. Path analyses
3.2.1. Path model for left hippocampus (Figure 1b)
Unstandardised coefficients and standard errors are presented in Figure 1b for primary outcomes of interest with full model statistics in Table S2. Length of exclusive breastfeeding was not significantly associated with satiety responsiveness (p = 0.863) but was positively associated with left hippocampal grey matter volume (p = 0.046). Post‐hoc comparison indicated that children who were exclusively breastfed for 4–6 months had larger left hippocampal grey matter volume (mean [SD] = 2.98 [0.24] mm3) than those exclusively breastfed for 0–3 months (mean [SD] = 2.87 [0.26] mm3; t(82) = −2.25, p = 0.027). Left hippocampal grey matter volume did not differ between children who were exclusively breastfed for greater than 6 months (mean [SD] = 2.93 [0.24] mm3) and those exclusively breastfed for 4–6 months (t[104] = −1.09, p = 0.277) or 0–3 months (t[81] = 1.29, p = 0.202). Left hippocampal grey matter volume was not significantly associated with satiety responsiveness (p = 0.557) and there was no evidence for an indirect effect of breastfeeding duration on satiety responsiveness through left hippocampal grey matter volume (indirect effect: −0.006 [0.01], p = 0.573).
Left hippocampal grey matter volume was negatively associated with %BMIp85 (Figure 1b) such that children who had greater grey matter volume had lower BMI relative to their age‐ and sex‐specific overweight cutoff (p = 0.046). For example, using the sample's average age‐ and sex‐specific overweight cutoff (mean 85th percentile cutoff = 19 kg/m2), for each 1 mm3 more grey matter volume, children would be expected to have 2.7 fewer BMI units (i.e., 14.4% of 19 kg/m2 = 2.7 kg/m2). Additionally, satiety responsiveness was negatively associated with %BMIp85 such that children with better satiety responsiveness score had lower BMI relative to their age‐ and sex‐specific overweight cutoff (p = 0.034). For example, for each 1‐point increase in satiety responsiveness score, a child at the sample's average age‐ and sex‐specific overweight cutoff (19 kg/m2) would be expected to have 0.88 fewer BMI units (i.e., 4.7% of the average 85th percentile cutoff). However, there was no evidence for an indirect effect of left hippocampal grey matter volume on %BMIp85 through satiety responsiveness (indirect effect: 0.008 [0.01], p = 0.571).
3.2.2. Sensitivity tests for left hippocampus
As none of the hypothesised indirect effects were significant, we conducted a sensitivity analysis to determine the direct effect of exclusive breastfeeding duration on %BMIp85. Exclusive breastfeeding duration was not associated with %BMIp85 (p = 0.337; Table S3). While the association between left hippocampal grey matter volume and %BMIp85 weakened when adjusting for exclusive breastfeeding duration (p = 0.068), the overall pattern of results for the did not change (Table S3).
Given the association between left hippocampal grey matter volume and income, we conducted a separate sensitivity analysis. Income was not associated with left hippocampal volume (p = 0.465) after adjusting for other independent variables in the model. While the association between breastfeeding duration and left hippocampal grey matter weakened after adjusting for income (p = 0.060), the overall pattern of the results did not change (see Table S4).
3.2.3. Path model for right hippocampus (Figure 1c)
Primary path coefficients and standard errors are presented in Figure 1c with full model statistics in Table S5. Length of exclusive breastfeeding was not associated with satiety responsiveness (p = 0.850) but was positively associated with right hippocampal grey matter volume (p = 0.016). Post‐hoc tests indicated that children who were exclusively breastfed for 4–6 months had larger right hippocampal grey matter volume (mean [SD] = 3.31 [0.29] mm3) than those exclusively breastfed for 0–3 months (mean [SD] = 3.18 [0.29]; t[84] = −2.17, p = 0.033). However, right hippocampal grey matter volume did not differ between children who were exclusively breastfed for greater than 6 months (mean [SD] = 3.29 [0.27] mm3) and those exclusively breastfed for 4–6 months (t[104] = −0.42, p = 0.673) or 0–3 months (t[81] = 1.84, p = 0.069). Right hippocampal grey matter volume was not associated with satiety responsiveness (p = 0.576) and there was no evidence for an indirect effect of breastfeeding duration on satiety responsiveness through right hippocampal grey matter volume (indirect effect: −0.007 [0.01], p = 0.586).
Right hippocampal grey matter volume was not associated with %BMIp85 (p = 0.374). However, satiety responsiveness was negatively associated with %BMIp85 such that for every 1‐point increase in the CEBQ satiety responsiveness, BMI decreased by 4.5% of the BMI at the overweight cutoff (p = 0.041). Therefore, a 1‐point increase in satiety responsiveness was associated with a 0.86 kg/m2 decrease in BMI from the average cutoff for overweight (i.e., mean 85th percentile cutoff = 19 kg/m2). However, there was no evidence for an indirect effect of right hippocampal grey matter volume on %BMIp85 through satiety responsiveness (indirect effect: 0.006 [0.01], p = 0.590).
3.2.4. Sensitivity tests for right hippocampus
As none of the hypothesised indirect effects were significant, we conducted a sensitivity analysis to determine the direct effect of exclusive breastfeeding duration on %BMIp85. Exclusive breastfeeding duration was not associated with %BMIp85 (p = 0.227; Table S6) and the overall pattern of results for the did not change (Table S6).
Given the association with right hippocampal grey matter volume and income, we conducted a separate sensitivity analysis to determine if it was affecting the relationships of interest. Income was not associated with right hippocampal volume after adjusting for other independent variables (p = 0.275). The association between breastfeeding duration and the right hippocampal grey matter remained significant after adjusting for income (p = 0.025) and the pattern of the results did not change (see Table S7).
4. DISCUSSION
The current study proposed a model for the role of breastfeeding in susceptibility to childhood obesity through its influence on satiety responsiveness and hippocampal structure. We hypothesised that longer breastfeeding duration would be associated with better satiety responsiveness due to greater hippocampal grey matter volume, which would in turn be associated with lower weight status. We showed longer exclusive breastfeeding duration was associated with greater bilateral hippocampal grey matter volume but was not directly associated with satiety responsiveness or weight status. However, both greater left hippocampal grey matter and better satiety responsiveness were independently associated with lower weight status. These results partially support our model and suggest that exclusive breastfeeding may impact hippocampal structure in middle childhood and that hippocampal structure and satiety responsiveness can both independently influence child weight status.
Extending previous findings, longer exclusive breastfeeding duration was associated with greater bilateral hippocampal grey matter volume in childhood. This differs from previous work showing that 7–8‐year‐old children who were breastfed had greater inferior temporal lobe grey matter volume relative to those who were not, but the groups did not differ in hippocampal grey matter volume (Ou et al., 2016). As the age of children in that study were comparable to the current study, the discrepancy in these findings suggests that the duration of exclusive breastfeeding may be more sensitive to individual differences in hippocampal structure than the dichotomous distinction of having been breastfed or not. Indeed, longer breastfeeding duration in infants born premature was predictive of larger hippocampal volume at age 7 years (Belfort et al., 2016). However, this association did not remain significant after accounting for markers of socioeconomic status (Belfort et al., 2016). Indeed, socioeconomic factors such as parental education have been shown to be independently associated with hippocampal volume (Noble et al., 2015). While the current study adjusted for maternal education and family income, we did not control for other social risk factors included in Belfort et al. (2016) such as maternal age, marital and employment status, and native language (Belfort et al., 2016). Therefore, these findings highlight the need to delineate social factors that may influence the impact of breastfeeding on hippocampal grey matter volume.
The association between larger left hippocampal grey matter volume and lower adjusted BMI replicates findings showing an association between left hippocampal structure and weight status (Bauer et al., 2015; Lynch et al., 2020; Z. L. Mestre et al., 2017). However, previous studies also contradict this finding by showing either no association (Adise et al., 2021; Perlaki et al., 2018) or a positive association between weight status and right hippocampal volume (Masterson, Bobak et al., 2019; Moreno‐Lopez et al., 2012). The inconsistent pattern of results across the literature may be related to distinct cognitive processes subserved by left and right hippocampus. Left hippocampus is important for episodic and context‐dependent memory while right hippocampus is thought to be more important for memory processes that support navigation (Iglói et al., 2010). Episodic memory processes are important for the regulation of eating behaviour (Higgs & Spetter, 2018) with previous findings indicating better memory for recent eating episodes was associated with greater avoidance of fatty foods and less uncontrolled eating (Martin et al., 2018). Therefore, left hippocampus may be more consistently associated with weight status due to the importance of episodic memory processes in the regulation of food intake.
Although greater left hippocampal grey matter volume and better satiety responsiveness were both associated with lower adjusted BMI, there was no association between hippocampal volume and satiety responsiveness. Due to the role of hippocampus in integrating information related to physiological energy needs (e.g., leptin, hypothalamic signalling; Kanoski & Grill, 2017) with higher‐order cognitive signals (e.g., reward, inhibitory control; Kanoski & Grill, 2017; Stevenson & Francis, 2017), we hypothesised hippocampal structure would be related to satiety responsiveness. However, while satiety responsiveness is often thought of as a physiological process (Blundell et al., 2010) it is also influenced by social and cognitive factors (Burgess & Faith, 2018; Higgs & Spetter, 2018; Martin et al., 2018). For example, children's satiety responsiveness improved after interventions focused on eating in response to internal hunger and fullness cues (Johnson, 2000; Reigh et al., 2020). Future studies are needed to clarify the influences of hippocampal structure and satiety responsiveness on weight status.
Lastly, there was no association between breastfeeding duration and satiety responsiveness, which contradicts past studies showing longer breastfeeding duration was associated with better satiety responsiveness in toddlers (Brown & Lee, 2012) and adolescents (Reyes et al., 2014). Similar to the current study, Brown and Lee (2012) examined this relationship in toddlers by measuring maternally reported exclusive breastfeeding duration, which suggests that exclusive breastfeeding duration may be more closely associated with satiety responsiveness during toddlerhood than middle childhood as examined in this study. The effect of infant feeding practices on satiety responsiveness may be mitigated as children age due, in part, to the influence of parent feeding practices, such as restrictive or controlling parental feeding styles, on child satiety responsiveness (Johnson & Birch, 1994). In contrast, the discrepancy between the current study and Reyes et al. (2014) may be related to the measurement of breastfeeding duration. While Reyes et al. (2014) required that no other source of milk was used in feeding, they recognised their measure did not assess exclusive breastfeed duration as it likely included periods of complementary feeding. Therefore, total breastfeeding duration, including periods of complementary feeding, may be more strongly associated with satiety responsiveness later in childhood and adolescence as compared with exclusive breastfeeding duration as measured in the current study. This may be due to the continued protective influence of breastfeeding during complementary feeding since breastfed babies have been shown to decrease milk intake (i.e., compensate) with the introduction of solid foods whereas babies fed formula did not (Bartok & Ventura, 2009; Heinig et al., 1993). Together, this highlights the need to better understand how periods of complementary feeding interact with exclusive breastfeeding to influence satiety responsiveness across development.
The current results should be considered in light of limitations that are common to cross‐sectional studies. While sample demographic characteristics reflect that of central Pennsylvania, the lack of racial and ethnic diversity impacts the extent to which our results can be generalised to more diverse populations. Additionally, while the ratio of child BMI to their age‐ and sex‐specific overweight cutoff is more strongly associated with adiposity than BMIz (Freedman et al., 2017), it is still an indirect measure of adiposity and has limitations similar to BMI and BMIz (Palmer et al., 2021). These results need to be replicated using more accurate measures of adiposity such as dual‐energy X‐ray absorptiometry (Adab et al., 2018). Similarly, while retrospectively reported exclusive breastfeeding duration was categorised by intervals (i.e., 0–3, 4–6, and >6 months) chosen based on Center for Disease Control and Prevention recommendations (Eidelman et al., 2012), future studies using a continuous measure of breastfeeding duration are needed. Additional work is also needed to clarify the role of other early feeding practices such as mixed breast‐ and formula feeding, breastfeeding via pumping versus direct feeding from breast, introduction of solid foods, and total length of breastfeeding (i.e., including periods of complementary feeding). Lastly, our study did not account for maternal factors that have been shown to affect the ability to breastfeed (i.e., gestational diabetes [Eidelman et al., 2012; Hummel et al., 2008] or the nutritional composition of breast milk and, maternal diet; Kent, 2007). Therefore, we acknowledge our study's generalisability is limited and requires replication in a more heterogeneous sample.
This study extended our understanding of the influence of breastfeeding on hippocampal structure by showing that longer exclusive breastfeeding duration was related to larger hippocampal grey matter volume, which in turn, was associated with lower weight status. Overall, this study highlights the potential influence of breastfeeding on hippocampal structure and sheds light on a possible novel mechanism through which breastfeeding's impact on grey matter volume may, in turn, influence risk for excess weight gain. However, future studies are needed to expand upon these findings by examining other brain structures that may be associated with exclusive breastfeeding and weight status while also accounting for a more diverse array of socioeconomic factors that could affect both cortical and subcortical grey matter volume. These findings are in line with clinical guidance, which continues to recommend at least 6 months of exclusive breastfeeding for optimal neural development in childhood.
CONFLICT OF INTERESTS
The authors declare that there are no conflict of interests.
AUTHOR CONTRIBUTIONS
Ryan C. Higgins and Alaina L. Pearce analyzed the data and wrote a paper. Alaina L. Pearce processed all data and had primary responsibility for the final content. Ryan C. Higgins and Jane C. Aruma conducted research (quality control). Kathleen L. Keller designed the original studies and wrote the paper. Shana Adise, Travis D. Masterson, Nicole Fearnbach, Wendy M. Stein, Laural K. English, and Bari Fuchs collected research (data collection).
Supporting information
Supporting information.
ACKNOWLEDGEMENTS
This study received funding from NIDDK F32 DK122669‐01, USDA 2011‐67001‐30117, The Pennsylvania State University's Social, Life, & Engineering Sciences Imaging Center 3T MRI Facility NIH grant UL1TR000127, Social Science Research Institute and the Clinical and Translational Science Institute at The Pennsylvania State University.
Higgins, R. C. , Keller, K. L. , Aruma, J. C. , Masterson, T. D. , Adise, S. , Fearnbach, N. , Stein, W. M. , English, L. K. , Fuchs, B. , & Pearce, A. L. (2022). Influence of exclusive breastfeeding on hippocampal structure, satiety responsiveness, and weight status. Maternal & Child Nutrition, 18, e13333. 10.1111/mcn.13333
DATA AVAILABILITY STATEMENT
All original data can be accessed on the Open Science Framework project (https://osf.io/s7mwp/) with a permanent digital identifier (10.17605/OSF. IO/S7MWP). All original data can be accessed on Open Science Framework project (https://urldefense.com/v3/__https://osf.io/s7mwp/__;!!N11eV2iwtfs!ul1ngo70ttoA-d56qgQ4wHzQuaZMXnR6pLbrs3wrl2nj7qnmn6K4YwcyZ8-HBmq6SDaSbHrWbEwL08BbXKF7bJ0$) with a permanent digital identifier (10.17605/OSF. IO/S7MWP). Data described in the manuscript, code book, and analytic code will be made publicly and freely available without restriction at (https://osf.io/s7mwp/).
REFERENCES
- Adab, P. , Pallan, M. , & Whincup, P. H. (2018). Is BMI the best measure of obesity?. British Medical Journal Publishing Group. [DOI] [PubMed] [Google Scholar]
- Adise, S. , Allgaier, N. , Laurent, J. , Hahn, S. , Chaarani, B. , Owens, M. , Yuan, D. , Nyugen, P. , Mackey, S. , Potter, A. , & Garavan, H. P. (2021). Multimodal brain predictors of current weight and weight gain in children enrolled in the ABCD study®. Developmental Cognitive Neuroscience, 49, 100948. [DOI] [PMC free article] [PubMed] [Google Scholar]
- Adise, S. , Geier, C. F. , Roberts, N. J. , White, C. N. , & Keller, K. L. (2018). Is brain response to food rewards related to overeating? A test of the reward surfeit model of overeating in children. Appetite, 128, 167–179. [DOI] [PMC free article] [PubMed] [Google Scholar]
- Adise, S. , Geier, C. F. , Roberts, N. J. , White, C. N. , & Keller, K. L. (2019). Food or money? Children's brains respond differently to rewards regardless of weight status. Pediatric Obesity, 14(2), e12469. [DOI] [PubMed] [Google Scholar]
- American Academy of Pediatrics . (2012). Breastfeeding and the use of human milk. Pediatrics, 129(3), e827–e841. 10.1542/peds.2011-3552 [DOI] [PubMed] [Google Scholar]
- Arenz, S. , Rückerl, R. , Koletzko, B. , & von Kries, R. (2004). Breast‐feeding and childhood obesity—a systematic review. International Journal of Obesity, 28(10), 1247–1256. [DOI] [PubMed] [Google Scholar]
- Bartok, C. J. , & Ventura, A. K. (2009). Mechanisms underlying the association between breastfeeding and obesity. International Journal of Pediatric Obesity, 4(4), 196–204. [DOI] [PubMed] [Google Scholar]
- Bauer, C. C. C. , Moreno, B. , González‐Santos, L. , Concha, L. , Barquera, S. , & Barrios, F. A. (2015). Child overweight and obesity are associated with reduced executive cognitive performance and brain alterations: A magnetic resonance imaging study in Mexican children. Pediatric Obesity, 10(3), 196–204. [DOI] [PubMed] [Google Scholar]
- Belfort, M. B. , Anderson, P. J. , Nowak, V. A. , Lee, K. J. , Molesworth, C. , Thompson, D. K. , Doyle, L. W. , & Inder, T. E. (2016). Breast milk feeding, brain development, and neurocognitive outcomes: A 7‐year longitudinal study in infants born at less than 30 weeks' gestation. The Journal of Pediatrics, 100(177), 133–139. [DOI] [PMC free article] [PubMed] [Google Scholar]
- United States Department of Agriculture . (2020). Birth to 24 month subcommittee. The duration, frequency, and volume of exclusive human milk and/or infant formula consumption and overweight and obesity: A systematic review. https://nesr.usda.gov/2020-dietary-guidelines-advisory-committee-systematic-reviews [PubMed]
- Blundell, J. , De Graaf, C. , Hulshof, T. , Jebb, S. , Livingstone, B. , Lluch, A. , Mela, D. , Salah, S. , Schuring, E. , van der Knaap, H. , & Westerterp, M. (2010). Appetite control: Methodological aspects of the evaluation of foods. Obesity Reviews, 11(3), 251–270. [DOI] [PMC free article] [PubMed] [Google Scholar]
- Bradley, R. H. , & Corwyn, R. F. (2002). Socioeconomic status and child development. Annual Review of Psychology, 53(1), 371–399. [DOI] [PubMed] [Google Scholar]
- Brosseau‐Liard, P. E. , & Savalei, V. (2014). Adjusting incremental fit indices for nonnormality. Multivariate Behavioral Research, 49(5), 460–470. [DOI] [PubMed] [Google Scholar]
- Brosseau‐Liard, P. E. , Savalei, V. , & Li, L. (2012). An investigation of the sample performance of two nonnormality corrections for RMSEA. Multivariate Behavioral Research, 47(6), 904–930. [DOI] [PubMed] [Google Scholar]
- Brown, A. , & Lee, M. (2012). Breastfeeding during the first year promotes satiety responsiveness in children aged 18–24 months. Pediatric Obesity, 7(5), 382–390. [DOI] [PubMed] [Google Scholar]
- Burgess, B. , & Faith, M. S. (2018). Satiety responsiveness and eating rate in childhood: Development, plasticity, and the family footprint. In Lumeng J. C., & Fisher J. O. (Eds.), Pediatric food preferences and eating behaviors (pp. 93–110). Elsevier. [Google Scholar]
- Butt, A. M. , Fern, R. F. , & Matute, C. (2014). Neurotransmitter signaling in white matter. Glia, 62(11), 1762–1779. [DOI] [PubMed] [Google Scholar]
- Carnell, S. , Haworth, C. M. , Plomin, R. , & Wardle, J. (2008). Genetic influence on appetite in children. International Journal of Obesity, 32(10), 1468–1473. [DOI] [PubMed] [Google Scholar]
- Carnell, S. , & Wardle, J. (2007). Measuring behavioural susceptibility to obesity: Validation of the child eating behaviour questionnaire. Appetite, 48(1), 104–113. [DOI] [PubMed] [Google Scholar]
- Carnell, S. , & Wardle, J. (2008). Appetitive traits and child obesity: Measurement, origins and implications for intervention: Symposium on ‘Behavioural nutrition and energy balance in the young.’. Proceedings of the Nutrition Society, 67(4), 343–355. [DOI] [PubMed] [Google Scholar]
- Chen, J. , Liu, J. , Calhoun, V. D. , Arias‐Vasquez, A. , Zwiers, M. P. , Gupta, C. N. , Franke, B. , & Turner, J. A. (2014). Exploration of scanning effects in multi‐site structural MRI studies. Journal of Neuroscience Methods, 230, 37–50. [DOI] [PMC free article] [PubMed] [Google Scholar]
- Clasen, M. M. , Riley, A. L. , & Davidson, T. L. (2020). Hippocampal‐dependent inhibitory learning and memory processes in the control of eating and drug taking. Current Pharmaceutical Design, 26, 2334–2352. [DOI] [PubMed] [Google Scholar]
- Das, U. N. (2001). Is obesity an inflammatory condition? Nutrition, 17(11–12), 953–966. [DOI] [PubMed] [Google Scholar]
- Deoni, S. , Dean, D., III , Joelson, S. , O'Regan, J. , & Schneider, N. (2018). Early nutrition influences developmental myelination and cognition in infants and young children. NeuroImage, 178, 649–659. [DOI] [PMC free article] [PubMed] [Google Scholar]
- Eidelman, A. I. , Schanler, R. J. , Johnston, M. , Landers, S. , Noble, L. , Szucs, K. , & Viehmann, L. (2012). Breastfeeding and the use of human milk. Pediatrics, 129(3), e827–e841. [DOI] [PubMed] [Google Scholar]
- English, L. K. , Fearnbach, S. N. , Wilson, S. J. , Fisher, J. O. , Savage, J. S. , Rolls, B. J. , & Keller, K. L. (2017). Food portion size and energy density evoke different patterns of brain activation in children. The American Journal of Clinical Nutrition, 105(2), 295–305. [DOI] [PMC free article] [PubMed] [Google Scholar]
- Fennema‐notestine, C. , Gamst, A. C. , Quinn, B. T. , Pacheco, J. , Jernigan, T. L. , Thal, L. , Buckner, R. , Killiany, R. , Blacker, D. , Dale, A. M. , Fischl, B. , Dickerson, B. , & Gollub, R. L. (2007). Feasibility of multi‐site clinical structural neuroimaging studies of aging using legacy data. Neuroinformatics, 5(4), 235–245. [DOI] [PubMed] [Google Scholar]
- Freedman, D. S. , Butte, N. F. , Taveras, E. M. , Lundeen, E. A. , Blanck, H. M. , Goodman, A. B. , & Ogden, C. L. (2017). BMI z‐scores are a poor indicator of adiposity among 2‐ to 19‐year‐olds with very high BMIs, NHANES 1999‐2000 to 2013‐2014. Obesity, 25(4), 739–746. [DOI] [PMC free article] [PubMed] [Google Scholar]
- Fryar, C. D. , Carroll, M. D. , & Ogden, C. L. (2018). Prevalence of overweight, obesity, and severe obesity among children and adolescents aged 2–19 years: United States, 1963–1965 through 2015–2016.
- Fu, Y. , Liu, X. , Zhou, B. , Jiang, A. C. , & Chai, L. (2016). An updated review of worldwide levels of docosahexaenoic and arachidonic acid in human breast milk by region. Public Health Nutrition, 19(15), 2675–2687. [DOI] [PMC free article] [PubMed] [Google Scholar]
- Hashimoto, T. , Takeuchi, H. , Taki, Y. , Yokota, S. , Hashizume, H. , Asano, K. , Asano, M. , Sassa, Y. , Nouchi, R. , & Kawashima, R. (2015). Increased posterior hippocampal volumes in children with lower increase in body mass index: A 3‐year longitudinal MRI study. Developmental Neuroscience, 37(2), 153–160. [DOI] [PubMed] [Google Scholar]
- Heinig, M. J. , Nommsen, L. A. , Peerson, J. M. , Lonnerdal, B. , & Dewey, K. G. (1993). Intake and growth of breast‐fed and formula‐fed infants in relation to the timing of introduction of complementary foods: The DARLING study. Acta Paediatrica, 82, 999–1006. [DOI] [PubMed] [Google Scholar]
- Higgs, S. , & Spetter, M. S. (2018). Cognitive control of eating: The role of memory in appetite and weight gain. Current Obesity Reports, 1(7), 50–59. [DOI] [PMC free article] [PubMed] [Google Scholar]
- Hooper, D. , Coughlan, J. , & Mullen, M. (2008). Evaluating model fit: A synthesis of the structural equation modelling literature. 7th European Conference on Research Methodology for Business and Management Studies, 195–200.
- Hummel, S. , Hummel, M. , Knopff, A. , Bonifacio, E. , & Ziegler, A. G. (2008). Breastfeeding in women with gestational diabetes. Deutsche Medizinische Wochenschrift (1946), 133(5), 180–184. [DOI] [PubMed] [Google Scholar]
- Iglói, K. , Doeller, C. F. , Berthoz, A. , Rondi‐Reig, L. , & Burgess, N. (2010). Lateralized human hippocampal activity predicts navigation based on sequence or place memory. Proceedings of the National Academy of Sciencesof the United States of America, 107(32), 14466–14471. [DOI] [PMC free article] [PubMed] [Google Scholar]
- World Health Organization . (2002). Young child nutrition. Global strategy on infantand young child feeding. Fifty‐Fifth World Health Assembly A, 55.
- Johnson, S. L. (2000). Improving preschoolers' self‐regulation of energy intake. Pediatrics, 106(6), 1429–1435. [DOI] [PubMed] [Google Scholar]
- Johnson, S. L. , & Birch, L. L. (1994). Parents' and children's adiposity and eating style. Pediatrics, 94(5), 653–661. [PubMed] [Google Scholar]
- Kanoski, S. E. , & Grill, H. J. (2017). Hippocampus contributions to food intake control: Mnemonic, neuroanatomical, and endocrine mechanisms. Biological Psychiatry, 81(9), 748–756. [DOI] [PMC free article] [PubMed] [Google Scholar]
- Keller, K. L. , English, L. K. , Fearnbach, S. N. , Lasschuijt, M. , Anderson, K. , Bermudez, M. , Fisher, J. O. , Rolls, B. J. , & Wilson, S. J. (2018). Brain response to food cues varying in portion size is associated with individual differences in the portion size effect in children. Appetite, 125, 139–151. [DOI] [PMC free article] [PubMed] [Google Scholar]
- Kent, J. (2007). How breastfeeding works. Journal of Midwifery and Women's Health, 52(6), 564–570. [DOI] [PubMed] [Google Scholar]
- Kuczmarski, R. J. , Ogden, C. L. , Guo, S. S. , Grummer‐Strawn, L. M. , Flegal, K. M. , Mei, Z. , & Johnson, C. L. (2002). 2000 CDC growth charts for the United States: Methods and development. Vital and Health Statistics, (246), 1–190. [PubMed] [Google Scholar]
- Lien, E. L. , Richard, C. , & Hoffman, D. R. (2018). DHA and ARA addition to infant formula: Current status and future research directions. Prostaglandins, Leukotrienes and Essential Fatty Acids, 128, 26–40. [DOI] [PubMed] [Google Scholar]
- Luby, J. L. , Belden, A. C. , Whalen, D. , Harms, M. P. , & Barch, D. M. (2016). Breastfeeding and childhood IQ: The mediating role of gray matter volume. Journal of the American Academy of Child & Adolescent Psychiatry, 55(5), 367–375. [DOI] [PMC free article] [PubMed] [Google Scholar]
- Lynch, K. M. , Page, K. A. , Shi, Y. , Xiang, A. H. , Toga, A. W. , & Clark, K. A. (2020). The effect of body mass index on hippocampal morphology and memory performance in late childhood and adolescence. Hippocampus, 31, 189–200. [DOI] [PMC free article] [PubMed] [Google Scholar]
- Martin, A. A. , Davidson, T. L. , & McCrory, M. A. (2018). Deficits in episodic memory are related to uncontrolled eating in a sample of healthy adults. Appetite, 124, 33–42. [DOI] [PMC free article] [PubMed] [Google Scholar]
- Masterson, T. D. , Bermudez, M. A. , Austen, M. , Lundquist, E. , Pearce, A. L. , Bruce, A. S. , & Keller, K. L. (2019). Food commercials do not affect energy intake in a laboratory meal but do alter brain responses to visual food cues in children. Appetite, 132, 154–165. [DOI] [PMC free article] [PubMed] [Google Scholar]
- Masterson, T. D. , Bobak, C. , Rapuano, K. M. , Shearrer, G. E. , & Gilbert‐Diamond, D. (2019). Association between regional brain volumes and BMI z‐score change over one year in children. PLoS One, 14(9), e0221995. [DOI] [PMC free article] [PubMed] [Google Scholar]
- Mestre, Z. , Bischoff‐Grethe, A. , Wierenga, C. E. , Jernigan, T. , Eichen, D. M. , Chang, L. , Ernst, T. , & Boutelle, K. N. (2020). Associations between body weight, hippocampal volume, and tissue signal intensity in 12‐ to 18‐year‐olds. Obesity, 28(7), 1325–1331. [DOI] [PMC free article] [PubMed] [Google Scholar]
- Mestre, Z. L. , Bischoff‐Grethe, A. , Eichen, D. M. , Wierenga, C. E. , Strong, D. , & Boutelle, K. N. (2017). Hippocampal atrophy and altered brain responses to pleasant tastes among obese compared with healthy weight children. International Journal of Obesity, 41(10), 1496–1502. [DOI] [PMC free article] [PubMed] [Google Scholar]
- Metzger, M. W. , & McDade, T. W. (2010). Breastfeeding as obesity prevention in the United States: A sibling difference model. American Journal of Human Biology, 22(3), 291–296. [DOI] [PubMed] [Google Scholar]
- Moreno‐Lopez, L. , Soriano‐Mas, C. , Delgado‐Rico, E. , Rio‐Valle, J. S. , & Verdejo‐Garcia, A. (2012). Brain structural correlates of reward sensitivity and impulsivity in adolescents with normal and excess weight. PLoS One, 7(11), e49185. [DOI] [PMC free article] [PubMed] [Google Scholar]
- Noble, K. G. , Houston, S. M. , Brito, N. H. , Bartsch, H. , Kan, E. , Kuperman, J. M. , Akshoomoff, N. , Amaral, D. G. , Bloss, C. S. , Libiger, O. , Schork, N. J. , Murray, S. S. , Casey, B. J. , Chang, L. , Ernst, T. M. , Frazier, J. A. , Gruen, J. R. , Kennedy, D. N. , Van Zijl, P. , … Sowell, E. R. (2015). Family income, parental education and brain structure in children and adolescents. Nature Neuroscience, 18(5), 773–778. [DOI] [PMC free article] [PubMed] [Google Scholar]
- Ou, X. , Andres, A. , Pivik, R. T. , Cleves, M. A. , Snow, J. H. , Ding, Z. , & Badger, T. M. (2016). Voxel‐based morphometry and fMRI revealed differences in brain gray matter in breastfed and milk formula–fed children. American Journal of Neuroradiology, 37(4), 713–719. [DOI] [PMC free article] [PubMed] [Google Scholar]
- Palmer, C. E. , Sheth, C. , Marshall, A. T. , Adise, S. , Baker, F. C. , Chang, L. , Clark, D. B. , Dagher, R. K. , Dowling, G. J. , Gonzalez, M. R. , Haist, F. , Herting, M. M. , Huber, R. S. , Jernigan, T. L. , LeBlanc, K. , Lee, K. , Lisdahl, K. M. , Neigh, G. , Patterson, M. W. , Renshaw, P. , Tapert, S. , Thompson, W. K. , Uban, K. , Sowell, E. R. , & Yurgelun‐Todd, D. (2021). A comprehensive overview of the physical health of the Adolescent Brain Cognitive Development Study (ABCD) cohort at baseline. BioRxiv. 9, 1–22. 10.1101/2021.06.30.450555 [DOI] [PMC free article] [PubMed] [Google Scholar]
- Pardoe, H. R. , Pell, G. S. , Abbott, D. F. , Berg, A. T. , & Jackson, G. D. (2008). Multi‐site voxel‐based morphometry: Methods and a feasibility demonstration with childhood absence epilepsy. [DOI] [PMC free article] [PubMed]
- Perlaki, G. , Molnar, D. , Smeets, P. , Ahrens, W. , Wolters, M. , Eiben, G. , Lissner, L. , Erhard, P. , Meer, F. V. , Herrmann, M. , Janszky, J. , Orsi, G. , & I.Family, C. (2018). Volumetric gray matter measures of amygdala and accumbens in childhood overweight/obesity. PLoS One, 13(10), 0205331. [DOI] [PMC free article] [PubMed] [Google Scholar]
- Reigh, N. A. , Rolls, B. J. , Savage, J. S. , Johnson, S. L. , & Keller, K. L. (2020). Development and preliminary testing of a technology‐enhanced intervention to improve energy intake regulation in children. Appetite, 155, 104830. [DOI] [PMC free article] [PubMed] [Google Scholar]
- Reyes, M. , Hoyos, V. , Martinez, S. M. , Lozoff, B. , Castillo, M. , Burrows, R. , Blanco, E. , & Gahagan, S. (2014). Satiety responsiveness and eating behavior among Chilean adolescents and the role of breastfeeding. International Journal of Obesity, 38(4), 552–557. [DOI] [PMC free article] [PubMed] [Google Scholar]
- Rosseel, Y. (2012). lavaan: An R package for structural equation modeling. Journal of Statistical Software, 48(2). 1–36. 10.18637/jss.v048.i02 [DOI] [Google Scholar]
- Satorra, A. , & Bentler, P. (1988). Scaling corrections for statistics in covariance structure analysis.
- Satorra, A. , & Bentler, P. M. (1994). Corrections to test statistics and standard errors in covariance structure analysis. [DOI] [PubMed]
- Singh, M. (2005). Essential fatty acids, DHA and human brain. The Indian Journal of Pediatrics, 72(3), 239–242. [PubMed] [Google Scholar]
- Stevenson, R. J. , & Francis, H. M. (2017). The hippocampus and the regulation of human food intake. Psychological Bulletin, 143(10), 1011–1032. [DOI] [PubMed] [Google Scholar]
- Takao, H. , Hayashi, N. , & Ohtomo, K. (2014). Effects of study design in multi‐scanner voxel‐based morphometry studies. NeuroImage, 84, 133–140. [DOI] [PubMed] [Google Scholar]
- Team R. C . (2012). R: A language and environment for statistical computing. Vienna, Austria. http://www.R-project.org
- Wardle, J. , Guthrie, C. A. , Sanderson, S. , & Rapoport, L. (2001). Development of the children's eating behaviour questionnaire. The Journal of Child Psychology and Psychiatry and Allied Disciplines, 42(7), 963–970. [DOI] [PubMed] [Google Scholar]
- Wilke, M. , Altaye, M. , Holland, S. K. , & Consortium, C. A. (2017). CerebroMatic: A versatile toolbox for spline‐based MRI template creation. Frontiers in Computational Neuroscience, 11, 5. [DOI] [PMC free article] [PubMed] [Google Scholar]
- Yoon, U. , Fonov, V. S. , Perusse, D. , Evans, A. C. , & Group, B. D. C. (2009). The effect of template choice on morphometric analysis of pediatric brain data. NeuroImage, 45(3), 769–777. [DOI] [PubMed] [Google Scholar]
Associated Data
This section collects any data citations, data availability statements, or supplementary materials included in this article.
Supplementary Materials
Supporting information.
Data Availability Statement
All original data can be accessed on the Open Science Framework project (https://osf.io/s7mwp/) with a permanent digital identifier (10.17605/OSF. IO/S7MWP). All original data can be accessed on Open Science Framework project (https://urldefense.com/v3/__https://osf.io/s7mwp/__;!!N11eV2iwtfs!ul1ngo70ttoA-d56qgQ4wHzQuaZMXnR6pLbrs3wrl2nj7qnmn6K4YwcyZ8-HBmq6SDaSbHrWbEwL08BbXKF7bJ0$) with a permanent digital identifier (10.17605/OSF. IO/S7MWP). Data described in the manuscript, code book, and analytic code will be made publicly and freely available without restriction at (https://osf.io/s7mwp/).