

Summary
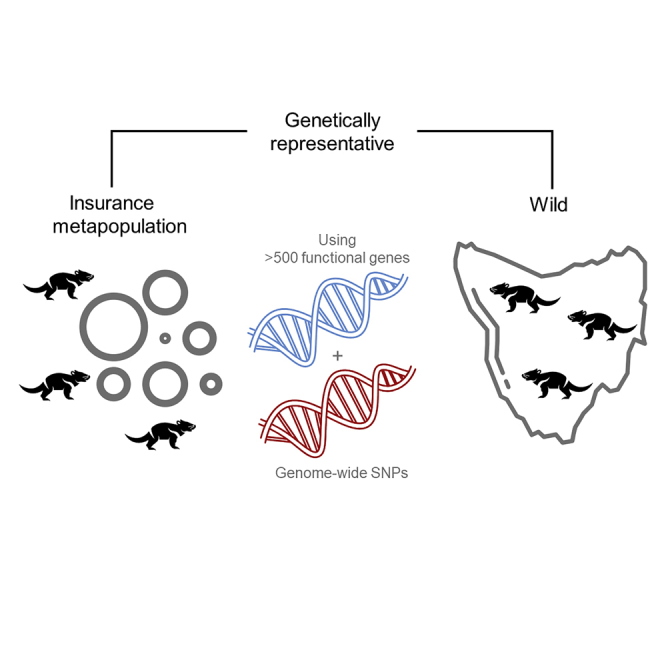
Conservation breeding programs aim to maintain 90% wild genetic diversity, but rarely assess functional diversity. Here, we compare both genome-wide and functional diversity (in over 500 genes) of Tasmanian devils (Sarcophilus harrisii) within the insurance metapopulation and across the species’ range (64,519 km2). Populations have declined by 80% since 1996 due to a contagious cancer, devil facial tumor disease (DFTD). However, predicted local extinctions have not occurred. Recent suggestions of selection for “resistance” alleles in the wild precipitated concerns that insurance population devils may be unsuitable for translocations. Using 830 wild samples collected at 31 locations between 2012 and 2021, and 553 insurance metapopulation devils, we show that the insurance metapopulation is representative of current wild genetic diversity. Allele frequencies at DFTD-associated loci were not substantially different between captive and wild devils. Methods presented here are valuable for others investigating evolutionary potential in threatened species, particularly ones under significant selective pressures.
Subject areas: Zoology, Animals, Genetics
Graphical abstract
Highlights
-
•
Developed target capture to assess functional diversity at over 500 genes
-
•
Fine-scale structure exists in the genetically depauperate Tasmanian devil
-
•
Insurance metapopulation is representative of wild genetic diversity
-
•
Allele frequencies at disease-associated loci were similar in captivity to the wild
Zoology; Animals; Genetics
Introduction
The International Union for the Conservation of Nature (IUCN) guidelines recommend translocation (IUCN/SSC, 2013) and ex situ management (i.e. captive breeding; McGowan et al., 2017; IUCN/SSC, 2014) to assist the conservation of species in the wild. The extinctions of 32 bird and 16 mammal species have been prevented using both approaches (Bolam et al., 2021). Yet if ex situ programs are unable to retain a species’ genetic diversity, they risk putting the species through a genetic bottleneck (Khalatbari et al., 2021). Retention of genetic diversity is critical to species’ population management and to maintain adaptive potential (Weeks et al., 2016). Recently, some conservation programs have assessed how genetically representative the captive breeding (insurance) population is of the wild (Christe et al., 2014). However, assessments have focused on neutral diversity and have rarely investigated functional diversity beyond a few genes of interest. Understanding functional genetic diversity is particularly important for species at risk from disease, for example, amphibians and chytrid fungus (Van Rooij et al., 2015), Tasmanian devils and devil facial tumor disease (DFTD; Pearse et al., 2012), and bats and white-nose syndrome (Russell et al., 2015). Such assessments allow for a greater understanding of genes involved in disease resistance and susceptibility. Loss of genetic diversity, particularly at immune genes, increases the susceptibility of populations to other disease events. Here, we interrogate the genetic diversity at both functional and neutral parts of the Tasmanian devil (Sarcophilus harrisii) genome in the disease-free insurance metapopulation animals and compare it with diversity found across the entire species’ range. Our aim is to determine if the insurance metapopulation devils are representative of current wild genetic diversity, given recent speculation that wild populations are becoming “resistant” to the disease.
Tasmanian devils are found only on the island state of Tasmania, Australia (Figure 1A). As a generalist carnivore, devils are known to inhabit a wide range of habitats from the intertidal zone to sub-alpine regions across the 64,519 km2 island (Pemberton, 2019; Cunningham et al., 2021). Population densities have significantly reduced since the emergence of an infectious clonal cancer, DFTD, in 1996 (Figure 1B; Cunningham et al., 2021; Lazenby et al., 2018). Over the past 25 years, DFTD has decimated local devil populations by 82%, with the disease now found across more than 90% of the species’ range (Cunningham et al., 2021). Since 2003, there has been significant investment into conserving this species including research into the disease (e.g. Loh et al., 2006; Pye et al., 2016; Murchison et al., 2012; Pearse and Swift, 2006) and devil genetics (e.g. Morris et al., 2015a; Siddle et al., 2013; Cheng et al., 2017), as well as the establishment of an insurance population in 2006 (Hogg et al., 2015, 2017; Jones and McCallum, 2007). This investment is a result of the initial epidemiological modeling in 2007 that predicted a disease-induced extinction of the species within 25–30 years (McCallum et al., 2007, 2009). The spread of DFTD is believed to have been exacerbated by the limited immune gene diversity observed in devils (Morris et al., 2013), as the species has experienced a number of historic genetic bottlenecks, including extinction from the Australian mainland ∼1,700–5,700 years ago (Brüniche-Olsen et al., 2014).
Figure 1.

Genetic diversity across the range of the Tasmanian devil
(A) Image of a DFTD-free Tasmanian devil.
(B) Image of DFTD-infected devil.
(C) Map of sampling locations, with size of points proportional to the number of samples sequenced. Scale bar represents kilometers and arrow indicates North.
(D) PCoA of genome-wide diversity with all wild devils sequenced using DArTseq (N = 1780 loci, 830 devils), with samples shaded by their location as per the sampling map.
(E) PCoA of functional diversity at immune and reproductive genes with all wild devils sequenced using the target capture approach (N = 260 loci, 105 devils).
(F) PCoA of functional diversity at DFTD-associated loci with all wild devils sequenced using the target capture approach (N = 53 loci, 105 devils).
(G) PCoA of genome-wide diversity with wild devils shown in gray (N = 830), the zoo-based insurance population (N = 299) in pale orange, and Maria Island (N = 254) in dark orange sequenced using DArTseq (N = 1819 loci). (H) PCoA of functional diversity at immune and reproductive genes with wild devils shown in gray (N = 105), the zoo-based insurance population (N = 28) in pale orange, and Maria Island (N = 25) in dark orange sequenced using the target capture approach. (I) PCoA of functional diversity at DFTD-associated loci with wild devils shown in gray (N = 105), the zoo-based insurance population (N = 28) in pale orange, and Maria Island (N = 25) in dark orange sequenced using the target capture approach.
The decline of devil populations due to disease provides a unique opportunity to determine whether differences in selective pressures between captive and wild populations can negatively impact on reintroduction programs. Recent studies have proposed that devils in the wild are adapting to the disease with strong selection for “resistance” alleles (Epstein et al., 2016; Margres et al., 2018a), although these DFTD-associated loci have not been functionally validated (Hohenlohe et al., 2019). Speculation that “resistance” alleles are not captured by the insurance metapopulation, given it was established from “naive” individuals that were not exposed to the disease (Hamede et al., 2021), challenges the validity of the insurance and recovery program. Arguments against the release of captive individuals to wild populations assume individuals from the metapopulation have a higher frequency of susceptible genotypes (Hohenlohe et al., 2019). However, none of the studies of “resistance” alleles, nor other associated opinion pieces, have ever investigated the presence/absence, or frequency, of “resistance” alleles in the insurance metapopulation.
The initial goal of the insurance metapopulation was to conserve 95% of wild genetic diversity for 50 years (CBSG/DPIPWE/ARAZPA, 2009). Initially it was established as a zoo-based insurance population (herein “IP”) with three founder intakes in 2005, 2008, and 2009 (N = 107 individuals) sourcing individuals from ahead of the disease front (Hogg et al., 2015). Since 2009, a concerted effort has been made to incorporate individuals from locations, not included in the initial intakes, that have been exposed to the disease (N = 80 individuals; Hogg et al., 2019). In 2012, devils from the IP were used to establish a disease-free population on Maria Island (Wise et al., 2019). Due to the small geographic size of Maria Island (∼115km2) and its current use as a source population for wild release trials, the island is regularly supplemented with individuals from the IP to maintain high levels of genetic diversity (Wise et al., 2019; Hogg et al., 2020). Management of the insurance metapopulation uses a combination of conventional pedigree-based management and contemporary molecular genetics (neutral and functional regions) to ensure that genetic diversity is maintained and maximized across the population (Farquharson et al., 2017; Hogg et al., 2017; McLennan et al., 2020). This design makes Tasmanian devils ideal to test whether insurance populations capture and maintain genetic diversity, particularly in the presence of a significant ongoing selective pressure in the wild, such as disease.
As the species has undergone significant population declines, both as a result of DFTD (Lazenby et al., 2018) and historical climate-related changes (Brüniche-Olsen et al., 2014), Tasmanian devils now exhibit low genome-wide and immune-gene diversity (Jones et al., 2004; Storfer et al., 2017; Miller et al., 2011; Morris et al., 2015a). Population genetic theory indicates that populations that have undergone significant declines are more likely to be exposed to small population pressures such as a further loss of genetic diversity and accumulation of inbreeding (Frankham, 2010). This in turn limits the species’ capacity to adapt to current and emerging threats and reduces the likelihood of population persistence (Allendorf et al., 2012). A similar scenario is feasible in all endangered species facing threatening processes. Therefore, here we investigate (1) the current genetic diversity of Tasmanian devils across their entire range; (2) whether the genetic diversity of the insurance metapopulation is representative of the species; and (3) if there is any evidence that the genetic diversity of the insurance metapopulation is significantly different from the wild. We comment on the limited differences in genetic diversity and how this provides support to the genetic suitability of the insurance metapopulation as a source population for translocations to disease-affected wild populations. We also comment on the relevance of these findings to other species conservation programs.
Results
Using methods that assess genome-wide diversity and diversity at over 500 functionally important immune and reproductive genes, in addition to the putative DFTD-associated loci, we show the insurance metapopulation is representative of wild devils, and concerns over “naivety” are unfounded.
Genome-wide diversity
Genome-wide single nucleotide polymorphisms (SNPs) were generated using DArTseq, a form of reduced representation sequencing, provided by Diversity Array Technologies Ltd Pty. Following bioinformatic quality filtering, 1,819 SNPs were retained for 1,383 samples (N = 830 wild; 299 IP; and 254 Maria Island). Principal coordinate analysis (PCoA) of 1,819 SNPs in the wild Tasmanian devil samples (31 locations) revealed fine-scale genetic structure across the state. Structuring patterns were consistent with the geographical position of each population, i.e., populations were differentiated on an east-west (axis 1) and north-south (axis 2) gradient (Figures 1C and 1D). Pairwise differentiation between populations (FST; Table S1 denotes pairwise FST values between populations with 95% confidence intervals and associated p values. Related to Figure 1G.) was significant, suggesting barriers to dispersal and gene flow across the state. Genetic differentiation was driven by an isolation by distance pattern (MANTEL: r = 0.34; p value = 0.001). A fastSTRUCTURE analysis (Raj et al., 2014) estimated six genetic clusters (Figure 2; Table 1). A second PCoA including the metapopulation animals from the IP (N = 299) and the introduced Maria Island (N = 254) population showed both were representative of range-wide genetic diversity (Figure 1G) and that these populations were a mix of the six wild clusters (Figure 2). As expected, both the IP and Maria Island animals clustered slightly more toward the western populations as a result of how the IP was established, collecting animals from the west coast, ahead of the disease front (see Introduction).
Figure 2.

Genetic clusters across the species’ range
fastSTRUCTURE plot showing the six different population clusters across the state as indicated by the map, in addition to the insurance population (IP) and Maria Island. The cluster assignment of each population is provided in Table 1; dotted lines are indicative of cluster boundaries.
Table 1.
Sample details and diversity statistics for genome-wide SNPs generated via DArTseq
| Location (primary fast STRUCTURE population assignment) | N | Sampling Years | HO (SE) | HE (SE) | HS (SE) | FIS (95% CI) | Ne (95% CI) | Harmonic mean N |
|---|---|---|---|---|---|---|---|---|
| Antill Ponds (3) | 2 | 2016–2019 | ||||||
| Bronte (3) | 39 | 2018–2020 | 0.173 (0.004) | 0.182 (0.004) | 1.002 (0.073) | 0.0531 (0.0166; 0.0949)∗ | 48.8 (28.2; 115.4) | 33.3 |
| Buckland (3) | 55 | 2015–2020 | 0.180 (0.004) | 0.184 (0.004) | 1.072 (0.034) | 0.0186 (−0.0071; 0.0474) | 64.8 (44.3; 109.0) | 50 |
| Cherry Tree Hill (3) | 1 | 2019 | ||||||
| Cockle Creek (3) | 1 | 2020 | ||||||
| Coles Bay (4) | 3 | 2018–2019 | ||||||
| Fentonbury (3) | 75 | 2018–2019 | 0.176 (0.004) | 0.181 (0.004) | 1.035 (0.036) | 0.0275 (0.0068; 0.0493)∗ | 55.1 (43.2; 73.0) | 63.7 |
| Fingal Valley (4) | 13 | 2012 | 0.182 (0.005) | 0.177 (0.004) | 1.084 (0.037) | −0.0241 (−0.0758; 0.0103) | 208 (85.4; ∞) | 12.1 |
| Forestier/Murdunna (4) | 24 | 2011–2012 | 0.159 (0.004) | 0.161 (0.004) | 0.928 (0.074) | 0.0114 (−0.0528; 0.0753) | 18.8 (11.6; 35.8) | 18.8 |
| Granville Harbor (1) | 80 | 2016–2019 | 0.158 (0.004) | 0.166 (0.004) | 0.936 (0.029) | 0.0476 (0.0224; 0.0724)∗ | 44.1 (35.6; 55.7) | 70.8 |
| Hobart Area (3) | 5 | 2014–2018 | ||||||
| IP | 299 | 2014–2021 | 0.172 (0.004) | 0.186 (0.004) | 0.999 (0.025) | 0.0747 (0.0612; 0.0892)∗ | 42.0 (26.8; 65.0) | 261.1 |
| Kempton/Brighton (3) | 38 | 2016–2019 | 0.181 (0.004) | 0.187 (0.004) | 1.081 (0.035) | 0.0278 (0.0039; 0.0500)∗ | 114.2 (73.8; 248.5) | 35.4 |
| Launceston (3) | 2 | 2019 | ||||||
| Lucaston (3) | 1 | 2018 | ||||||
| Lyell Highway (3) | 1 | 2020 | ||||||
| Maria Island | 254 | 2012–2021 | 0.164 (0.004) | 0.169 (0.004) | 0.974 (0.015) | 0.0321 (0.0211; 0.0436)∗ | 31.7 (28.5; 35.4) | 231.2 |
| Mayfield (3) | 1 | 2014 | ||||||
| Narawntapu (5) | 97 | 2014–2021 | 0.177 (0.004) | 0.181 (0.004) | 1.030 (0.035) | 0.0228 (0.0011; 0.0466)∗ | 32.3 (26.8; 39.5) | 81.9 |
| Robbins Island (1) | 20 | 2018 | 0.126 (0.004) | 0.128 (0.004) | 0.745 (0.040) | 0.0127 (−0.0261; 0.0488) | 29.8 (18.4; 62.4) | 18.1 |
| Rosebery/Zeehan (1) | 2 | 2015–2016 | ||||||
| Sandy Cape (1) | 2 | 2014 | ||||||
| Silver Plains (3) | 20 | 2020 | 0.169 (0.004) | 0.175 (0.004) | 1.004 (0.056) | 0.0369 (−0.0089; 0.0765) | 51.6 (26.3; 243.9) | 17.2 |
| South West (2) | 14 | 2017 | 0.133 (0.005) | 0.127 (0.004) | 0.779 (0.052) | −0.0479 (−0.1217; 0.0145) | 11.2 (5.6; 27.8) | 11.9 |
| Stanley (1) | 1 | 2020 | ||||||
| Stony Head (6) | 188 | 2014–2021 | 0.170 (0.004) | 0.173 (0.004) | 1.006 (0.013) | 0.0205 (0.0080; 0.0337)∗ | 31.8 (23.1; 43.7) | 172.1 |
| Strathgordon (3) | 9 | 2020 | 0.184 (0.005) | 0.169 (0.004) | 1.088 (0.047) | −0.0856 (−0.1755; −0.0364) | 12.1 (2.8; ∞) | 7.5 |
| Takone (1) | 4 | 2016 | ||||||
| Tasman Peninsula (4) | 22 | 2018–2019 | 0.155 (0.005) | 0.152 (0.004) | 0.913 (0.068) | −0.0182 (−0.0784; 0.0393) | 10.9 (6.3; 20.3) | 19.7 |
| Tomahawk (4) | 1 | 2018 | ||||||
| Woolnorth (1) | 24 | 2014–2019 | 0.140 (0.004) | 0.140 (0.004) | 0.832 (0.029) | −0.0010 (−0.0374; 0.0290) | 89.9 (55.1; 225.1) | 22.6 |
| wukalina (4) | 82 | 2017–2020 | 0.161 (0.004) | 0.175 (0.004) | 0.937 (0.042) | 0.0811 (0.0527; 0.1115)∗ | 41.8 (33.0; 54.3) | 65.7 |
| Macquarie Headsa (2) | 3 | 2008 |
N refers to sample size; HO, observed heterozygosity; SE, standard error; HE, expected heterozygosity; HS, standardized heterozygosity; FIS, inbreeding coefficient; 95% CI represent the lower and upper 95% confidence intervals; Ne, effective population size; and the harmonic mean N is the weighted sample size used in the calculation of Ne, adjusted for missing data. ∗denotes statistical significance at α = 0.05 based on bootstrapped 95% CI not including zero.
Samples collected as part of the founder intake for the Insurance population during 2008. These samples were included to understand how devils were moving into South Western Tasmania.
On average, observed heterozygosity (HO) was lower than expected heterozygosity (HE); standardized heterozygosity (HS) was reasonably consistent across the populations (Table 1; Figure 3A). However, Robbins Island, Woolnorth, Granville Harbor, and the south-west population (all western populations; Figure 1C) had consistently lower HS than other populations (Figure 3A). By comparison, the more central populations (Figures 1C, 2, and 3A) had the highest HS in the wild. The IP and Maria Island had similar HS values to the central populations (Figure 3A). There was no consistent pattern in inbreeding (FIS) across the state (Figure 3C), although there were nine locations that displayed an average FIS significantly greater than zero (indicated with an “∗” in Figure 3C). Effective population size (Ne) estimates ranged from 10.9 to 208 (Table 1).
Figure 3.

Genetic diversity at each sampling location
Locations are ordered from west to east with the insurance population (IP) and Maria Island at the far right. Locations are shaded as per Figure 1C. (A) Standardized heterozygosity (HS) measured by 1819 genome-wide SNPs; error bars represent standard errors. (B) Standardized heterozygosity measured by 260 immune and reproductive SNPs sequenced using the target capture approach; error bars represent standard errors. (C) Inbreeding (FIS) measured by 1819 genome-wide SNPs. Statistically significant inbreeding estimates are indicated by ∗ and determined as the 95% CI (error bars) obtained by bootstrapping excluding zero.
Functional diversity
A custom target capture approach was used to obtain functional SNP data at over 500 previously characterized genes. These included immune genes and reproductive genes linked to fitness (immunological fitness [Morris et al., 2015b; Siddle et al., 2007], reproductive fitness [Brandies et al., 2021], and fitness in relation to evolutionary response to DFTD); in addition to loci associated with DFTD through either pre- and post-DFTD arrival comparisons (Epstein et al., 2016); case-control analyses of DFTD infection, age at infection, and survival post-infection (Margres et al., 2018a); a case-control analysis of tumor regression (Margres et al., 2018b); or a GWAS of devils that either succumbed to DFTD infection or experienced tumor regression (Wright et al., 2017). We note that there is complex nuance in the distinction of “neutral” and “adaptive” diversity; in this study we did not investigate whether the variants we detected have functional effects or are functionally neutral (e.g. synonymous variants in genic regions).
The target capture was performed for N = 158 samples across the species' range (Table S2). After bioinformatic filtering, 313 SNPs were retained. These included 141 immune-related SNPs (of which 138 could be categorized into immune gene families), 119 SNPs in reproductive genes, and 53 putatively DFTD-associated loci. The number of SNPs within genes, exons, and coding regions is presented in Table S3, and further information of SNP filtering is provided in the Methods.
Patterns in functional diversity at immune and reproductive loci were similar to those in genome-wide diversity and were reflective of broad-scale geographic patterns (Figure 1E). As per the genome-wide data, axis 1 appeared to explain east-west variation, whereas variation in axis 2 appeared to be driven by north-south variation. The IP and Maria Island samples were representative of wild functional diversity even though they showed a closer association with western than eastern samples (Figure 1H). At the DFTD-associated loci, population structure was less defined (Figure 1F). Interestingly, the IP and Maria Island populations reflected similar patterns in the DFTD-associated loci to the wild locations (Figure 1I) even though these populations are not currently exposed to the selective pressures of DFTD.
At the immune and reproductive loci, HO was higher than HE (Table S2). HS was similar across the locations, with the IP and Maria Island showing some of the highest HS values across functional SNPs (Figure 3B). The pattern of lower HS in western than eastern populations observed in the genome-wide data (Figure 3A) was not evident in the functional data, except for the south-west population, which had one of the lowest HS values observed at the functional loci, noting it also had a small sample size (Table S2).
An assessment of the gene families showed that at reproductive genes, east-west population structure was observed in both males and females, and the IP and Maria Island populations were reflective of wild diversity (Figure S1). Reproductive genes driving variation included those associated with sperm function (e.g. CATSPER1, KIT, and SPAG8) and those with additional tumour-regulation or autoimmune functions (AIRE, ADAMTS9, B4GALT1 and PTCH2) (Table S4). Genes driving variation were similar between males and females (Table S4).
At immune genes, the IP and Maria Island populations were reflective of wild diversity (Figures S2–S9). When broken down into immune gene families, no SNPs meeting our filtering criteria were identified in the MHC or T cell receptor genes (Table S3). However, for cytokine genes, haplotype frequencies appeared to reflect geographic patterns with clustering of western (with the exception of south-west) and eastern (with the exception of Narawntapu) locations (Figure 4A). The IP and Maria Island populations clustered with the “western” cluster (Figure 4A). Population structure was less defined to nonexistent at the complement, Toll-like receptor (TLR), and cluster of differentiation genes (Figures 4B–4D). Distinct haplotype frequencies were observed for the south-west samples at both the complement and TLR genes (Figures 4B and 4C). Haplotype frequencies of immune gene families with <5 haplotypes (antimicrobial peptides, immunoglobulins, and natural killer cell receptors) are presented in Figures S7–S9. Overall, there was limited population structuring and no observed independent clustering of the IP and Maria Island based on haplotype frequencies at immune genes, providing confidence that these two populations are representative of the wild populations at these gene families.
Figure 4.

Functional diversity at four immune gene families
Each column represents a sampling location, with top row shaded as per Figure 1C. Each row represents a haplotype. Haplotypes are shaded and ordered by their frequencies (darker blue = more frequent). The dendrogram groups sampling locations by similarity. A full-sized heatmap with haplotype names is provided in Figures S3–S6.
Among 108 genes that contained SNPs within the coding regions, 19 had more than two sequence variants, with the number of sequence variants per gene ranging between three and five. Selection tests performed on these genes suggested that one gene, CAMP, which encodes the Saha-Cath3 cathelicidin, an antimicrobial peptide, contained one amino acid site (codon 121) with weak evidence of negative selection (p = 0.089). Gene TNFRSF25 (tumor necrosis factor receptor superfamily member 25) was found to contain one site (codon 107) with weak evidence of positive selection (p = 0.091).
Of the 53 DFTD-associated loci retained after probe design and SNP filtering, 44 of these were directly targeted; the remaining nine were in close proximity to a targeted locus. Of the 44 targeted SNPs, 23 were derived from Margres et al. (2018b), 19 from Margres et al. (2018a), two loci identified by Wright et al. (2017), and none retained from the Epstein et al. (2016) longitudinal study (Table S5). At these 53 putative DFTD-associated loci, we observed low differentiation between the insurance metapopulation and the wild (Table S6). An FST outlier analysis based on allele frequency differences failed to identify any outlier loci between the insurance metapopulation and the most disease-affected wild populations (cluster 3, 4; see Table 1 for assignment of sampling locations to clusters) when all pairwise comparisons were considered. Considering a subset of pairwise comparisons between populations of interest (the IP, Maria Island, cluster 3, and cluster 4), we identified two outlier loci between Maria Island and cluster 3 (originally identified through GWAS of devils that regressed tumors or succumbed to DFTD; Wright et al., 2017) and one outlier locus between the IP and cluster 4 (originally identified through a case-control analysis of tumor regression; Margres et al., 2018b). The two Maria-cluster 3 outliers were 123kb and 157kb away from the nearest gene, LOC116422520, which has an unknown function. The IP-cluster 4 outlier was 104kb away from the ACVR2B gene, which encodes activin receptor IIb. Inhibition of activin receptor IIb has been associated with the reversal of muscle and bone density loss and prolonged survival in mice with adenocarcinoma (Zhou et al., 2010). Examination of the frequency of the most common allele in the wild demonstrated that the common allele is present (albeit at lower frequency) in the Maria Island and IP at all outlier loci (Figure 5).
Figure 5.

Frequency of common wild allele at DFTD-associated loci
Heatmap of the frequency of the most common wild allele at the 53 DFTD-associated loci for the wild clusters; insurance population (IP) and Maria Island. Each column represents a cluster (sampling locations designated from results of fastSTRUCTURE analysis, see Table 1 for cluster assignments). Each row represents a DFTD-associated locus (labeled by genomic position). The dendrogram groups clusters by similarities in the frequencies of the common allele. Loci are shaded by the frequency of the most common wild allele (darker purple = more frequent) at each cluster. The genomic positions of outlier SNPs identified from the FST analysis are bolded.
Discussion
Here we provide a comprehensive survey of both neutral and functional genetic diversity across an entire species’ range and compare it with the insurance metapopulation. We applied both a reduced representation sequencing method to generate 1,819 genome-wide SNPs from 1,383 Tasmanian devils and a custom target capture method to examine functional diversity at 556 genes and 53 putative DFTD-associated loci. Previous studies of Tasmanian devils have investigated population structure at various locations using between 10 and 42 microsatellite markers (Storfer et al., 2017; Brüniche-Olsen et al., 2013, 2014; McLennan et al., 2018; Grueber et al., 2018; Lachish et al., 2011; Jones et al., 2004; Gooley et al., 2020), using SNPs from 7 locations (Fraik et al., 2020), or using SNPs at 38 locations but with only 1–2 samples per site (Hendricks et al., 2017). We found previously unreported evidence of fine-scale genetic structuring (Miller et al., 2011), reflective of biogeographic patterns (Figures 1C and 1D). Evidence of isolation-by-distance (demonstrated by the Mantel test) and low effective population sizes across the sampling locations (Table 1) suggest that patterns in genome-wide diversity are likely to be driven by drift. Genetic drift may be exacerbated by landscape fragmentation and small population densities due to DFTD and other threatening processes. Population structure was also evident using the functional dataset, though at a lower resolution (Figure 1E), which was expected, as functional loci are likely to be under different selective pressures such as balancing selection (Schierup et al., 2000). Recent literature has questioned the focus on putatively neutral data in conservation management given that functional diversity is directly linked to adaptive potential (Teixeira and Huber, 2021). Here, we have shown that functional diversity across many genes do indeed reflect observed patterns in genome-wide diversity (Figures 1D and 1E).
An aim of this study was to examine if the genetic diversity of the insurance metapopulation was substantially different from the wild. Limited or no differences in genetic structure provide support to the genetic suitability of the insurance metapopulation as a source population for translocations to disease-affected wild populations. The current insurance metapopulation effectively represents wild genetic diversity, at genome-wide SNPs (Figure 1G), functional SNPs (Figure 1H), and DFTD-associated loci (Figure 1I). Both the IP and Maria Island have high HS compared with the wild at both genome-wide and functional SNPs. However, these populations do exhibit evidence of inbreeding, which may be explained in part by sampling of related individuals but could also be impacted by unequal reproductive success and population sub-structuring (Tables 1 and S2; Figure 3; O'Connell et al., 2019; Fan et al., 2019; Jamieson, 2011). Haplotype frequencies at the immune genes are similar across the IP, Maria Island, and the wild as evidenced by neither location clustering independently of the wild sites (Figures 4 and S3–S9). The insurance metapopulation is a mix of western and eastern populations, but the north-eastern and south-western wild diversity is not well represented (Figures 1G, 1H, and 2). A western bias in the IP has previously been reported (Hogg et al., 2015) and reflects the establishment history of the insurance metapopulation.
The east-to-west cline in population structure has previously been identified in the Tasmanian devil, based on 38 locations and 72 samples (Hendricks et al., 2017). Through intensive sampling efforts, a citizen science program to collect samples from roadkill devils, and a crowdfunding campaign to send a trapping team into the previously unsampled south-western Tasmania, our study was able to increase the sample size more than 10-fold (N = 830 wild individuals) over previous surveys (Hendricks et al., 2017). Our large sample size, including previously unsampled populations, revealed population structure at a finer scale than previously recognized for this species (two clusters previously [Hendricks et al., 2017] versus six clusters here; Figure 2). Importantly, the inclusion of samples from south-western Tasmania allowed us to identify a north-to-south cline as well as east-to-west differentiation (Figure 2). Devils from south-western Tasmania represent different genetic diversity (neutral and functional) than the rest of Tasmania (Figures 2, 4, and S3–S9). This differentiation is similar to the recently reported differences in the major histocompatibility complex (MHC) Class I genes for this species (Cheng et al., 2021) and is likely driven by geographic isolation during the Pleistocene glaciation in Tasmania (Lewis, 1944). Three individuals that were sourced from Macquarie Heads (depicted as black dots in Figures 1C and 1D) during the original founder intakes for the IP in 2008 were included in the analysis here. These individuals cluster with the south-west individuals both in the PCoA and fastSTRUCTURE analysis. It is through the successful breeding of these individuals (Hogg et al., 2015) that some of the south-western diversity has been captured in the contemporary insurance metapopulation (Figures 1G and 2). If further genetic representation of this region is required, future sampling and founder collection should focus on the Macquarie Heads region due to its operational accessibility. In addition, the north-eastern populations (Figure 2) are less well represented in the insurance metapopulation and could also be a focus for future founder collection via the orphan program.
Although DFTD is a significant threatening process for Tasmanian devils, other threatening processes exist including significantly reduced population densities (Lazenby et al., 2018), evidence of inbreeding (Grueber et al., 2018), evidence of inbreeding depression (Gooley et al., 2020), roadkill (Lawrence and Weirsma, 2019), and a fragmented landscape. Translocations are a recognized conservation tool to minimize the risk of extinction from small population pressures and improve gene flow (Frankham et al., 2017). For Tasmanian devils, wild-to-wild translocations are currently not considered due to concerns that within-host competition between sub-lineages of DFTD may influence the evolutionary dynamics of the disease (Kwon et al., 2020). However, insurance metapopulation individuals are a potential source for translocations given their admixed heritage, disease-free status, and ongoing genetic management (Hogg et al., 2020; McLennan et al., 2020). A major concern with insurance populations is that they are not exposed to the same evolutionary pressures as their wild counterparts and so will be maladapted for release to the wild (Frankham, 2008). Releases of IP Tasmanian devils to disease free Maria Island in 2012 and 2013 (Wise et al., 2019) showed that captive devils survived and established home-ranges (Thalmann et al., 2016), foraged well (Rogers et al., 2016), bred and contributed genetically to the next generation (McLennan et al., 2020), and had increased fecundity comparable to wild populations (Hogg et al., 2019). What is currently unknown is how insurance metapopulation individuals would fare upon release to DFTD-affected locations. Here we found similar diversity patterns at the putative DFTD-associated loci in both the insurance metapopulation and the wild locations, giving little indication that translocated insurance metapopulation individuals will be any more susceptible to DFTD than wild animals (Figures 1F, 1G, and 5, Table S6). Trial releases of insurance metapopulation devils to DFTD-affected populations commenced in 2015 (Fox and Seddon, 2019). These trial releases will allow us to determine whether there are any significant changes in allele frequencies and associated fitness consequences at the entire suite of loci used in this study.
Only three outlier DFTD-associated loci, associated with two genes, were identified between Maria Island or the IP and the disease-affected wild cluster 3 or 4. Of note, all three loci were identified by either GWAS (Wright et al., 2017) or FST outlier analysis (Margres et al., 2018b) with a direct association with DFTD tumor regression phenotype. Future work should focus on characterizing the unknown function of the LOC116422520 gene, establishing possible mechanisms of DFTD-resistance in this gene, and investigating if the ACVR2B gene has similar functions in preventing cachexia (muscle wasting) in devils as identified in model organisms (Zhou et al., 2010). Nonetheless, allele frequencies at the majority of DFTD-associated loci were not substantially different in the IP to the disease-affected populations. Where DFTD-associated allele frequency differences occurred, the most common wild allele was always present in the IP and Maria populations (Figure 5), providing opportunity for selection if indeed DFTD is driving selection at these loci. One explanation for the similar allele frequencies observed at the DFTD-associated loci is that the insurance metapopulation is not frozen in time, but rather has captured wild diversity and continued to evolve since its initial founding; this has likely been achieved through strategic management of the population and the incorporation of orphan joeys from wild locations that are exposed to DFTD (Hogg et al., 2017, 2019). Insurance programs for other species that are considered frozen in time because they are unable to source additional founders from the wild, or unable to use assisted reproductive technologies to introduce historic genetic material to the captive population (e.g. the black-footed ferret; Howard et al., 2016), would still be able to use the methods described here. Programs could monitor changes in adaptive variation over time to minimize genetic adaptation to captivity (Frankham, 2008), ensuring populations remain suitable for eventual release to the wild.
Although the DFTD-associated loci used in this study have been associated with DFTD resistance (Margres et al., 2018a, 2018b; Wright et al., 2017; Epstein et al., 2016), these loci have not been functionally validated (Hohenlohe et al., 2019). The loci were identified through various approaches (Table S5), each with underlying assumptions, for example that devils trapped aged ≥2.2 years without infection never later succumbed to DFTD (Margres et al., 2018a). A second possibility for the similar allele frequencies between the insurance metapopulation and the wild is that the loci presumed to be associated with DFTD may in fact be under different (unidentified) selective pressures. If some of these loci are resistance loci, basic quantitative genetics theory suggests that we should expect rapid selection of DTFD-resistance alleles (i.e. if selection is strong and heritability is very high) and that this would make the insurance metapopulation individuals unsuitable for release due to their naivety (Hamede et al., 2021). We do not see evidence to support this statement.
The importance of understanding functional diversity in efforts to conserve biodiversity is increasingly recognized (Teixeira and Huber, 2021), including in captive management (Fernandez-Fournier et al., 2021). However, investigations of functional diversity have typically focused on a single gene family such as the MHC or Toll-like receptors (TLR; Fleischer et al., 2020; Hartmann et al., 2014; Wright et al., 2014). The 500+ genes included in our target capture encompass a large number of fitness-related regions of the genome but only whole genome sequencing linked to extensive phenotypic data would allow a more thorough investigation. Our custom target capture approach still allowed us to examine “functional” diversity at a much greater scale than previously achieved and could be adapted to other species to characterize functional diversity with relative ease. The applicability of our approach is dependent on a well-annotated reference genome. Global efforts to produce genomic resources, such as the Earth BioGenome Project (Lewin et al., 2018), will increase the accessibility of target capture methods in other species, noting that complex gene families, such as the immune genes, generally require manual annotation (Morris et al., 2015b; Johnson et al., 2018).
One argument for the importance of functional diversity is that traditional genome-wide or neutral approaches may not capture adaptive diversity of importance (Teixeira and Huber, 2021). Here our genome-wide evaluation appeared to reflect diversity at functional regions. Our findings do not suggest a need to change current genome-wide genetic management strategies. Beyond a broad assessment of genetic diversity, our functional approach was also useful in revealing diversity at immune gene families that had not previously been identified. For example, previous characterization of TLRs in Tasmanian devils found limited diversity, with no diversity at TLR4, 5, 7, 8, 9, 10, and 13; one SNP at TLR2 and TLR1-6-like; and 5 SNPs at TLR3, one of which was nonsynonymous (Cui et al., 2015). TLRs are a key component of the innate immune system and a target of DFTD-vaccine development to boost immune response (Patchett et al., 2017). Here, we expanded the sampling range and found two haplotypes at TLR9 and three at TLR6 (Figure S6), demonstrating the benefits of the target capture approach in exploring diversity at genes of interest.
The functional target capture approach also revealed areas for future investigation. Multiple reproductive genes found to be driving variation between samples were involved in sperm function (Table S4; Figure S1). Breeding success varies across the range (Farquharson et al., 2018; Guiler, 1970), with DFTD-affected populations experiencing precocial breeding (Jones et al., 2008; Lachish et al., 2009). Previous studies have noted reductions in reproductive success at Woolnorth, a western DFTD-free population included in this study and impacted by inbreeding depression (Farquharson et al., 2018; Gooley et al., 2020). Reproductive genes of interest identified through our method are a useful starting point for investigating reproductive failure and variation in reproductive patterns across the range. We note that some reproductive genes driving variation also have possible autoimmune or tumor suppressor functions (Table S4), so future investigations should be cognisant of challenges in experimentally disentangling reproductive variation from disease effects.
The Tasmanian devil insurance metapopulation provided an excellent opportunity to investigate whether an appropriately managed insurance population is reflective of neutral and functional genetic diversity in the wild. We showed that the strategy of incorporating molecular genetics into conventional pedigree management, and regular founder intakes of one to two orphans per year (Hogg et al., 2017, 2019), is sufficient to ensure that the IP and any translocated populations (i.e., Maria Island) remain representative of wild genetic diversity, including any alleles putatively associated with DFTD resistance (Epstein et al., 2016; Margres et al., 2018a). Similar allelic frequencies in the wild population clusters, which have had long-term exposure to DFTD (Figure 5; clusters 3, 4, 5, 6), and the insurance metapopulation, which has had very limited exposure to DFTD, questions the validity of claims of rapid evolution as a response to this transmissible cancer (Epstein et al., 2016). The DFTD naive argument for the insurance metapopulation (Hamede et al., 2021) appears to be unfounded, as the DFTD-associated loci are present at similar allele frequencies in the IP and the wild. Due to the high heterozygosity observed in the insurance metapopulation and its overall representation of species’ genetic diversity, sourcing devils from these populations for translocations may alleviate the impacts of inbreeding (Gooley et al., 2020), introduce new alleles, and assist with gene flow (Allendorf et al., 2012). For species whose threatening process cannot be successfully mitigated in the wild, understanding whether insurance populations are representative of wild diversity is essential to long-term management. The methods presented here form an excellent benchmark for any program looking to measure the genetic diversity differences between captive and wild populations and inform conservation actions to prevent the extinction of a species.
Limitations of the study
Basic selection theory suggests that releasing individuals not exposed to genetic changes as a result of DFTD in the wild is likely to decrease the fitness of the wild populations. However, this relies on two assumptions that (1) the DFTD-associated loci confer DFTD resistance, which is untested at this time, and (2) resistance alleles operate across all populations and that the insurance metapopulation has a different frequency of resistance alleles, which we do not see strong evidence of in our data. It is possible that increasing the sample size and number of SNPs compared could increase power to detect any changes. The work presented here does not in itself provide evidence of fitness benefits in the wild if insurance metapopulation devils are released. To assess this, long-term monitoring (2–3 generations, i.e. 4–6 years postrelease) is required to investigate the fitness consequences of translocations that use insurance metapopulation individuals. This work is currently underway.
STAR★Methods
Key resources table
Resource availability
Lead contact
Further information and requests for resources and data should be directed to and will be fulfilled by the lead contact, Dr Carolyn Hogg (carolyn.hogg@sydney.edu.au).
Materials availability
Probe sequences designed for the target capture method developed in this study are available as FASTA sequences in Supplementary Data 1.
Experimental model and subject details
All ear biopsies (N = 1,383) were collected by STDP staff under the STDP’s Standard Operating Procedure: Trapping and Handling Wild Tasmanian Devils under the ethics permits, 2014/681, 2014/550, and 2019/1562 which covered both wild and IP animals. Tasmanian devil ear biopsy samples used in this study were sourced widely across the island state of Tasmania (64,519 km2; Figure 1C). Firstly, devils from eight locations (Bronte, Buckland, Fentonbury, Granville Harbor, Kempton/Brighton, Narawntapu, Woolnorth and wukalina/Mt William) across Tasmania were sampled during annual monitoring trips run by the Save the Tasmanian Devil Program (STDP) as part of their ongoing efforts to monitor health and disease status. Seven additional locations (Forestier Peninsula/Murdunna, Tasman Peninsula, Fingal Valley, Robbins Island, Sandy Cape, Stony Head and Takone) were sampled by the STDP as part of other projects. A further four locations (south-west Tasmania, Silver Plains, Strathgordon and Lyell Highway) were specifically selected for sampling for this project and others based on their geographic distance from other sampling locations, including the remote and largely inaccessible south-west Tasmania that was sampled as part of a public crowdfunding effort to discover whether devils inhabited there (Cheng et al., 2021). Samples from the insurance population (IP) founder intake from Macquarie Heads (2008) were also included to assess how devils may be moving from north-western to south-western Tasmania. Zoo-based IP devils (N = 299) were sampled as part of routine management (Hogg et al., 2019). Samples were selected for study from these sites on the basis of availability and recency (2014–2021). Maria Island devils (N = 254) were sampled during the twice-yearly monitoring trips (McLennan et al., 2020). For sites that have been supplemented with released devils, parentage information was used to ensure only incumbent devils reflective of local diversity, rather than offspring that were the product of released devils, were selected.
In addition to major sampling sites, we selected 29 samples at 11 locations (Antill Ponds, Cherry Tree Hill, Cockle Creek, Coles Bay, Hobart Area, Launceston, Lucaston, Mayfield. Rosebery/Zeehan and Tomahawk) collected through the citizen-science STDP Roadkill Project. Members of the public were encouraged to report devil roadkill through a dedicated hotline or through the “Roadkill TAS app” (Lawrence and Weirsma, 2019). If possible, the roadkill was located, and ear tissue samples were collected by a member of the STDP into 70% ethanol. All samples were collected between 2014 and 2020. A total of 33 locations were included in this study (N = 31 wild, IP and Maria Island). Information including sample size and collection dates are reported in Tables 1 and S2.
Method details
DNA extraction
DNA was extracted using either a modified phenol-chloroform protocol (Sambrook and Russell, 2006), or the MagAttract HMW DNA kit (Qiagen, Germany; cat: 67563). DNA concentration and quality were assessed using a Nanodrop 2000 Spectrophotometer (ThermoFisher Scientific) and 0.8% agarose gel electrophoresis for 30 minutes at 90V. For further details on sample preparation and quality assessment see McLennan et al. (2019).
Genome-wide SNPs
All samples (N = 1,383) were sequenced using DArTseq, a reduced representation sequencing method, at Diversity Arrays Technology Ltd, Canberra (Sansaloni et al., 2010). Briefly, the PstI-HpaII enzyme combination was used to fragment DNA into 77–83 bp reads, which were sequenced on a HiSeq 2000 as single-end reads. Reduced representation sequencing methods reduce genome complexity by targeting non-repetitive regions of the genome, and have been demonstrated to reflect genome-wide diversity when compared to whole genome resequencing data (Wright et al., 2020). Variants identified are typically located in non-coding regions of the genome and are predominantly neutral (Al-Breiki et al., 2018).
Single nucleotide polymorphisms were called and filtered following Wright et al., (2019). Briefly, raw FASTQ files were processed to remove barcodes and discard reads with low quality scores using ‘process_radtags’ in Stacks v2.53 (Catchen et al., 2011, 2013). Reads were aligned to the Tasmanian devil reference genome (RefSeq mSarHar1.11, GCF_902635505.1) using BWA v0.7.17 (Li and Durbin, 2009) ‘aln’ algorithm with -B 5 to trim the first five base pairs and remove adapter contamination, before converting to SAM format using ‘samse’. SAMtools v1.7 (Li et al., 2009) was used to convert and index BAM files. Stacks ‘gstacks’ was then used to build a catalogue of variants across 2,986 Tasmanian devils, including samples sequenced as part of other projects. The ‘populations’ module of Stacks was used to filter variants with a minimum call rate of 30% (-r 0.3), a maximum observed heterozygosity of 70% (--max-obs-het 0.7), a minimum minor allele frequency of 0.001 (--min-maf 0.001) and --write-random-snp to randomly select only one SNP per read, resulting in 24,188 SNPs. Variants were further filtered in R v4.1.1 (R Core Team, 2020) with average allelic depth >2.5×, coverage difference between the reference and alternate allele ≤80%, reproducibility between technical replicate sequences ≥90%, a call rate ≥80%, maximum heterozygosity ≥70%, and a minor allele frequency of 0.001 for the sample set used in this study (Wright et al., 2019). Putatively sex-linked loci were identified as variants heterozygous in at least one female but no males and were removed from analysis. Prior to reproducibility filtering, genotyping error rate was 4.10%. After filtering, 1,819 SNPs were retained for analysis across 1,383 Tasmanian devils.
To assess whether the roadkill samples were of comparable quality to ear biopsy samples collected from live devils, we compared the percentage of missing data from both sample types. Across the DArTseq dataset, the overall percentage of missing data was 4.66% (0. 07–68.56%; SD = 7.87%). The average missing data from roadkill samples was comparable to the live individuals with 5.24% (0.13–38.99%; SD = 8.06%) and 4.65% (0.07–68.56%; SD = 7.87%), respectively. This analysis provided confidence to include the roadkill samples in subsequent analyses.
Average observed heterozygosity (HO) and expected heterozygosity (HE) across loci, and the associated standard errors, were calculated for each main site (sample size ≥9) using the Microsoft Excel Add In GenAlEx v6.502 (Peakall and Smouse, 2006, 2012). Standardised heterozygosity (HS) across individuals and the associated standard errors were calculated for each main site using the ‘genhet’ package (Coulon, 2010) in R. HS was used to compare heterozygosity between the different populations. Heterozygosity was not calculated for sites with roadkill samples only, as these sites often comprised small numbers of samples (1–5) and due to the opportunistic nature of sampling we could not be confident that samples within these sites were representative of a population. Inbreeding (FIS) and the associated 95% confidence intervals were calculated using the ‘diveRsity’ package in R (Keenan et al., 2013). NeEstimator v2.1 (Do et al., 2014) was used to estimate linkage-disequilibrium effective population size (Ne) for each main site with corrections for bias (Waples, 2006) and missing data (Peel et al., 2013). Jack-knifed 95% confidence intervals were reported (Jones et al., 2016).
Principal coordinate analyses (PCoAs) were performed to visualise genetic differentiation between all wild samples included in this study (N = 830; Figure 1D) and with the addition of 299 zoo-based IP and 254 Maria Island devils (Figure 1G). Isolation-by-distance was examined with a Mantel test in the ‘dartR’ package (Gruber et al., 2018), using geographic coordinates from trapping data. Genetic differentiation between populations (FST) was calculated using the “StAMPP” package for R (Pembleton et al., 2013). Genetic clusters were identified from the DArTseq SNP set using a variational Bayesian framework in the program fastSTRUCTURE v1.0 (Raj et al., 2014). We tested genetic clusters K = 1–10, following previous assessments of Tasmanian devil genetic clustering (Hendricks et al., 2017), with 10,000 iterations for each run and priors set to be logistic. The fastSTRUCTURE “choose K.py” script was run to determine the optimum K. The optimum value of K was used to create an STRUCTURE-style stacked bar graph using the base plotting functions in R v4.1.1.
Functional SNPs
A custom target capture approach was used to assess functional diversity from a smaller subset of devils (N = 158) from 17 locations including the IP and Maria Island (Table S2). Silver Plains was not sequenced with target capture due to delays in obtaining samples from fieldwork due to the COVID-19 pandemic. 4–28 devils per site were sequenced; all devils selected had extracted DNA as they were also genotyped with DArTseq. IP devils were selected on the basis of their pedigree-based mean kinship (average relatedness to the rest of the population) using the studbook (Srb, 2020) and PMx (Lacy et al., 2012). 19 IP devils that were within ±0.5 SD of the population average mean kinship were selected for targeted sequencing, as they are expected to be most representative of the genetic make-up of the insurance population, in addition to 9 others sequenced as part of an additional project.
The custom probe set was designed to capture three categories of sequence targets: 1) immune genes (N = 319) including MHC-related genes, Toll-like receptors, complement system proteins, natural killer cell receptors, cluster of differentiation antigens, antimicrobial peptides, T-cell receptors and immunoglobulin constant regions, and various cytokine families (Morris et al., 2015b); 2) reproductive genes (N = 237) involved in processes including hormonal regulation of reproduction, sexual/reproductive development, gametogenesis, fertilisation and embryogenesis (Brandies et al., 2021); 3) SNP loci (N = 388) which have been indicated by previous association studies to be under possible selection imposed by DFTD (see below). Only exons of the target genes were included in the probe design with 40 bp of flanking sequences included on each side of exons. The polymorphism of genes other than the known DFTD-associated variants was not considered (and typically not known) during probe design, reducing the possibility of ascertainment bias. Gene sequences used for probe design were based on RefSeq’s or Ensembl’s automatically generated gene annotations of the Tasmanian devil reference genome assembly Devil_ref v7.0 [GCA_000189315.1], except for previously manually curated immune genes (Cheng and Belov, 2014; Cheng et al., 2012; Morris et al., 2015b), for which the manually characterised sequences were used.
The DFTD-associated loci were previously identified via various approaches: the top 2.5% of allele frequency changes in a longitudinal pre-vs. post-DFTD arrival study (Epstein et al., 2016); a case-control analysis of DFTD infection (where cases were infected devils, and controls were devils that were trapped aged ≥2.2 years uninfected [GEMMA method] or 2.7 years uninfected [ANGSD method] and never re-trapped with infection; Margres et al., 2018a); analysis of length of time known to be alive post-infection as a proxy for survival (Margres et al., 2018a); estimated age at first observed infection (Margres et al., 2018a); a case-control FST outlier analysis of devils with or without evidence of tumour regression (measured as a decrease of the initial tumour volume by ≥ 15%; Margres et al., 2018b); and a genome-wide association study (GWAS) of devils that succumbed to DFTD at a young age versus devils with evidence of tumour regression (Wright et al., 2017). Initially 735 SNPs from these studies were considered for the probe set, however only 388 passed the myBaits probe design filtering criteria, as many were located in repeat-masked regions of the genome. The target sequences were submitted to Daicel Arbor Biosciences (Ann Arbor, US) for probe design and manufacture. The final probe set contained 28,952 probes in total, with the sequences available in Supplementary Data 1 (FASTA file).
DNA concentration was measured on a Nanodrop 2000 Spectrophotometer (ThermoFisher Scientific) and samples standardised to approximately 400ng input DNA. A 3× DNA clean-up was performed using KAPA Hyper-Pure Beads (Roche; cat: 0896385001) and a magnetic rack (Invitrogen, ThermoFisher Scientific; cat: 12331D), and the supernatant concentration was again measured by Nanodrop before standardising samples to 120ng input DNA. Library prep was performed using the KAPA HyperPlus Kit (Roche; cat: 07962428001) with the following specifications. Enzymatic fragmentation occurred in a 35-min incubation at 37°C. End repair and A-tailing followed in a 30-min incubation at 65°C using the HyperPrep End Repair & A-Tailing enzyme. Adapter ligation was performed by adding 5 μl of KAPA Unique Dual-Indexed Adapters (Roche; cat: 08861919702) to each sample product and incubating at room temperature for 2 h, protected from light. A 0.8× bead clean-up was performed before samples underwent library amplification with 45s initial denaturation at 98°C; 4 cycles of 15s 98°C denaturation, 30s annealing at 60°C, 30s extension at 72°C; and a final 1-min extension at 72°C before cooling to 4°C. Samples immediately underwent a 1× bead clean-up. The concentration and average library size of each sample was determined via Nanodrop and BioAnalyzer 2100 (Agilent) and used to pool samples in groups of 8 equimolarly for a total of 500ng DNA input in a final volume of 7μL.
The myBaits Hybridization Capture for Targeted NGS kit (Daicel Arbor Biosciences) was used to perform target capture with the custom baits described above. Baits were hybridised at 60°C for 10 min. Blockers were added to the pooled sample libraries and incubated at 95°C for 5 min, followed by a 65°C incubation for 5 min of both the blockers and the hybridisation mix. The hybridisation mix was then added to the blockers mix containing the pooled libraries, and this was incubated overnight at 65°C. A bind and wash bead clean-up and library resuspension was performed following the kit. Library amplification then occurred as follows: 98°C for 2 min; 12 cycles of 98°C for 20s, 60°C for 30s and 72°C for 30s; 72°C for 5 min before cooling to 8°C. A 1× bead clean-up was then performed.
Pooled and enriched libraries were quantified using a Qubit (ThermoFisher Scientific) with the dsDNA HS Assay kit (ThermoFisher Scientific; cat: Q32851) and diluted to approximately 0.1ng/μl. A qPCR was performed to assess the efficacy of target capture with primers designed for two control regions (GAPDH [F: CATCCCCAGCCAAAAAGTTATTC; R: GTAGCTTTGGGACAATGATGTGA], GUSB [F: GGCAGCATTCCTTCTCAAAGA; R: AATCCCTTTGGTCCAGAGAGAC]) and two enriched regions (DAB [F: CAGCCCGAGGTGACTGTGTATC; R: GTCTCCTCCCGCCCATTCAG], LTA [F: GCGGCCTCTACTTCATTTACT; R: CTTGGTACTTGGTGGAGAAGAG]). Each reaction contained 5 μl water, 7.5 μl Quantifast Sybr Green PCR MasterMix (Qiagen; cat: 204054), 1.5 μl primer mix and either 1μl pooled or enriched library (no additional material added for control reactions). 10μl of each reaction were cycled on a Rotor-Gene System (Qiagen, Germany), with initial denaturation at 95°C for 5 min, followed by 40 cycles of 95°C for 10 s and 55°C for 30 s. This was followed by a melt curve from 50°C to 99°C, increasing temperature by 1°C every 5 s. The copy number threshold (CT) was set to 0.2 and the CT of each gene was analyzed using Rotor-Gene Q Series Software (Qiagen).
Pooled enriched libraries (containing 8 samples) were further pooled equimolarly (96 samples, or 12 pooled libraries) and underwent a 1× bead clean-up. Final pooled libraries were then sequenced on a NovaSeq 6000 SP (Illumina) 2 × 150 bp with Illumina PhiX Control v3 spiked at 1% at Ramaciotti Center for Genomics (UNSW Sydney, Australia). Each sample was run over two lanes.
Paired-end, raw demultiplexed FASTQ files were returned from sequencing, with an average of 11,596,947 read pairs (range = 2,914,993–27,498,181; SD = 5,002,314). Sequencing quality was checked using FastQC (Andrews, 2010) and MultiQC (Ewels et al., 2016) and adapter contamination identified. Adapter trimming was performed using ‘trimmomatic’ v0.38 (Bolger et al., 2014) with the ILLUMINACLIP flag to specify adapter and Illumina specific sequences to trim, LEADING = 20, TRAILING = 20, SLIDINGWINDOW = 4:20 and MINLEN = 50. Sample reads from multiple lanes were merged together, and aligned to the Tasmanian devil reference genome (RefSeq mSarHar1.11, GCF_902635505.1) using BWA v0.7.17 (Li and Durbin, 2009) mem algorithm with a minimum seed length (-k) of 50. Picard v2.18.4 (Broad Institute Github Repository, 2019) and SAMtools v0.1.19 (Li et al., 2009) were used to sort and convert .SAM files to .BAM, index files and mark duplicates, and re-sort and index deduplicated .BAM files. The percentage of duplicated reads ranged from 64.2% to 90.8% (average = 77.3%; SD = 7.2%). ngsCAT v0.1 (López-Domingo et al., 2014) was used to identify the proportion of on- and off-target reads, with targets supplied via a .bed file. Of the mapped reads, 47.1%, on average, were on target (range = 28.4–66.4%; SD = 9.52%).
GATK v4.1.9.0 (McKenna et al., 2010) was used for variant calling and filtering. First, HaplotypeCaller was used with the -L flag to retain only variants within target regions. GenomicsDBImport was used to build a catalog of variants within target regions across all samples. Next, GenotypeGVCFs was applied to generate a single file containing all samples and SelectVariants was used to retain SNP variants only. Finally, VariantFiltration was used to remove variants with DP (coverage) < 2,480, QD (quality score normalised by allele depth) < 2.0, SOR (strand bias estimated by the symmetric odds ratio test) > 3.0, MQ (mapping quality) < 40.0, MQRankSum (mapping quality rank sum test) < −12.5 and ReadPosRankSum (rank sum for relative positioning of REF versus ALT alleles within reads) < −8.0, resulting in 1,783 variants.
The ‘SNPRelate’ R package (Zheng et al., 2012) was used to prune linked SNPs with a linkage disequilibrium (LD) threshold of 0.3, resulting in 730 SNPs remaining. Further filtering on MAF >0.01, heterozygosity ≤90%, and removing loci with unknown alternate alleles resulted in 313 SNPs retained for further analysis. One sample was sequenced in replicate. Genotypes were identical between replicates at all but one locus, representing a known genotyping error rate of 0.32%. We also analyzed the SNP data without any linkage pruning (N = 971 SNPs after filtering on MAF >0.01, heterozygosity ≤90%, and removing loci with unknown alternate alleles), but results were uninterpretable most likely due to strong LD (Figure S10), justifying the need for pruning in this dataset. Strong LD (to at least 100 kb) has been found in all populations investigated by Epstein et al., (2016), and Wright et al., (2017) applied SNP pruning of LD > 0.8 in 50 bp windows. All further analyses proceeded with the pruned SNPs. Loci that were included in the target capture due to their association with devil facial tumor disease were subset for separate analysis (see below). HO, HE, and HS were calculated from the target capture data for each population (Table S2) as per the genome-wide data. A PCoA was performed, firstly for all wild devils (Figure 1E), and then with the addition of the IP and Maria Island devils (Figure 1F) to visualise how well they reflect wild diversity. Target capture data was then subset into immune genes, reproductive genes, and DFTD-associated loci. PCoAs of diversity at reproductive genes were performed for male (N = 60) and female (N = 72) devils separately as some genes are located on chromosome X (AKAP4, AR, ATRX, DIAPH2, FMR1, IRS4, and SOX3). The top 5 SNPs with the highest absolute loadings on axis 1 and 2 of the PCoA (contributing the most to variation) were identified and interpreted in relation to their function.
Prior to filtering on linkage disequilibrium, we performed haplotype phasing at reproductive and immune genes with at least one SNP variant in the coding region. Variants within coding regions of genes were identified with BEDTools v2.25.0 (Quinlan and Hall, 2010), and the program PHASE v2.1.1 (Stephens et al., 2001; Stephens and Scheet, 2005) was used to phase haplotypes with a minimum haplotype count of 2. Allele frequencies were calculated in R from the phased data for each gene at each population. The immune genes were categorised into 8 main groups: antimicrobial peptides; cluster of differentiation; complement; cytokines; immunoglobulins; MHC and MHC-related genes; natural killer cell receptors; and toll-like receptors. If there were multiple genes within a gene family containing variants in coding regions, allele frequency differences were visualised with heatmaps. The number of SNPs in genes, exons and coding regions for each gene family is summarised in Table S3.
Quantification and statistical analysis
Genome-wide SNPs
Statistically significant inbreeding (FIS) was determined at an α = 0.05 as the 95% CI excluding zero. The confidence intervals were obtained using 1000 bootstraps from the ‘diveRsity’ package in R (Keenan et al., 2013).
Functional SNPs
Sequence variants (alleles) of each gene that contained SNPs within the coding regions were predicted using PHASE v2.1.1 (Stephens and Donnelly, 2003) and aligned using ClustalW (Larkin et al., 2007). Sequence variants that were found only once were excluded from the analysis. Testing for evidence of individual residues under negative or positive selections were carried out via Datamonkey webserver (Delport et al., 2010) using the methods of mixed effects model evolution (Murrell et al., 2012) and fixed effects likelihood (Pond and Muse, 2005).
At the 53 DFTD-associated loci, samples were grouped by their fastSTRUCTURE assignment (see Table 1) into clusters 1–6, the IP, and Maria Island for allele frequency analysis. Forestier samples were excluded from cluster 4 as they were sampled in 2019 for the target capture analysis, after depopulation of the peninsula in 2012 and reintroduction in 2015, and thus represent a mix of original Forestier and insurance metapopulation bloodlines (Huxtable and Brown, 2019). Weir and Cockerham’s FST was calculated with VCFtools v0.1.14 (Danecek et al., 2011) between each group (Table S6). FST outlier analysis was performed by identifying the top 1% of pairwise FST values and examining if any outliers occurred between the IP or Maria and cluster 3 or 4, as these are disease-affected clusters with robust sample sizes for comparison. FST outlier analysis was repeated on a subset of groups (cluster 3, 4, IP and Maria) to minimise spurious outliers as a result of small sample sizes (pairwise FST presented in Table S7). The nearest gene and the distance of outlier SNPs to the midpoint of the nearest gene was identified from the annotated reference genome. Finally, we identified the most common allele in the wild (considering all wild samples), calculated the frequency of the most common wild allele in each cluster and visualised common wild allele frequency differences by heatmaps generated with base R.
Additional resources
This study did not generate new resources.
Acknowledgments
We acknowledge the traditional custodians of the land on which these devil populations live and pay respects to their elders past and present. Due to the size and complexity of this project, there are many people to acknowledge and thank. Thank you to the field teams of the Save the Tasmanian Devil Program who collected samples over the years, particularly Bill Brown, Stewart Huxtable, Clare Lawrence, Billie Lazenby, Phil Wise, and David Pemberton, and the members of the public who contributed to the roadkill project. Thank you to Catherine Grueber for advice on allele frequency analysis. We also thank the members of the AWGG lab team, Jian Cui, Riley Ferguson, Luke Silver, and Parice Brandies, in addition to the Sydney Informatics Hub, Amazon Web Services, and RONIN for their compute support. This work was funded by the Toledo Zoo and Aquarium, the Australian Research Council (LP180100244), the Save the Tasmanian Devil Program, and the San Diego Zoo Wildlife Alliance.
Author contributions
Conceptualization, C.J.H., K.A.F., E.A.M., K.B., S.F., A.V.L.; Methodology, Y.C.; Software, K.A.F., E.A.M., Y.C.; Validation, K.A.F., E.A.M.; Formal Analysis, K.A.F., E.A.M., Y.C.; Investigation, K.A.F., E.A.M., Y.C., L.A.; Resources, C.J.H., S.F., A.V.L.; Writing—Original Draft, C.J.H., K.A.F., E.A.M.; Writing—Review & Editing, all authors; Visualization, C.J.H., A.V.L., K.A.F., E.A.M.; Supervision, C.J.H. and K.B.; Funding acquisition, C.J.H., S.F., A.V.L., K.B.
Declaration of interests
The authors declare that they have no conflict of interest.
Inclusion and diversity
The authors of this paper represent early, mid, and established career researchers, in addition to conservation practitioners.
Published: July 15, 2022
Footnotes
Supplemental information can be found online at https://doi.org/10.1016/j.isci.2022.104474.
Supplemental information
Data and code availability
-
•
DArTseq and target capture genotypes, including the custom target capture probes, have been deposited onto Dryad (https://doi.org/10.5061/dryad.2bvq83bsm).
-
•
Original code is available from the lead contact upon request.
-
•
Any additional information required to reanalyze the data reported in this paper is available from the lead contact upon request.
References
- Al-Breiki R.D., Kjeldsen S.R., Afzal H., Al Hinai M.S., Zenger K.R., Jerry D.R., Al-Abri M.A., Delghandi M. Genome-wide SNP analyses reveal high gene flow and signatures of local adaptation among the scalloped spiny lobster (Panulirus homarus) along the Omani coastline. BMC Genom. 2018;19:1–13. doi: 10.1186/s12864-018-5044-8. [DOI] [PMC free article] [PubMed] [Google Scholar]
- Allendorf F., Luikart G., Aitken S. John Wiley & Sons; 2012. Conservation and the Genetics of Populations. [Google Scholar]
- Andrews S. 5 ed. vol 11. 2010. (FastQC: A Quality Control Tool for High Throughput Sequence Data). [Google Scholar]
- Bolam F.C., Mair L., Angelico M., Brooks T.M., Burgman M., Hermes C., Hoffmann M., Martin R.W., McGowan P.J., Rodrigues A.S. How many bird and mammal extinctions has recent conservation action prevented? Conserv. Lett. 2021;14:e12762. [Google Scholar]
- Bolger A.M., Lohse M., Usadel B. Trimmomatic: a flexible trimmer for Illumina sequence data. Bioinformatics. 2014;30:2114–2120. doi: 10.1093/bioinformatics/btu170. [DOI] [PMC free article] [PubMed] [Google Scholar]
- Brandies P.A., Wright B.R., Hogg C.J., Grueber C.E., Belov K. Characterization of reproductive gene diversity in the endangered Tasmanian devil. Mol. Ecol. Resour. 2021;21:721–732. doi: 10.1111/1755-0998.13295. [DOI] [PubMed] [Google Scholar]
- Broad Institute Github Repository . Broad Institute; 2019. Picard Toolkit. [Google Scholar]
- Brüniche-Olsen A., Burridge C.P., Austin J.J., Jones M.E. Disease induced changes in gene flow patterns among Tasmanian devil populations. Biol. Conserv. 2013;165:69–78. [Google Scholar]
- Brüniche-Olsen A., Jones M.E., Austin J.J., Burridge C.P., Holland B.R. Extensive population decline in the Tasmanian devil predates European settlement and devil facial tumour disease. Biol. Lett. 2014;10:20140619. doi: 10.1098/rsbl.2014.0619. [DOI] [PMC free article] [PubMed] [Google Scholar]
- Catchen J., Hohenlohe P.A., Bassham S., Amores A., Cresko W.A. Stacks: an analysis tool set for population genomics. Mol. Ecol. 2013;22:3124–3140. doi: 10.1111/mec.12354. [DOI] [PMC free article] [PubMed] [Google Scholar]
- Catchen J.M., Amores A., Hohenlohe P.A., Cresko W., Postlethwait J.H. Stacks: building and genotyping loci de novo from short-read sequences. G3: Genes Genom. Genet. 2011;1:171–182. doi: 10.1534/g3.111.000240. [DOI] [PMC free article] [PubMed] [Google Scholar]
- CBSG/DPIPWE/ARAZPA . DPIPWE; 2009. The Save the Tasmanian Devil Program: Strategic Framework for an Insurance Meta-Population. [Google Scholar]
- Cheng Y., Belov K. Characterisation of non-classical MHC class I genes in the Tasmanian devil (Sarcophilus harrisii) Immunogenetics. 2014;66:727–735. doi: 10.1007/s00251-014-0804-3. [DOI] [PubMed] [Google Scholar]
- Cheng Y., Grueber C., Hogg C.J., Belov K. Improved high-throughput MHC typing for non-model species using long-read sequencing. Mol. Ecol. Resour. 2021;22:862–876. doi: 10.1111/1755-0998.13511. [DOI] [PMC free article] [PubMed] [Google Scholar]
- Cheng Y., Heasman K., Peck S., Peel E., Gooley R.M., Papenfuss A.T., Hogg C.J., Belov K. Significant decline in anticancer immune capacity during puberty in the Tasmanian devil. Sci. Rep. 2017;7:44716. doi: 10.1038/srep44716. [DOI] [PMC free article] [PubMed] [Google Scholar]
- Cheng Y., Sanderson C., Jones M., Belov K. Low MHC class II diversity in the Tasmanian devil (Sarcophilus harrisii) Immunogenetics. 2012;64:525–533. doi: 10.1007/s00251-012-0614-4. [DOI] [PubMed] [Google Scholar]
- Christe C., Kozlowski G., Frey D., Fazan L., Bétrisey S., Pirintsos S., Gratzfeld J., Naciri Y. Do living ex situ collections capture the genetic variation of wild populations? A molecular analysis of two relict tree species, Zelkova abelica and Zelkova carpinifolia. Biodivers. Conserv. 2014;23:2945–2959. [Google Scholar]
- Coulon A. genhet: an easy-to-use R function to estimate individual heterozygosity. Mol. Ecol. Resour. 2010;10:167–169. doi: 10.1111/j.1755-0998.2009.02731.x. [DOI] [PubMed] [Google Scholar]
- Cui J., Cheng Y., Belov K. Diversity in the Toll-like receptor genes of the Tasmanian devil (Sarcophilus harrisii) Immunogenetics. 2015;67:195–201. doi: 10.1007/s00251-014-0823-0. [DOI] [PubMed] [Google Scholar]
- Cunningham C.X., Comte S., McCallum H., Hamilton D.G., Hamede R., Storfer A., Hollings T., Ruiz-Aravena M., Kerlin D.H., Brook B.W. Quantifying 25 years of disease-caused declines in Tasmanian devil populations: host density drives spatial pathogen spread. Ecol. Lett. 2021;24:958–969. doi: 10.1111/ele.13703. [DOI] [PMC free article] [PubMed] [Google Scholar]
- Danecek P., Auton A., Abecasis G., Albers C.A., Banks E., DePristo M.A., Handsaker R.E., Lunter G., Marth G.T., Sherry S.T., et al. The variant call format and VCFtools. Bioinformatics. 2011;27:2156–2158. doi: 10.1093/bioinformatics/btr330. [DOI] [PMC free article] [PubMed] [Google Scholar]
- Delport W., Poon A.F., Frost S.D., Kosakovsky Pond S.L. Datamonkey 2010: a suite of phylogenetic analysis tools for evolutionary biology. Bioinformatics. 2010;26:2455–2457. doi: 10.1093/bioinformatics/btq429. [DOI] [PMC free article] [PubMed] [Google Scholar]
- Do C., Waples R.S., Peel D., Macbeth G.M., Tillett B.J., Ovenden J.R. NeEstimator v2: re-implementation of software for the estimation of contemporary effective population size (Ne) from genetic data. Mol. Ecol. Resour. 2014;14:209–214. doi: 10.1111/1755-0998.12157. [DOI] [PubMed] [Google Scholar]
- Epstein B., Jones M., Hamede R., Hendricks S., McCallum H., Murchison E.P., Schonfeld B., Wiench C., Hohenlohe P., Storfer A. Rapid evolutionary response to a transmissible cancer in Tasmanian devils. Nat. Commun. 2016;7:1–7. doi: 10.1038/ncomms12684. [DOI] [PMC free article] [PubMed] [Google Scholar]
- Ewels P., Magnusson M., Lundin S., Käller M. MultiQC: summarize analysis results for multiple tools and samples in a single report. Bioinformatics. 2016;32:3047–3048. doi: 10.1093/bioinformatics/btw354. [DOI] [PMC free article] [PubMed] [Google Scholar]
- Fan J., Zheng X., Wang H., Qi H., Jiang B., Qiao M., Zhou J., Bu S. Analysis of genetic diversity and population structure in three forest musk deer captive populations with different origins. G3: Genes Genom. Genet. 2019;9:1037–1044. doi: 10.1534/g3.119.400001. [DOI] [PMC free article] [PubMed] [Google Scholar]
- Farquharson K.A., Gooley R.M., Fox S., Huxtable S.J., Belov K., Pemberton D., Hogg C.J., Grueber C.E. Are any populations ‘safe’? Unexpected reproductive decline in a population of Tasmanian devils free of devil facial tumour disease. Wildl. Res. 2018;45:31–37. [Google Scholar]
- Farquharson K.A., Hogg C.J., Grueber C.E. Pedigree analysis reveals a generational decline in reproductive success of captive Tasmanian devil (Sarcophilus harrisii): implications for captive management of threatened species. J. Hered. 2017;108:488–495. doi: 10.1093/jhered/esx030. [DOI] [PubMed] [Google Scholar]
- Fernandez-Fournier P., Lewthwaite J.M., Mooers A.Ø. Do we need to identify adaptive genetic variation when prioritizing populations for conservation? Conserv. Genet. 2021;22:205–216. [Google Scholar]
- Fleischer R., Risely A., Hoeck P.E., Keller L.F., Sommer S. Mechanisms governing avian phylosymbiosis: genetic dissimilarity based on neutral and MHC regions exhibits little relationship with gut microbiome distributions of Galápagos mockingbirds. Ecol. Evol. 2020;10:13345–13354. doi: 10.1002/ece3.6934. [DOI] [PMC free article] [PubMed] [Google Scholar]
- Fox S., Seddon P.J. In: Saving the Tasmanian Devil: recovery through science based management. Hogg C.J., Fox S., Pemberton D., Belov K., editors. CSIRO Publishing; 2019. Wild devil recovery: managing devils in the presence of disease; pp. 157–164. [Google Scholar]
- Fraik A.K., Margres M.J., Epstein B., Barbosa S., Jones M., Hendricks S., Schönfeld B., Stahlke A.R., Veillet A., Hamede R. Disease swamps molecular signatures of genetic-environmental associations to abiotic factors in Tasmanian devil (Sarcophilus harrisii) populations. Evolution. 2020;74:1392–1408. doi: 10.1111/evo.14023. [DOI] [PMC free article] [PubMed] [Google Scholar]
- Frankham R. Genetic adaptation to captivity in species conservation programs. Mol. Ecol. 2008;17:325–333. doi: 10.1111/j.1365-294X.2007.03399.x. [DOI] [PubMed] [Google Scholar]
- Frankham R. Challenges and opportunities of genetic approaches to biological conservation. Biol. Conserv. 2010;143:1919–1927. [Google Scholar]
- Frankham R., Ballou J.D., Ralls K., Eldridge M., Dudash M.R., Fenster C.B., Lacy R.C., Sunnucks P. Oxford University Press; 2017. Genetic Management of Fragmented Animal and Plant Populations. [Google Scholar]
- Gooley R.M., Hogg C.J., Fox S., Pemberton D., Belov K., Grueber C.E. Inbreeding depression in one of the last DFTD-free wild populations of Tasmanian devils. PeerJ. 2020;8:e9220. doi: 10.7717/peerj.9220. [DOI] [PMC free article] [PubMed] [Google Scholar]
- Gruber B., Unmack P.J., Berry O.F., Georges A. dartr: an R package to facilitate analysis of SNP data generated from reduced representation genome sequencing. Mol. Ecol. Resour. 2018;18:691–699. doi: 10.1111/1755-0998.12745. [DOI] [PubMed] [Google Scholar]
- Grueber C.E., Fox S., McLennan E.A., Gooley R.M., Pemberton D., Hogg C.J., Belov K. Complex problems need detailed solutions: harnessing multiple data types to inform genetic management in the wild. Evol. Appl. 2018;12:280–291. doi: 10.1111/eva.12715. [DOI] [PMC free article] [PubMed] [Google Scholar]
- Guiler E. Sarcophilus harrisii (Marsupialia: Dasyuridae) II. Reproduction, breeding, and growth of pouch young. Aust. J. Zool. 1970;18:63–70. [Google Scholar]
- Hamede R., Madsen T., McCallum H., Storfer A., Hohenlohe P.A., Siddle H., Kaufman J., Giraudeau M., Jones M., Thomas F. Darwin, the devil, and the management of transmissible cancers. Biol. Conserv. 2021;35:748. doi: 10.1111/cobi.13644. [DOI] [PMC free article] [PubMed] [Google Scholar]
- Hartmann S.A., Schaefer H.M., Segelbacher G. Genetic depletion at adaptive but not neutral loci in an endangered bird species. Mol. Ecol. 2014;23:5712–5725. doi: 10.1111/mec.12975. [DOI] [PubMed] [Google Scholar]
- Hendricks S., Epstein B., Schönfeld B., Wiench C., Hamede R., Jones M., Storfer A., Hohenlohe P. Conservation implications of limited genetic diversity and population structure in Tasmanian devils (Sarcophilus harrisii) Conserv. Genet. 2017;18:977–982. doi: 10.1007/s10592-017-0939-5. [DOI] [PMC free article] [PubMed] [Google Scholar]
- Hogg C., McLennan E., Wise P., Lee A., Pemberton D., Fox S., Belov K., Grueber C. Preserving the demographic and genetic integrity of a single source population during multiple translocations. Biol. Conserv. 2020;241:108318. [Google Scholar]
- Hogg C.J., Ivy J.A., Srb C., Hockley J., Lees C., Hibbard C., Jones M. Influence of genetic provenance and birth origin on productivity of the Tasmanian devil insurance population. Conserv. Genet. 2015;16:1465–1473. [Google Scholar]
- Hogg C.J., Lee A.V., Hibbard C.J. In: Saving the Tasmanian Devil: recovery through science based management. Hogg C.J., Fox S., Pemberton D., Belov K., editors. CSIRO Publishing; 2019. Managing a metapopulation: intensive to wild and all the places in between; pp. 169–182. [Google Scholar]
- Hogg C.J., Lee A.V., Srb C., Hibbard C. Metapopulation management of an Endangered species with limited genetic diversity in the presence of disease: the Tasmanian devil Sarcophilus harrisii. Int. Zoo Yearb. 2017;51:137–153. [Google Scholar]
- Hohenlohe P.A., McCallum H.I., Jones M.E., Lawrance M.F., Hamede R.K., Storfer A. Conserving adaptive potential: lessons from Tasmanian devils and their transmissible cancer. Conserv. Genet. 2019;20:81–87. doi: 10.1007/s10592-019-01157-5. [DOI] [PMC free article] [PubMed] [Google Scholar]
- Howard J., Lynch C., Santymire R., Marinari P., Wildt D. Recovery of gene diversity using long-term cryopreserved spermatozoa and artificial insemination in the endangered black-footed ferret. Anim. Conserv. 2016;19:102–111. [Google Scholar]
- Huxtable S., Brown W.E. In: Saving the Tasmanian Devil: recovery through science based management. Hogg C.J., Fox S., Pemberton D., Belov K., editors. CSIRO Publishing; 2019. The depopulation and reintroduction of devils on the Forestier Peninsula. [Google Scholar]
- IUCN/SSC . IUCN Species Survival Commission; 2013. Guidelines for Reintroductions and Other Conservation Translocations. Version 1.0. [Google Scholar]
- IUCN/SSC . IUCN Species Survival Commission; 2014. Guidelines on the Use of Ex Situ Management for Species Conservation. Version 2.0. [Google Scholar]
- Jamieson I.G. Founder effects, inbreeding, and loss of genetic diversity in four avian reintroduction programs. Biol. Conserv. 2011;25:115–123. doi: 10.1111/j.1523-1739.2010.01574.x. [DOI] [PubMed] [Google Scholar]
- Johnson R.N., O'Meally D., Chen Z., Etherington G.J., Ho S.Y.W., Nash W.J., Grueber C.E., Cheng Y., Whittington C.M., Dennison S., et al. Adaptation and conservation insights from the koala genome. Nat. Genet. 2018;50:1102–1111. doi: 10.1038/s41588-018-0153-5. [DOI] [PMC free article] [PubMed] [Google Scholar]
- Jones A.T., Ovenden J.R., Wang Y.G. Improved confidence intervals for the linkage disequilibrium method for estimating effective population size. Heredity. 2016;117:217–223. doi: 10.1038/hdy.2016.19. [DOI] [PMC free article] [PubMed] [Google Scholar]
- Jones M., McCallum H. Managing an emerging disease in a threatened species: Tasmanian devil facial tumour disease. Aust. N. Z. J. Obstet. Gynaecol. 2007;47:A16. [Google Scholar]
- Jones M.E., Cockburn A., Hamede R., Hawkins C., Hesterman H., Lachish S., Mann D., McCallum H., Pemberton D. Life-history change in disease-ravaged Tasmanian devil populations. Proc. Natl. Acad. Sci. 2008;105:10023–10027. doi: 10.1073/pnas.0711236105. [DOI] [PMC free article] [PubMed] [Google Scholar]
- Jones M.E., Paetkau D., Geffen E., Moritz C. Genetic diversity and population structure of Tasmanian devils, the largest marsupial carnivore. Mol. Ecol. 2004;13:2197–2209. doi: 10.1111/j.1365-294X.2004.02239.x. [DOI] [PubMed] [Google Scholar]
- Keenan K., McGinnity P., Cross T.F., Crozier W.W., Prodöhl P.A. diveRsity: an R package for the estimation and exploration of population genetics parameters and their associated errors. Methods Ecol. Evol. 2013;4:782–788. [Google Scholar]
- Khalatbari L., O'Neill H.M., Ostrowski S., Yusefi G.H., Ghoddousi A., Abolghasemi H., Breitenmoser-Würsten C., Breitenmoser U., Brito J.C., Durant S.M. Risks to conservation of species in the wild from promoting ex situ management: response to Farhadinia et al. 2020. Biol. Conserv. 2021;1:4. doi: 10.1111/cobi.13786. [DOI] [PubMed] [Google Scholar]
- Kwon Y.M., Gori K., Park N., Potts N., Swift K., Wang J., Stammnitz M.R., Cannell N., Baez-Ortega A., Comte S. Evolution and lineage dynamics of a transmissible cancer in Tasmanian devils. PLoS Biol. 2020;18:e3000926. doi: 10.1371/journal.pbio.3000926. [DOI] [PMC free article] [PubMed] [Google Scholar]
- Lachish S., McCallum H., Jones M. Demography, disease and the devil: life-history changes in a disease-affected population of Tasmanian devils (Sarcophilus harrisii) J. Anim. Ecol. 2009;78:427–436. doi: 10.1111/j.1365-2656.2008.01494.x. [DOI] [PubMed] [Google Scholar]
- Lachish S., Miller K., Storfer A., Goldizen A., Jones M. Evidence that disease-induced population decline changes genetic structure and alters dispersal patterns in the Tasmanian devil. Heredity. 2011;106:172–182. doi: 10.1038/hdy.2010.17. [DOI] [PMC free article] [PubMed] [Google Scholar]
- Lacy R.C., Ballou J.D., Pollak J.P. PMx: software package for demographic and genetic analysis and management of pedigreed populations. Methods Ecol. Evol. 2012;3:433–437. [Google Scholar]
- Larkin M.A., Blackshields G., Brown N.P., Chenna R., McGettigan P.A., McWilliam H., Valentin F., Wallace I.M., Wilm A., Lopez R. Clustal W and clustal X version 2.0. Bioinformatics. 2007;23:2947–2948. doi: 10.1093/bioinformatics/btm404. [DOI] [PubMed] [Google Scholar]
- Lawrence C., Weirsma H.F. In: Saving the Tasmanian Devil: Recovery Through Science-Based Management. Hogg C.J., Fox S., Pemberton D., Belov K., editors. CSIRO Publishing; 2019. DFTD is a killer but what about other threats? pp. 131–138. [Google Scholar]
- Lazenby B.T., Tobler M.W., Brown W.E., Hawkins C.E., Hocking G.J., Hume F., Huxtable S., Iles P., Jones M.E., Lawrence C., et al. Density trends and demographic signals uncover the long-term impact of transmissible cancer in Tasmanian devils. J. Anim. Ecol. 2018;55:1365–2664. doi: 10.1111/1365-2664.13088. [DOI] [PMC free article] [PubMed] [Google Scholar]
- Lewin H.A., Robinson G.E., Kress W.J., Baker W.J., Coddington J., Crandall K.A., Durbin R., Edwards S.V., Forest F., Gilbert M.T.P. Earth BioGenome project: sequencing life for the future of life. Proc. Natl. Acad. Sci. 2018;115:4325–4333. doi: 10.1073/pnas.1720115115. [DOI] [PMC free article] [PubMed] [Google Scholar]
- Lewis A.N. Paper and Proceedings of the Royal Society of Tasmania; 1944. Pleistocene Glaciation in Tasmania. [Google Scholar]
- Li H., Durbin R. Fast and accurate short read alignment with Burrows–Wheeler transform. Bioinformatics. 2009;25:1754–1760. doi: 10.1093/bioinformatics/btp324. [DOI] [PMC free article] [PubMed] [Google Scholar]
- Li H., Handsaker B., Wysoker A., Fennell T., Ruan J., Homer N., Marth G., Abecasis G., Durbin R., 1000 Genome Project Data Processing Subgroup The sequence alignment/map format and SAMtools. Bioinformatics. 2009;25:2078–2079. doi: 10.1093/bioinformatics/btp352. [DOI] [PMC free article] [PubMed] [Google Scholar]
- Loh R., Bergfeld J., Hayes D., O’Hara A., Pyecroft S., Raidal S. The pathology of devil facial tumor disease (DFTD) in Tasmanian devils (Sarcophilus harrisii) Vet. Pathol. 2006;43:890–895. doi: 10.1354/vp.43-6-890. [DOI] [PubMed] [Google Scholar]
- López-Domingo F.J., Florido J.P., Rueda A., Dopazo J., Santoyo-Lopez J. ngsCAT: a tool to assess the efficiency of targeted enrichment sequencing. Bioinformatics. 2014;30:1767–1768. doi: 10.1093/bioinformatics/btu108. [DOI] [PubMed] [Google Scholar]
- Margres M.J., Jones M.E., Epstein B., Kerlin D.H., Comte S., Fox S., Fraik A.K., Hendricks S.A., Huxtable S., Lachish S. Large-effect loci affect survival in Tasmanian devils (Sarcophilus harrisii) infected with a transmissible cancer. Mol. Ecol. 2018;27:4189–4199. doi: 10.1111/mec.14853. [DOI] [PMC free article] [PubMed] [Google Scholar]
- Margres M.J., Ruiz-Aravena M., Hamede R., Jones M.E., Lawrance M.F., Hendricks S.A., Patton A., Davis B.W., Ostrander E.A., McCallum H. The genomic basis of tumor regression in Tasmanian devils (Sarcophilus harrisii) Genome Biol. Evol. 2018;10:3012–3025. doi: 10.1093/gbe/evy229. [DOI] [PMC free article] [PubMed] [Google Scholar]
- McCallum H., Jones M., Hawkins C., Hamede R., Lachish S., Sinn D.L., Beeton N., Lazenby B. Transmission dynamics of Tasmanian devil facial tumor disease may lead to disease-induced extinction. Ecology. 2009;90:3379–3392. doi: 10.1890/08-1763.1. [DOI] [PubMed] [Google Scholar]
- McCallum H., Tompkins D.M., Jones M., Lachish S., Marvanek S., Lazenby B., Hocking G., Wiersma J., Hawkins C.E. Distribution and impacts of Tasmanian devil facial tumor disease. EcoHealth. 2007;4:318–325. [Google Scholar]
- McGowan P.J., Traylor-Holzer K., Leus K. IUCN guidelines for determining when and how ex situ management should be used in species conservation. Conserv. Lett. 2017;10:361–366. doi: 10.1111/conl.12285. [DOI] [Google Scholar]
- McKenna A., Hanna M., Banks E., Sivachenko A., Cibulskis K., Kernytsky A., Garimella K., Altshuler D., Gabriel S., Daly M., et al. The Genome Analysis Toolkit: a MapReduce framework for analyzing next-generation DNA sequencing data. Genome Res. 2010;20:1297–1303. doi: 10.1101/gr.107524.110. [DOI] [PMC free article] [PubMed] [Google Scholar]
- McLennan E., Grueber C., Wise P., Belov K., Hogg C. Mixing genetically differentiated populations successfully boosts diversity of an endangered carnivore. Anim. Conserv. 2020;23:700–712. [Google Scholar]
- McLennan E.A., Gooley R.M., Wise P., Belov K., Hogg C.J., Grueber C.E. Pedigree reconstruction using molecular data reveals an early warning sign of gene diversity loss in an island population of Tasmanian devils (Sarcophilus harrisii) Conserv. Genet. 2018;19:439–450. [Google Scholar]
- McLennan E.A., Wright B.R., Belov K., Hogg C.J., Grueber C.E. Too much of a good thing? Finding the most informative genetic data set to answer conservation questions. Mol. Ecol. Res. 2019;19:659–671. doi: 10.1111/1755-0998.12997. [DOI] [PubMed] [Google Scholar]
- Miller W., Hayes V.M., Ratan A., Petersen D.C., Wittekindt N.E., Miller J., Walenz B., Knight J., Qi J., Zhao F. Genetic diversity and population structure of the endangered marsupial Sarcophilus harrisii (Tasmanian devil) Proc. Natl. Acad. Sci. 2011;108:12348–12353. doi: 10.1073/pnas.1102838108. [DOI] [PMC free article] [PubMed] [Google Scholar]
- Morris K., Austin J.J., Belov K. Low major histocompatibility complex diversity in the Tasmanian devil predates European settlement and may explain susceptibility to disease epidemics. Biol. Lett. 2013;9:20120900. doi: 10.1098/rsbl.2012.0900. [DOI] [PMC free article] [PubMed] [Google Scholar]
- Morris K., Wright B., Grueber C.E., Hogg C.J., Belov K. Lack of genetic diversity across diverse immune genes in an endangered mammal, the Tasmanian devil (Sarcophilus harrisii) Mol. Ecol. 2015;24:3860–3872. doi: 10.1111/mec.13291. [DOI] [PubMed] [Google Scholar]
- Morris K.M., Cheng Y., Warren W., Papenfuss A.T., Belov K. Identification and analysis of divergent immune gene families within the Tasmanian devil genome. BMC Genom. 2015;16:1–12. doi: 10.1186/s12864-015-2206-9. [DOI] [PMC free article] [PubMed] [Google Scholar]
- Murchison E.P., Schulz-Trieglaff O.B., Ning Z., Alexandrov L.B., Bauer M.J., Fu B., Hims M., Ding Z., Ivakhno S., Stewart C. Genome sequencing and analysis of the Tasmanian devil and its transmissible cancer. Cell. 2012;148:780–791. doi: 10.1016/j.cell.2011.11.065. [DOI] [PMC free article] [PubMed] [Google Scholar]
- Murrell B., Wertheim J.O., Moola S., Weighill T., Scheffler K., Kosakovsky Pond S.L. Detecting individual sites subject to episodic diversifying selection. PLoS Genet. 2012;8:e1002764. doi: 10.1371/journal.pgen.1002764. [DOI] [PMC free article] [PubMed] [Google Scholar]
- O'Connell K.A., Mulder K.P., Maldonado J., Currie K.L., Ferraro D.M. Sampling related individuals within ponds biases estimates of population structure in a pond-breeding amphibian. Ecol. Evol. 2019;9:3620–3636. doi: 10.1002/ece3.4994. [DOI] [PMC free article] [PubMed] [Google Scholar]
- Patchett A.L., Tovar C., Corcoran L.M., Lyons A.B., Woods G.M. The toll-like receptor ligands Hiltonol®(polyICLC) and imiquimod effectively activate antigen-specific immune responses in Tasmanian devils (Sarcophilus harrisii) Dev. Comp. Immunol. 2017;76:352–360. doi: 10.1016/j.dci.2017.07.004. [DOI] [PubMed] [Google Scholar]
- Peakall R., Smouse P.E. GenAlEx 6: genetic analysis in Excel. Population genetic software for teaching and research. Mol. Ecol. Notes. 2006;6:288–295. doi: 10.1093/bioinformatics/bts460. [DOI] [PMC free article] [PubMed] [Google Scholar]
- Peakall R., Smouse P.E. GenAlEx 6.5: genetic analysis in Excel. Population genetic software for teaching and research - an update. Bioinformatics. 2012;28:2537–2539. doi: 10.1111/j.1471-8286.2005.01155.x. [DOI] [PMC free article] [PubMed] [Google Scholar]
- Pearse A.M., Swift K. Allograft theory: transmission of devil facial-tumour disease. Nature. 2006;439:549. doi: 10.1038/439549a. [DOI] [PubMed] [Google Scholar]
- Pearse A.M., Swift K., Hodson P., Hua B., McCallum H., Pyecroft S., Taylor R., Eldridge M.D.B., Belov K. Evolution in a transmissible cancer: a study of the chromosomal changes in devil facial tumor (DFT) as it spreads through the wild Tasmanian devil population. Cancer Genet. 2012;205:101–112. doi: 10.1016/j.cancergen.2011.12.001. [DOI] [PubMed] [Google Scholar]
- Peel D., Waples R.S., Macbeth G.M., Do C., Ovenden J.R. Accounting for missing data in the estimation of contemporary genetic effective population size (Ne) Mol. Ecol. Resour. 2013;13:243–253. doi: 10.1111/1755-0998.12049. [DOI] [PubMed] [Google Scholar]
- Pemberton D. In: Saving the Tasmanian Devil: Recovery Through Science-based Management. Hogg C., Fox S., Pemberton D., Belov K., editors. CSIRO Publishing; 2019. The Tasmanian devil: a uniquely threatened animal; pp. 11–22. [Google Scholar]
- Pembleton L.W., Cogan N.O., Forster J.W. StAMPP: an R package for calculation of genetic differentiation and structure of mixed-ploidy level populations. Mol. Ecol. Resour. 2013;13:946–952. doi: 10.1111/1755-0998.12129. [DOI] [PubMed] [Google Scholar]
- Pond S.L.K., Muse S.V. HyPhy: hypothesis testing using phylogenies. Stat. Methods Mol. Evol. 2005;21:676–679. doi: 10.1093/bioinformatics/bti079. [DOI] [PubMed] [Google Scholar]
- Pye R.J., Pemberton D., Tovar C., Tubio J.M.C., Dunn K.A., Fox S., Darby J., Hayes D., Knowles G.W., Kreiss A., et al. A second transmissible cancer in Tasmanian devils. Proc. Natl. Acad. Sci. 2016;113:374–379. doi: 10.1073/pnas.1519691113. [DOI] [PMC free article] [PubMed] [Google Scholar]
- Quinlan A.R., Hall I.M. BEDTools: a flexible suite of utilities for comparing genomic features. Bioinformatics. 2010;26:841–842. doi: 10.1093/bioinformatics/btq033. [DOI] [PMC free article] [PubMed] [Google Scholar]
- R Core Team . R Foundation for Statistical Computing; 2020. R: A Language and Environment for Statistical Computing. [Google Scholar]
- Raj A., Stephens M., Pritchard J.K. fastSTRUCTURE: variational inference of population structure in large SNP data sets. Genetics. 2014;197:573–589. doi: 10.1534/genetics.114.164350. [DOI] [PMC free article] [PubMed] [Google Scholar]
- Rogers T., Fox S., Pemberton D., Wise P. Sympathy for the devil: captive-management style did not influence survival, body-mass change or diet of Tasmanian devils 1 year after wild release. Wildl. Res. 2016;43:544–552. [Google Scholar]
- Russell R.E., Thogmartin W.E., Erickson R.A., Szymanski J., Tinsley K. Estimating the short-term recovery potential of little brown bats in the eastern United States in the face of White-nose syndrome. Ecol. Model. 2015;314:111–117. [Google Scholar]
- Sambrook J., Russell D.W. Purification of nucleic acids by extraction with phenol:chloroform. Cold Spring Harb. Protoc. 2006;1 doi: 10.1101/pdb.prot4455. pdb-prot4455. [DOI] [PubMed] [Google Scholar]
- Sansaloni C.P., Petroli C.D., Carling J., Hudson C.J., Steane D.A., Myburg A.A., Grattapaglia D., Vaillancourt R.E., Kilian A. A high-density Diversity Arrays Technology (DArT) microarray for genome-wide genotyping in Eucalyptus. Plant Methods. 2010;6:1–11. doi: 10.1186/1746-4811-6-16. [DOI] [PMC free article] [PubMed] [Google Scholar]
- Schierup M.H., Vekemans X., Charlesworth D. The effect of subdivision on variation at multi-allelic loci under balancing selection. For. Genet. 2000;76:51–62. doi: 10.1017/s0016672300004535. [DOI] [PubMed] [Google Scholar]
- Siddle H.V., Kreiss A., Eldridge M.D., Noonan E., Clarke C.J., Pyecroft S., Woods G.M., Belov K. Transmission of a fatal clonal tumor by biting occurs due to depleted MHC diversity in a threatened carnivorous marsupial. Proc. Natl. Acad. Sci. 2007;104:16221–16226. doi: 10.1073/pnas.0704580104. [DOI] [PMC free article] [PubMed] [Google Scholar]
- Siddle H.V., Kreiss A., Tovar C., Yuen C.K., Cheng Y., Belov K., Swift K., Pearse A.-M., Hamede R., Jones M.E., et al. Reversible epigenetic down-regulation of MHC molecules by devil facial tumour disease illustrates immune escape by a contagious cancer. Proc. Natl. Acad. Sci. 2013;110:5103–5108. doi: 10.1073/pnas.1219920110. [DOI] [PMC free article] [PubMed] [Google Scholar]
- Srb C. Healesville Sanctuary on behalf of the Zoo and Aquarium Association; 2020. Tasmanian devil Studbook. Healesville, Australia. [Google Scholar]
- Stephens M., Donnelly P. A comparison of bayesian methods for haplotype reconstruction from population genotype data. Am. J. Hum. Genet. 2003;73:1162–1169. doi: 10.1086/379378. [DOI] [PMC free article] [PubMed] [Google Scholar]
- Stephens M., Scheet P. Accounting for decay of linkage disequilibrium in haplotype inference and missing-data imputation. Am. J. Hum. Genet. 2005;76:449–462. doi: 10.1086/428594. [DOI] [PMC free article] [PubMed] [Google Scholar]
- Stephens M., Smith N.J., Donnelly P. A new statistical method for haplotype reconstruction from population data. Am. J. Hum. Genet. 2001;68:978–989. doi: 10.1086/319501. [DOI] [PMC free article] [PubMed] [Google Scholar]
- Storfer A., Epstein B., Jones M., Micheletti S., Spear S.F., Lachish S., Fox S. Landscape genetics of the Tasmanian devil: implications for spread of an infectious cancer. Conserv. Genet. 2017;18:1287–1297. [Google Scholar]
- Teixeira J.C., Huber C.D. The inflated significance of neutral genetic diversity in conservation genetics. Proc. Natl. Acad. Sci. 2021;118 doi: 10.1073/pnas.2015096118. e2015096118. [DOI] [PMC free article] [PubMed] [Google Scholar]
- Thalmann S., Peck S., Wise P., Potts J.M., Clarke J., Richley J. Translocation of a top-order carnivore: tracking the initial survival, spatial movement, home-range establishment and habitat use of Tasmanian devils on Maria Island. Aust. Mammal. 2016;38:68–79. [Google Scholar]
- Van Rooij P., Martel A., Haesebrouck F., Pasmans F. Amphibian chytridiomycosis: a review with focus on fungus-host interactions. Vet. Res. 2015;46:1–22. doi: 10.1186/s13567-015-0266-0. [DOI] [PMC free article] [PubMed] [Google Scholar]
- Waples R.S. A bias correction for estimates of effective population size based on linkage disequilibrium at unlinked gene loci. Conserv. Genet. 2006;7:167–184. [Google Scholar]
- Weeks A.R., Stoklosa J., Hoffmann A.A. Conservation of genetic uniqueness of populations may increase extinction likelihood of endangered species: the case of Australian mammals. Front. Zool. 2016;13:1–9. doi: 10.1186/s12983-016-0163-z. [DOI] [PMC free article] [PubMed] [Google Scholar]
- Wise P., Peck S., Clarke J., Hogg C.J. In: Saving the Tasmanian Devil: recovery through science based management. Hogg C.J., Fox S., Pemberton D., Belov K., editors. CSIRO Publishing; 2019. Conservation introduction of Tasmanian devils to Maria Island: a managed response to DFTD; pp. 207–220. [Google Scholar]
- Wright B., Farquharson K.A., McLennan E.A., Belov K., Hogg C.J., Grueber C.E. From reference genomes to population genomics: comparing three reference-aligned reduced-representation sequencing pipelines in two wildlife species. BMC Genom. 2019;20:1–10. doi: 10.1186/s12864-019-5806-y. [DOI] [PMC free article] [PubMed] [Google Scholar]
- Wright B., Willet C.E., Hamede R., Jones M., Belov K., Wade C.M. Variants in the host genome may inhibit tumour growth in devil facial tumours: evidence from genome-wide association. Sci. Rep. 2017;7:1–6. doi: 10.1038/s41598-017-00439-7. [DOI] [PMC free article] [PubMed] [Google Scholar]
- Wright B.R., Farquharson K.A., McLennan E.A., Belov K., Hogg C.J., Grueber C.E. A demonstration of conservation genomics for threatened species management. Mol. Ecol. Resour. 2020;20:1526–1541. doi: 10.1111/1755-0998.13211. [DOI] [PubMed] [Google Scholar]
- Wright D.J., Spurgin L.G., Collar N.J., Komdeur J., Burke T., Richardson D.S. The impact of translocations on neutral and functional genetic diversity within and among populations of the Seychelles warbler. Mol. Ecol. 2014;23:2165–2177. doi: 10.1111/mec.12740. [DOI] [PMC free article] [PubMed] [Google Scholar]
- Zheng X., Levine D., Shen J., Gogarten S.M., Laurie C., Weir B.S. A high-performance computing toolset for relatedness and principal component analysis of SNP data. Bioinformatics. 2012;28:3326–3328. doi: 10.1093/bioinformatics/bts606. [DOI] [PMC free article] [PubMed] [Google Scholar]
- Zhou X., Wang J.L., Lu J., Song Y., Kwak K.S., Jiao Q., Rosenfeld R., Chen Q., Boone T., Simonet W.S. Reversal of cancer cachexia and muscle wasting by ActRIIB antagonism leads to prolonged survival. Cell. 2010;142:531–543. doi: 10.1016/j.cell.2010.07.011. [DOI] [PubMed] [Google Scholar]
Associated Data
This section collects any data citations, data availability statements, or supplementary materials included in this article.
Supplementary Materials
Data Availability Statement
-
•
DArTseq and target capture genotypes, including the custom target capture probes, have been deposited onto Dryad (https://doi.org/10.5061/dryad.2bvq83bsm).
-
•
Original code is available from the lead contact upon request.
-
•
Any additional information required to reanalyze the data reported in this paper is available from the lead contact upon request.