

Key Points
Question
How did diet quality and cardiometabolic risk factors of Korean adults change from 2007 to 2018?
Findings
In this cross-sectional analysis of nationally representative data from 65 416 Korean adults from 2007 to 2018, diet quality modestly improved; however, diet quality varied by age and birth cohorts, showing poor diets in younger adults and more recent birth cohorts. Similarly, more recent cohorts had more unfavorable cardiometabolic risk factor profiles.
Meaning
The findings of this study suggest that more intense interventions are needed to target younger generations to improve diet quality.
Abstract
Importance
Few studies have examined the dietary trends in Korea beyond evaluating selected food groups. To help prevent cardiometabolic disease burdens, a comprehensive investigation of the trends in overall diet quality and identification of possible contributing factors would be useful.
Objective
To investigate the trends and independent associations of age, period, and birth cohort with diet quality and cardiometabolic risk factors among Korean adults.
Design, Setting, and Participants
Serial cross-sectional and age-period-cohort analyses were conducted of nationally representative 24-hour dietary recall data from the Korea National Health and Nutrition Examination Survey 2007-2018. The study population included 65 416 Korean adults aged 19 to 79 years. Data analyses were conducted from March 1, 2020, through April 30, 2021.
Exposures
Age, calendar year, birth cohort, and population sociodemographic characteristics.
Main Outcomes and Measures
Korean Healthy Eating Index (KHEI), a validated diet quality score (range, 0-90, with higher scores indicating greater diet quality), and 8 cardiometabolic risk factors (waist circumference and systolic blood pressure, diastolic blood pressure, serum total cholesterol, low-density lipoprotein cholesterol, high-density lipoprotein cholesterol, triglyceride, and fasting blood glucose levels).
Results
Among 65 416 participants, mean age (SD) was 44.5 (0.1) years and 36 631 were women (55.8%). In 2007-2018, the age-standardized mean (SE) KHEI score increased from 51.0 (0.4) to 52.1 (0.5), which was associated with reduced sodium intake and increased whole grain, dairy, and protein-rich food intakes. The mean (SE) KHEI score was lowest at age 39 years (50.1 [0.3]) and increased at older ages (58.0 [0.3] at 79 years). Controlling for age and period effects, the highest KHEI score was observed among the birth cohorts of 1960-1964 (53.6 [0.9]) and decreased in subsequent cohorts (45.5 [1.2] in the 1990-1999 birth cohort). Similar cohort effects in cardiometabolic risk factors were observed, showing the lowest waist circumference, blood pressure, and total cholesterol levels among the birth cohorts of the 1960s and 1970s and higher levels among more recent birth cohorts (1990-1999 vs 1960-1964: waist circumference, 83.8 [0.5] vs 81.4 [0.4] cm; systolic blood pressure, 118.7 [0.7] vs 116.4 [0.4] mm Hg; total cholesterol, 200.2 [0.9] vs 198.9 [0.7] mg/dL). At most ages, periods, and birth cohorts, the mean KHEI score was consistently higher in adults living in urban areas (at age 45 years: 50.5 [1.0] vs 49.7 [0.9] rural) and among high-income (at age 45 years: 50.7 [1.1] vs 49.3 [0.9] low income) and educational levels (at age 45 years: 53.1 [0.9] vs 49.1 [1.0] low educational level).
Conclusions and Relevance
The findings of this study suggest that, from 2007 to 2018, the diet quality of Korean adults modestly improved. Despite the improvement, inequalities in diet among age, birth cohort, and socioeconomic subgroups persisted, suggesting that more intense interventions may be needed to target the susceptible groups.
This cross-sectional study examines changes in the quality of diet in Korean adults from 2007 to 2018.
Introduction
Poor diet is an important risk factor for various noncommunicable diseases, including cardiovascular disease,1 diabetes,2 and cancer.3 Dietary risk factors, such as high intake of sodium and low intake of whole grains and fruits, substantially contribute to the global burden of noncommunicable diseases,4 accounting for more than 50% of deaths worldwide.5 To help prevent further increases in disease burdens, a comprehensive investigation of the trends in diet and identification of factors associated with the changes are needed.
In many countries, economic growth and social changes catalyzed the shift in dietary intakes at the population level.6 South Korea (Korea hereafter) is among the countries that have undergone the most rapid economic growth and social changes during the past several decades. After the Korean War in 1950-1953, food shortage and undernutrition were major public health problems in Korea. In the 1970s, economic growth and industrialization expanded the food supply, leading to improved nutrition.7 The hosting of the Seoul Olympics in 1988 and the Uruguay round of the General Agreement on Tariffs and Trade in 1994 accelerated the globalization and introduction of the Western diet.8,9 Since the 1980s, the production and accessibility of processed foods and fast food have dramatically increased. The number of fast-food restaurants increased by approximately a thousand times between 1980 and 2003.10,11 Consequently, the dietary intake of the Korean population has changed over time. However, to our knowledge, few studies have investigated the trends in overall diet quality among Korean adults, beyond evaluating consumptions of individual food groups.9,12 Because overall diet quality, rather than consumption of individual food groups, better reflects overall health,13 understanding the nationwide trends in diet quality may provide important evidence for effective strategies and priorities to reduce related disease burdens. Furthermore, the rapid changes in the food environment in Korea have created the unique experience of birth cohorts. For example, younger birth cohorts (eg, birth cohorts from 1980 and thereafter) have been exposed to the Western diet from their early childhood, which is a sensitive period for food preference and dietary habit development, whereas some older birth cohorts were not exposed until their late adulthood (Figure 1). Given the younger age at exposure to the Western diet, younger birth cohorts are likely to have more easily adopted the diet (ie, birth cohort effect). However, it is unknown whether any changes in diet quality among Korean adults can be explained by the differences among birth cohorts independently of the differences owing to age and period effects.
Figure 1. Experience of Birth Cohorts in the Context of Economic Development and Social Changes in South Korea.

In this study, we used large, nationally representative survey data to examine the trends in diet quality among Korean adults in 2007-2018. We used a validated diet quality index, the Korean Healthy Eating Index (KHEI), which indicates the overall adherence to recommended dietary guidelines. We performed the age-period-cohort (APC) analyses of the KHEI to comprehensively investigate the independent associations of age, period, and birth cohort. We also examined whether the age, period, and cohort effects associated with the KHEI varied by socioeconomic subgroups, contributing to inequalities in diet. In addition, because changes in diet may influence the trends in cardiometabolic health, we investigated the trends in cardiometabolic risk factors (waist circumference and blood pressure, serum cholesterol, triglyceride, and fasting blood glucose levels) and compared the findings with the results from the KHEI.
Methods
Study Population
This cross-sectional study included data from the Korea National Health and Nutrition Examination Survey (KNHANES) 2007-2018. The KNHANES is a national cross-sectional survey, which is annually conducted by the Korea Disease Control and Prevention Agency for the public interest.14 A multistage clustered probability design was used to select the sample units based on sex, age, and geographic regions. The KNHANES has been conducted annually since 2007, collecting comparable data using similar designs and sampling methods. During the health interview, information on demographic characteristics and health behaviors was collected. During the health examination, trained medical personnel performed anthropometric and biochemical measurements following standardized protocols. One week after the health interview and examination, dietitians visited homes and conducted a nutrition survey. Written informed consent was obtained from all participants before their enrollment in the survey, and they received a modest financial reward. All procedures were approved by the institutional review board of the Korea Disease Control and Prevention Agency and Korea University. This study followed the Strengthening the Reporting of Observational Studies in Epidemiology (STROBE) reporting guideline for cross-sectional studies.
Among 72 629 KNHANES 2007-2018 participants aged 19 to 79 years, we excluded those with a history of cancer (n = 2617) or cardiovascular disease (n = 2715), women who were pregnant or lactating (n = 924), and individuals with implausible total energy intakes (<500 or >5000 kcal/d; n = 957), resulting in a total of 65 416 included in our analysis (eTable 1 in the Supplement). For cardiometabolic analysis, we further excluded participants who were receiving treatment for hypertension, diabetes, or hypercholesterolemia for a total of 52 149 participants.
Diet Quality Assessment
All dietary data were obtained from a single-day 24-hour dietary recall. To assess the overall diet quality, we used the KHEI, which was developed and validated by the Korea Disease Control and Prevention Agency in the KNHANES 2013-2015.15 Based on the national dietary guidelines for Korean adults,16 the KHEI includes 13 component scores from 8 healthy dietary factors (breakfast intake; whole grains; total fruits; fresh fruits; total vegetables; fresh vegetables; protein-rich foods, including meat, fish, eggs, and legumes; and dairy), 2 unhealthy dietary factors (sodium and energy from sweets and beverage intake), and 3 energy intakes (total energy intake, energy intake from carbohydrates, and energy intake from fat) (detailed scoring scheme in eTable 2 in the Supplement). In our study, saturated fat intake was not included because the information on different fat subtypes was available only after 2013. The standards for minimum and maximum scores were determined based on the intakes recommended by the Dietary Reference Intakes for Koreans 2015 and the World Health Organization.16 For some dietary factors (sodium, total energy intake, energy intake from carbohydrates and fat), the intake levels corresponding to the 15th and 85th percentiles were referenced from the national distributions. The KHEI score (range, 0-90) was calculated by summing the scores from all 13 components. Based on the participant distributions, we categorized the summed score into 3 groups: low (KHEI ≤45, lowest quartile), moderate (KHEI 46-60, middle quartiles), and high (KHEI ≥61, highest quartile). In our study population, high vs low KHEI was associated with lower waist circumference; systolic blood pressure, diastolic blood pressure, and triglyceride levels; and mortality (all-cause and cardiovascular specific) (all P ≤ .003 for trend) (eMethods and eTable 3 in the Supplement), confirming the validity of the KHEI.
Cardiometabolic Risk Factors
Waist circumference was measured to the nearest 0.1 cm in a horizontal plane at the midpoint between the inferior edge of the costal border and the iliac crest. Blood pressure was measured using a standard mercury sphygmomanometer (Baumanometer; W. A. Baum) with the participants in a sitting position after they had rested for at least 5 minutes. Blood pressure was measured on 3 separate occasions at 5-minute intervals and calculated as the mean of the second and third measurements. Blood samples were collected from participants who had fasted for at least 8 hours. Plasma levels of fasting blood glucose and serum levels of total cholesterol, low-density lipoprotein cholesterol, high-density lipoprotein cholesterol, and triglycerides were quantified using an autoanalyzer (Hitachi Automatic Analyzer 7600-210, Hitachi Ltd) and enzyme technique.
Statistical Analysis
Data analyses were conducted from March 1, 2020, through April 30, 2021. All analyses accounted for complex sampling design using sampling weights. We first examined the overall trends in KHEI scores in 2007-2018. We estimated the age-standardized mean KHEI scores, as well as age-standardized prevalence of KHEI groups, in each survey year from 2007 to 2018, using the 2005 Korean Census population as the reference population. We also performed linear regression on the KHEI to estimate β coefficients indicating the change in KHEI score per 1-year increment in survey year, adjusting for age. We also estimated the trends separately by sex and age groups (10-year intervals) with a trend test in a linear regression model. We then performed APC analyses to estimate the independent associations of age, period, and cohort with the KHEI scores and cardiometabolic risk factors (waist circumference and systolic blood pressure, diastolic blood pressure, total cholesterol, low-density lipoprotein cholesterol, high-density lipoprotein cholesterol, triglyceride, and fasting blood glucose levels). The age effect refers to the biological and social processes of aging. The period effect results from external factors or events (eg, war, economic crisis) that equally affect all age groups at a particular calendar time. Cohort effect refers to the differences based on the year of birth, particularly when an exposure affects age groups differently. We performed hierarchical APC cross-classified random-effects models to overcome the identifiability problem by not assuming linear dependency between age, period, and cohort at the same level of analysis.17 In the hierarchical APC cross-classified random-effects models, age and its quadratic term were modeled as fixed effects at level 1, but periods and birth cohorts were modeled as random effects at level 2.18 Age variable was centered around the population mean. Period variables indicated 1-year intervals of survey year from 2007 to 2018. Birth cohorts were grouped into 5-year intervals, except for extreme birth cohorts with small numbers. Based on the APC models, we estimated the mean KHEI score for each age, period, and birth cohort. To investigate whether age, period, and cohort effects with the KHEI score varied across different socioeconomic subgroups, we repeated APC analysis after stratification by region (urban vs rural), household income (above vs below median), and educational level (college or higher vs high school or lower). In sensitivity analysis, we assessed the robustness of our results after adding saturated fat score into the KHEI scoring scheme (range, 0-100) in the KNHANES 2013-2018, which is the only time that fat subtype information was available.
All statistical tests were 2-sided, with an α level of .05. All APC analyses were performed using SAS, version 9.4 (SAS Institute Inc). All other analyses were performed using Stata/SE, version 13.0 (StataCorp LLC).
Results
Overall Trends in KHEI
Among 65 416 participants who were included in the study, the mean (SD) age was 44.5 (0.1) years; 28 885 participants were men (44.2%) and 36 631 were women (55.8%) (eTable 1 in the Supplement).
The age-standardized mean (SE) KHEI score increased slightly from 51.0 (0.4) (49.8 [0.5] men, 52.3 [0.5] women) in 2007 to 52.1 (0.5) (51.0 [0.7] men, 53.2 [0.5] women) in 2018 (P < .001 for trend) (Figure 2A). Similarly, the age-standardized prevalence of high KHEI scores (KHEI >60) increased from 23.8% to 32.4%, while the prevalence decreased for low (KHEI ≤45, from 31.5% to 28.3%) and moderate (KHEI 46-60, from 44.7% to 39.4%) KHEI scores (Figure 2B). Although the overall trends were similar between men and women, the mean KHEI score was consistently higher in women (Figure 2A). Among both men and women, the trends varied by age (Figure 2C for men, Figure 2D for women). In 2007-2018, the age-specific mean KHEI score increased in older adults (age ≥50 years: 58.0 [0.3] at age 79 years), whereas it decreased in younger adults (age 19-29 years: 50.6 [0.3] at age 29 years). The gaps between the age groups became more apparent after 2014 and widened over time. The diverging trends by age groups were found in some (intake of fruits and vegetables and energy intake from carbohydrates and dietary fat) component scores (eFigure 1 in the Supplement).
Figure 2. Age-Standardized Mean Korean Healthy Eating Index (KHEI) Scores and Prevalence of KHEI Groups Among Korean Adults in 2007-2018.
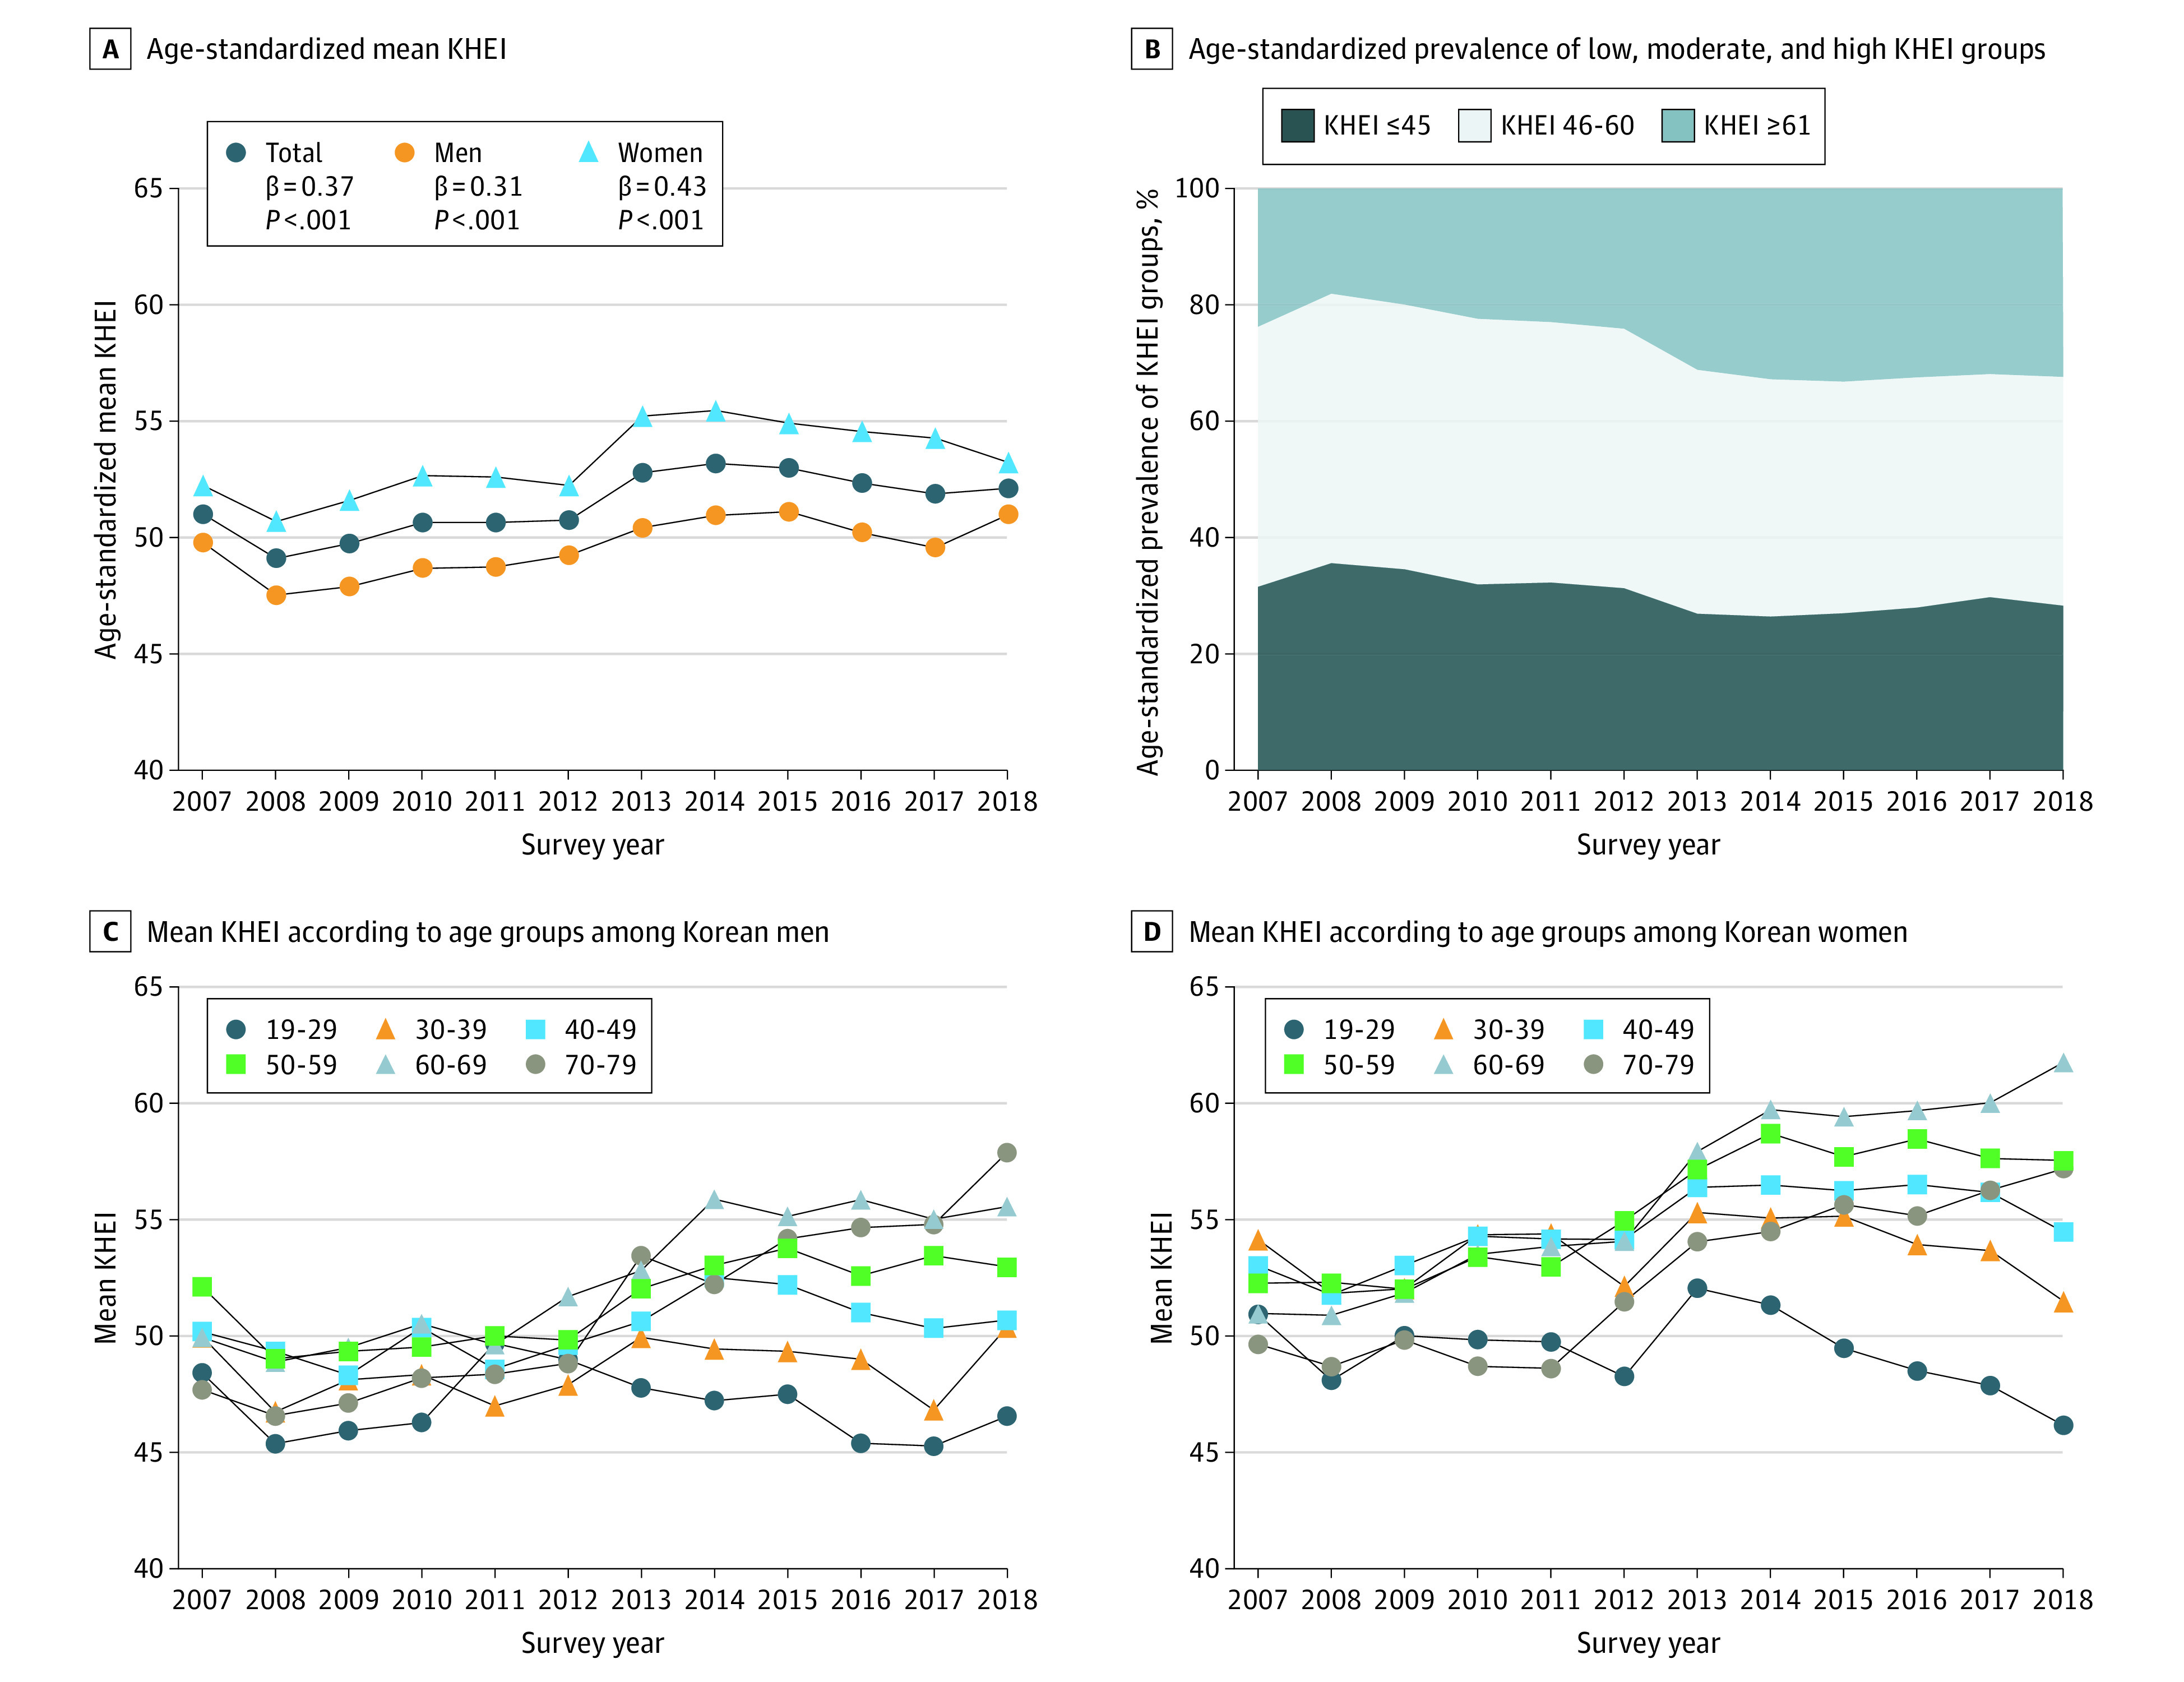
β coefficient and P value trends were estimated per 1-year increments in survey years using linear regression models adjusted for age.
Age, Period, and Cohort Effects in KHEI
The results from the APC analyses of the KHEI are presented in Figure 3 and eTable 4 in the Supplement. Controlling for period and cohort effects, we found a nonlinear age effect associated with the KHEI score (Figure 3A). The estimated mean (SE) KHEI score was lowest at age 39 years (50.1 [0.3]) and increased at points above and below this age. The highest KHEI score was observed at age 79 years (58.0 [0.3]). Controlling for age and cohort, the estimated mean KHEI score increased slightly from 2007 to 2018 (Figure 3B). Controlling for age and period, we noted an inverted U-shaped cohort effect, with the peak occurring at the birth cohort of 1960-1964 (mean [SE] KHEI score, 53.6 [0.9]) (Figure 3C). The lowest mean KHEI scores were observed among the birth cohorts of 1919-1939 (45.3 [1.2]) and 1990-1999 (45.5 [1.2]). Similar results were found for men and women. In the KNHANES 2013-2018, similar patterns were observed when the saturated fat score was included in the KHEI scoring scheme (eFigure 2 in the Supplement).
Figure 3. Estimated Mean Korean Healthy Eating Index (KHEI) Scores Among Korean Adults.

Mean KHEI scores estimated from hierarchical age-period-cohort models using data from the Korea National Health and Nutrition Examination Survey 2007-2018.
The results from APC analyses by component scores are presented in eFigures 3, 4, and 5 in the Supplement. Although most component scores increased with age, the scores for protein-rich foods, dairy products, and energy intake from carbohydrates and fat decreased with age, indicating changes toward unhealthy consumptions of these food groups in older adults (eFigure 3 in the Supplement). From 2007 to 2018, component scores for intake of whole grains, protein-rich foods, dairy, sodium, and energy from fat increased, whereas those for eating breakfast, vegetables, and sweets and beverages decreased (eFigure 4 in the Supplement). The inverted U-shaped cohort effects were observed for whole grains, fruits, vegetables, and energy intake from carbohydrate and fat but not for other components (eFigure 5 in the Supplement).
At most ages, periods, and birth cohorts, the estimated mean KHEI score was consistently higher in populations living in urban vs rural regions (at age 45 years: 50.5 [1.0] vs 49.7 [0.9]) and those with high vs low income (at age 45 years: 50.7 [1.1] vs 49.3 [0.9]) and college or higher vs high school or lower educational levels (at age 45 years: 53.1 [0.9] vs 49.1 [1.0]) (Figure 4). Among adults older than 40 years, age effect was also more pronounced among populations living in urban regions and those with high income and educational levels, leading to widening of between-group differences at older ages. The overall period effect was consistently found in all subgroups, but the gap between high- vs low-income groups narrowed over time (mean [SE] KHEI score, 50.6 [0.5] vs 47.9 [0.7] in 2007; 51.2 [0.5] vs 51.5 [0.7] in 2018), whereas the gap between educational level groups persisted throughout the study period. The regional and income differences in KHEI scores were most prominent among the birth cohorts of the 1950s to 1970s and decreased in the subsequent cohorts. However, differences in KHEI scores between the educational level subgroups became more apparent among more recent birth cohorts.
Figure 4. Estimated Mean Korean Healthy Eating Index (KHEI) Scores by Age, Survey Year, and Birth Cohort.

Mean KHEI scores by age, survey year, and birth cohort that were estimated from hierarchical age-period-cohort models using data from the Korea National Health and Nutrition Examination Survey 2007-2018.
Cohort Effects and Cardiometabolic Risk Factors
We observed U-shaped cohort effects, shown as mean (SE) in the 1990-1999 vs 1960-1964 birth cohorts, associated with waist circumference (83.8 [0.5] vs 81.4 [0.4] cm), systolic blood pressure (118.7 [0.7] vs 116.4 [0.4] mm Hg), and total cholesterol levels (200.2 [0.9] vs 198.9 [0.7] mg/dL [to convert to millimoles per liter, multiply by 0.0259]), with the nadir occurring at the birth cohorts of the 1960s to 1970s (Figure 5; eTable 5 in the Supplement). There was no cohort effect associated with high-density lipoprotein cholesterol, triglyceride, and fasting blood glucose levels among both men and women.
Figure 5. Cohort Associations of Cardiometabolic Risk Factors Among Korean Adults Not Receiving Treatment for Hypertension, Diabetes, or Hypercholesterolemia.
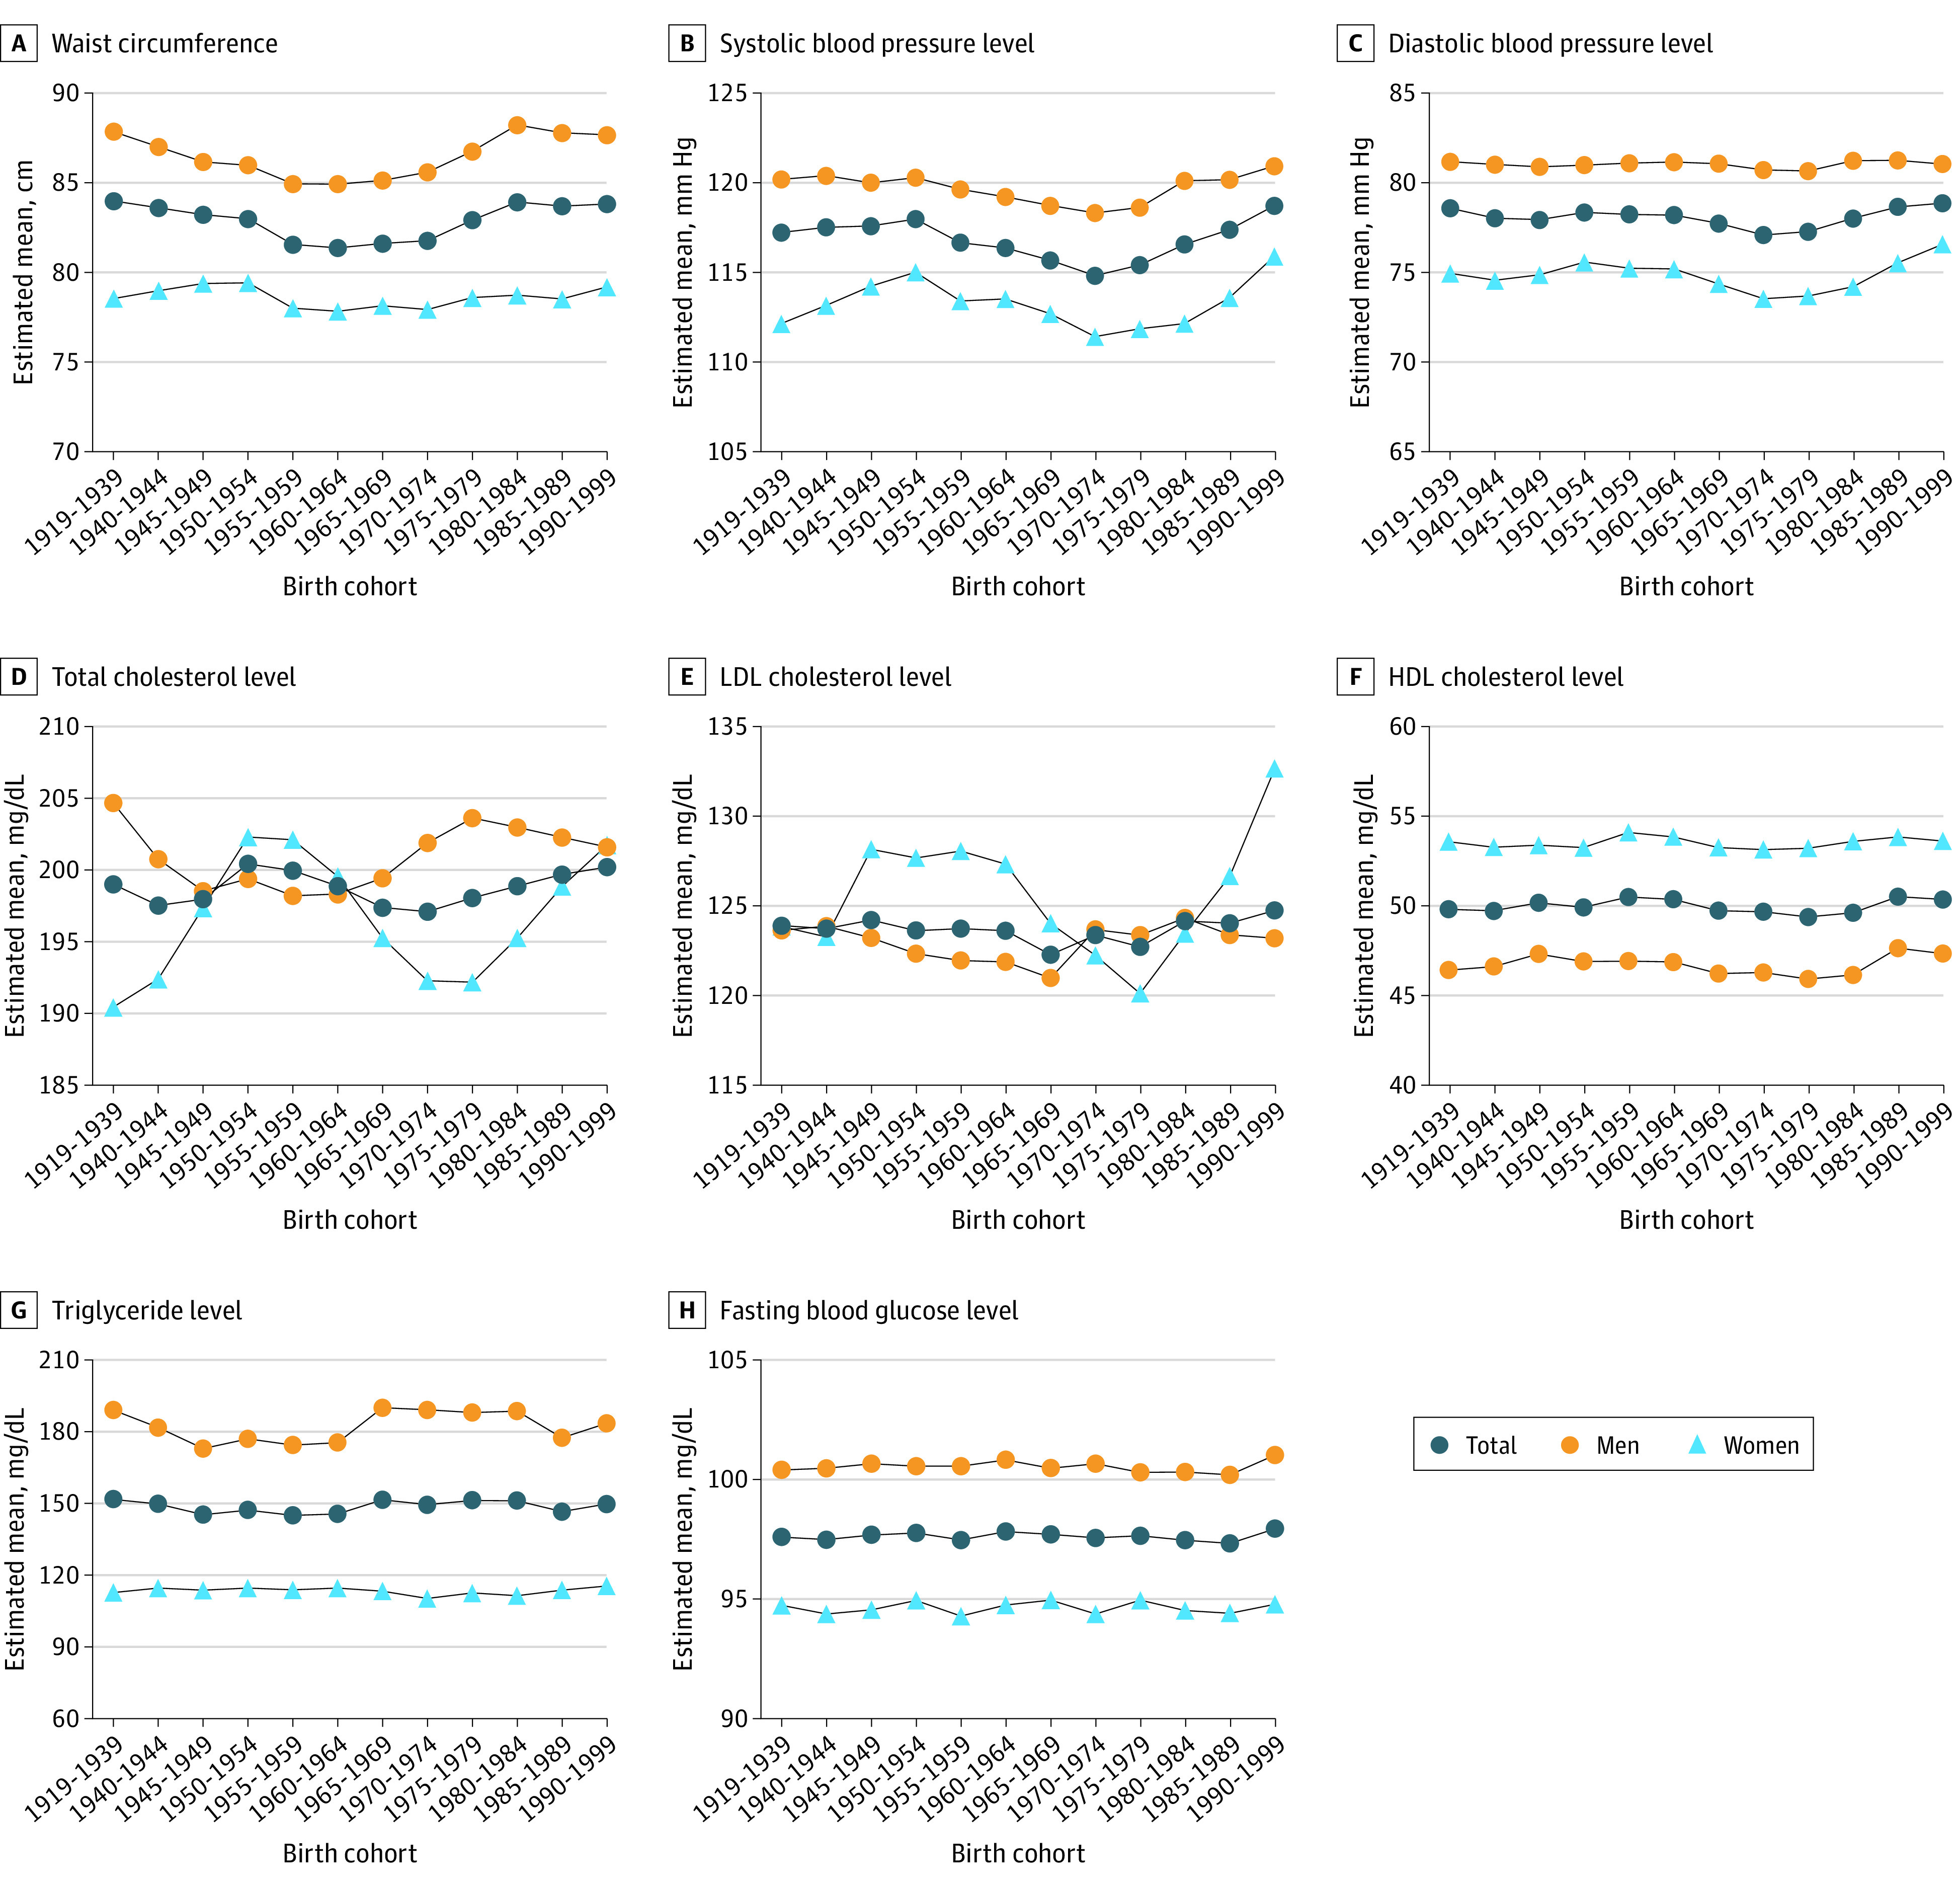
SI conversion factors: To convert total cholesterol, HDL, and LDL values from milligrams per deciliter to millimoles per liter, multiply by 0.0259; to convert triglycerides from milligrams per deciliter to millimoles per liter, multiply by 0.0113; and to convert glucose from milligrams per deciliter to millimoles per liter, multiply by 0.0555. HDL indicates high-density lipoprotein; LDL, low-density lipoprotein.
Discussion
Using nationally representative data from 2007 to 2018, this study investigated the nationwide trends in diet quality and identified the independent association of age, period, and cohort that appeared to contribute to the overall trends among Korean adults. During the study period, we observed a modest improvement in overall diet quality. However, diet quality varied by age and birth cohort. Younger adults and more recent birth cohorts tended to have poor diets. Similarly, more recent birth cohorts had more unfavorable cardiometabolic risk factor profiles (higher waist circumference, blood pressure, and serum total cholesterol level). Furthermore, diet quality was generally better in adults living in urban regions and those with high income and educational levels.
Although previous studies evaluated the trends in intakes of individual food groups,12 our study focused on overall diet quality using the KHEI. In our APC analysis, the positive period effect observed with the KHEI was shown to be independent of age and cohort effect, suggesting a general improvement in diet quality over time at all ages and birth cohorts. The improvement in diet quality was associated with the increased intake of whole grains, dairy products, and protein-rich foods and decreased intake of sodium. A previous study reported similar increasing changes in meat and dairy intake in 1998 to 2008,12 suggesting that the increasing consumption of these food groups started earlier than noted in our study. Our findings of increased whole grain intake and little change in energy intake from carbohydrates also suggest that Korean adults are likely to have changed the sources of carbohydrates to whole grains, leading to better carbohydrate quality. The reduced intake of white rice, as well as the increased intake of brown and mixed rice, have been reported since 1998.19,20 White rice makes up a large part of the traditional Korean diet and was once believed to be a measurement of wealth.21,22,23 However, with increased knowledge and awareness in health and nutrition, the perception has shifted to acknowledge the health benefits of substituting white rice with brown and mixed rice. The continuous growth of the economy and food industry may have also contributed to the increased accessibility to diverse food options, increasing opportunities to practice a healthy diet. Furthermore, the decreased intake of sodium suggests that the national nutrition policies in sodium reduction have been successful. Responding to high sodium intake reported since 1990,24 the Korean government has implemented an increasing number of sodium reduction policies25 that encouraged the food industry to voluntarily reformulate their products and required packaged foods to carry nutrition labels with the information on sodium content.25 Consistent with our findings, a previous study reported a reduction in sodium intake from 5550 mg/d in 2001 to 3647 mg/d in 2016.26 Despite this achievement, sodium intake remains above the level recommend by the World Health Organization (<2000 mg/d); thus, continuous actions are needed for further reduction. In the present study, we also observed some unfavorable changes in diet, particularly decreased intake of vegetables and increased intake of sweets and beverages, suggesting that there are remaining targets for dietary improvement in Korea. The increased intake of meat and dairy products and decreased vegetable intake also suggest that the dietary pattern in Korea has shifted from the traditional plant-based diet.
Cross-sectionally comparing across age groups, we observed healthier diets among older adults. At a given year, the difference in mean KHEI scores between the age groups may reflect the combined associations between age and birth cohort in diet quality. Our APC analysis suggested that diet quality improves with age, particularly after the age of 40 years. Among older adults, the age-related concerns for health may motivate them to practice a healthy diet.27,28 In the present study, older adults were more likely to eat whole grains, fruits, and vegetables, and less likely to eat sweets and beverages and sodium. To date, most national nutrition policies have primarily focused on children and older populations and rarely on younger adults,29 possibly further contributing to the age differences in diet quality. Further studies are needed to investigate the barriers to healthy eating in younger adults, and more intense nutrition policies and interventions are needed to target these age groups.
From 2007 to 2018, the age-specific mean KHEI score increased in older age groups and decreased in younger age groups. Owing to these diverging trends, only a small change in diet quality was observed among the overall population since 2014, during which the gaps became more prominent. Our findings of diverging trends also support the presence of cohort effect associated with diet quality, as the age-specific trend lines should be parallel across calendar time in the absence of cohort effect. In our APC analysis, we noted an inverted U-shaped cohort effect associated with diet quality, with the peak occurring in the birth cohort of the 1960s. This finding suggests that the economic and social changes in Korea did not equally influence birth cohorts and that the outcomes may vary depending on the age at exposure. The birth cohorts of the 1950s to 1970s (eg, those who were born after the Korean War in 1950-1953) are likely to have benefitted most from the economic growth and increased food accessibility, showing the healthiest diet. However, those who were born after the 1980s, the period of active globalization and introduction of fast-food chains and Western diet, have been exposed to the high-fat, animal-based food environment from their early life and thus may have easily adopted the unhealthy diet. Although both the oldest (1919-1939) and youngest (1990-1999) birth cohorts showed the lowest KHEI scores, we observed some differences in dietary patterns between the 2 cohorts. The oldest cohorts had a higher percentage of energy from carbohydrate intake and lower percentage of energy from fat (eg, high-carbohydrate, low-fat diet) intake. The major source of protein-rich foods was legumes in the oldest cohorts and meats in the youngest cohorts, suggesting the dietary transition toward the animal-based Western diet in the youngest cohorts. The dietary transition across generations (ie, birth cohorts) has rapidly occurred in Korea, possibly due to the dramatic socioeconomic development and globalization that took place within a short time. We observed similar cohort effects associated with cardiometabolic risk factors, suggesting that noncommunicable disease burdens are likely to increase in the near future and emphasizing the need for precision nutrition policies that acknowledge the life-course experience of birth cohorts.
In addition, lower socioeconomic level subgroups had unhealthier diets at all ages and calendar periods. These findings suggest that diet quality may be influenced by an individual’s accessibility to resources and knowledge, as well as the macro-level food and socioeconomic environments. Our data also suggest that the adverse exposures accumulate with age, leading to widening of gaps between the groups at older ages. Furthermore, although the income and regional differences in diet quality narrowed, the educational level differences persisted. The rapid economic development and expanded food supply may have reduced the income and regional differences in food accessibility. However, the knowledge gap may remain a factor in the inequalities noted in diet and health. Educational levels may also reflect an individual’s nutrition literacy, perceived relationship between diet and health, and other factors (eg, beliefs and attitudes about foods) that may influence healthy food choices.30 Further studies are needed to understand and identify useful strategies to lower socioeconomic inequalities in diet.
Limitations
This study has limitations. We used dietary data that were assessed with single-day 24-hour recall. Although a single-day assessment does not capture within-person variation in diet, it is likely to provide adequate data for estimating group means of a large population in the trend analysis. Furthermore, the KHEI scoring scheme did not distinguish between processed vs red vs white meat intake; thus, the increasing trend in intake of protein-rich foods may have been associated with the increased intake of processed and red meats.12 The KHEI scoring scheme also did not distinguish between healthy (eg, unsaturated fat) vs unhealthy (eg, saturated fat) fat subtypes. However, we noted the validity of KHEI scoring by showing higher mortality and unfavorable cardiometabolic profiles associated with lower KHEI scores. Therefore, low KHEI scores are likely to indicate a poor diet that impairs health. In sensitivity analysis, we also noted the robustness of our results after adding the saturated fat score into the KHEI scoring scheme in the KNHANES 2013-2018.
Conclusions
In this study, we observed a modest improvement in diet quality among Korean adults in 2007-2018 that was associated with reduced sodium intake and increased whole grain, dairy, and protein-rich food intake. Our data suggest that age, period, and cohort effects were independently associated with the overall trends in diet by noting poor diets among younger adults and more recent birth cohorts. To reduce noncommunicable disease burdens in Korea, more intense interventions may be needed to target the younger generations.
eMethods. Detailed Methods
eTable 1. Participant Characteristics of 65 416 Adults Included in the Trend Analysis of KHEI in the KNHANES 2007-2018
eTable 2. Dietary Components and Scoring Scheme for the Korean Healthy Eating Index
eTable 3. Associations of KHEI With Cardiometabolic Risk Factors and Mortality Among Korean Adults in the KNHANES 2007-2015
eTable 4. Results From APC Models of KHEI Among Korean Adults in the KNHANES 2007-2018
eTable 5. β Coefficients From APC Models of Cardiometabolic Risk Factors Among Korean Adults in the KNHANES 2007-2018
eFigure 1. Mean KHEI Component Scores by Age Groups
eFigure 2. Difference in the Estimated Mean KHEI Including vs Excluding Saturated Fat Score in 2013-2018
eFigure 3. Age Effects in KHEI Component Scores
eFigure 4. Period Effects in KHEI Component Scores
eFigure 5. Cohort Effects in KHEI Component Scores
References
- 1.Yusuf S, Joseph P, Rangarajan S, et al. Modifiable risk factors, cardiovascular disease, and mortality in 155 722 individuals from 21 high-income, middle-income, and low-income countries (PURE): a prospective cohort study. Lancet. 2020;395(10226):795-808. doi: 10.1016/S0140-6736(19)32008-2 [DOI] [PMC free article] [PubMed] [Google Scholar]
- 2.Khazrai YM, Defeudis G, Pozzilli P. Effect of diet on type 2 diabetes mellitus: a review. Diabetes Metab Res Rev. 2014;30(suppl 1):24-33. doi: 10.1002/dmrr.2515 [DOI] [PubMed] [Google Scholar]
- 3.Key TJ, Bradbury KE, Perez-Cornago A, Sinha R, Tsilidis KK, Tsugane S. Diet, nutrition, and cancer risk: what do we know and what is the way forward? BMJ. 2020;368:m511. doi: 10.1136/bmj.m511 [DOI] [PMC free article] [PubMed] [Google Scholar]
- 4.GBD 2017 Cirrhosis Collaborators . The global, regional, and national burden of cirrhosis by cause in 195 countries and territories, 1990-2017: a systematic analysis for the Global Burden of Disease Study 2017. Lancet Gastroenterol Hepatol. 2020;5(3):245-266. doi: 10.1016/S2468-1253(19)30349-8 [DOI] [PMC free article] [PubMed] [Google Scholar]
- 5.GBD 2017 Diet Collaborators . Health effects of dietary risks in 195 countries, 1990-2017: a systematic analysis for the Global Burden of Disease Study 2017. Lancet. 2019;393(10184):1958-1972. doi: 10.1016/S0140-6736(19)30041-8 [DOI] [PMC free article] [PubMed] [Google Scholar]
- 6.Baker P, Machado P, Santos T, et al. Ultra-processed foods and the nutrition transition: global, regional and national trends, food systems transformations and political economy drivers. Obes Rev. 2020;21(12):e13126. doi: 10.1111/obr.13126 [DOI] [PubMed] [Google Scholar]
- 7.Lee CH, Joo YJ, Ahn KO, Ryu SS. The changes in the dietary pattern and health and nutritional status of Korean During the last one century. J Korean Soc Food Culture. 1988;3(4):397-406. [Google Scholar]
- 8.Lee MJ, Popkin BM, Kim S. The unique aspects of the nutrition transition in South Korea: the retention of healthful elements in their traditional diet. Public Health Nutr. 2002;5(1A):197-203. doi: 10.1079/PHN2001294 [DOI] [PubMed] [Google Scholar]
- 9.Kim S, Moon S, Popkin BM. The nutrition transition in South Korea. Am J Clin Nutr. 2000;71(1):44-53. doi: 10.1093/ajcn/71.1.44 [DOI] [PubMed] [Google Scholar]
- 10.Han K-S, Seo K-M, Park H-N, Hong S-Y. Issues of Korean restaurant industry by content analysis of food yearly statistics. J Korean Soc Food Culture. 2004;19(3):313-325. [Google Scholar]
- 11.Han K-S, Seo K-M. The content analysis of the Korean restaurant market focused on Western restaurant brands. Int J Tourism Sci. 2004;4(2):41-57. doi: 10.1080/15980634.2004.11434571 [DOI] [Google Scholar]
- 12.Jo G, Oh H, Singh GM, Park D, Shin M-J. Impact of dietary risk factors on cardiometabolic and cancer mortality burden among Korean adults: results from nationally representative repeated cross-sectional surveys 1998-2016. Nutr Res Pract. 2020;14(4):384-400. doi: 10.4162/nrp.2020.14.4.384 [DOI] [PMC free article] [PubMed] [Google Scholar]
- 13.Tapsell LC, Neale EP, Satija A, Hu FB. Foods, nutrients, and dietary patterns: interconnections and implications for dietary guidelines. Adv Nutr. 2016;7(3):445-454. doi: 10.3945/an.115.011718 [DOI] [PMC free article] [PubMed] [Google Scholar]
- 14.Kweon S, Kim Y, Jang MJ, et al. Data resource profile: the Korea National Health and Nutrition Examination Survey (KNHANES). Int J Epidemiol. 2014;43(1):69-77. doi: 10.1093/ije/dyt228 [DOI] [PMC free article] [PubMed] [Google Scholar]
- 15.Yook SM, Park SH, Moon HK, Kim K, Shim J, Hwang JY. Development of Korean healthy eating index for adults using the Korea National Health and Nutrition Examination Survey data. J Nutr Health. 2015;48:419-429. doi: 10.4163/jnh.2015.48.5.419 [DOI] [PMC free article] [PubMed] [Google Scholar]
- 16.Ministry of Health and Welfare . Accessed March 1, 2020. http://www.mohw.go.kr/react/jb/sjb030301vw.jsp?PAR_MENU_ID=03&MENU_ID=032901&CONT_SEQ=337356&page=1
- 17.Reither EN, Hauser RM, Yang Y. Do birth cohorts matter? age-period-cohort analyses of the obesity epidemic in the United States. Soc Sci Med. 2009;69(10):1439-1448. doi: 10.1016/j.socscimed.2009.08.040 [DOI] [PMC free article] [PubMed] [Google Scholar]
- 18.Yang Y, Land KC. Age–period–cohort analysis of repeated cross-section surveys: fixed or random effects? Sociol Methods Res. 2008;36(3):297-326. doi: 10.1177/0049124106292360 [DOI] [Google Scholar]
- 19.Yun S, Kim HJ, Oh K. Trends in energy intake among Korean adults, 1998-2015: results from the Korea National Health and Nutrition Examination Survey. Nutr Res Pract. 2017;11(2):147-154. doi: 10.4162/nrp.2017.11.2.147 [DOI] [PMC free article] [PubMed] [Google Scholar]
- 20.Cha HM, Han G, Chung HJ. A study on the trend analysis regarding the rice consumption of Korean adults using Korean National Health and Nutrition Examination Survey data from 1998, 2001 and 2005. Nutr Res Pract. 2012;6(3):254-262. doi: 10.4162/nrp.2012.6.3.254 [DOI] [PMC free article] [PubMed] [Google Scholar]
- 21.Lee SK, Sobal J, Frongillo EA Jr. Acculturation and dietary practices among Korean Americans. J Am Diet Assoc. 1999;99(9):1084-1089. doi: 10.1016/S0002-8223(99)00258-8 [DOI] [PubMed] [Google Scholar]
- 22.Kim J, Jo I, Joung H. A rice-based traditional dietary pattern is associated with obesity in Korean adults. J Acad Nutr Diet. 2012;112(2):246-253. doi: 10.1016/j.jada.2011.10.005 [DOI] [PubMed] [Google Scholar]
- 23.Lee S-K, Sobal J. Socio-economic, dietary, activity, nutrition and body weight transitions in South Korea. Public Health Nutr. 2003;6(7):665-674. doi: 10.1079/PHN2003485 [DOI] [PubMed] [Google Scholar]
- 24.Powles J, Fahimi S, Micha R, et al. ; Global Burden of Diseases Nutrition and Chronic Diseases Expert Group (NutriCoDE) . Global, regional and national sodium intakes in 1990 and 2010: a systematic analysis of 24 h urinary sodium excretion and dietary surveys worldwide. BMJ Open. 2013;3(12):e003733. doi: 10.1136/bmjopen-2013-003733 [DOI] [PMC free article] [PubMed] [Google Scholar]
- 25.Park H-K, Lee Y, Kang B-W, et al. Progress on sodium reduction in South Korea. BMJ Glob Health. 2020;5(5):e002028. doi: 10.1136/bmjgh-2019-002028 [DOI] [PMC free article] [PubMed] [Google Scholar]
- 26.Park CY, Jo G, Lee J, Singh GM, Lee J-T, Shin M-J. Association between dietary sodium intake and disease burden and mortality in Koreans between 1998 and 2016: The Korea National Health and Nutrition Examination Survey. Nutr Res Pract. 2020;14(5):501-518. doi: 10.4162/nrp.2020.14.5.501 [DOI] [PMC free article] [PubMed] [Google Scholar]
- 27.Dijkstra SC, Neter JE, Brouwer IA, Huisman M, Visser M. Motivations to eat healthily in older Dutch adults—a cross sectional study. Int J Behav Nutr Phys Act. 2014;11(1):141. doi: 10.1186/s12966-014-0141-9 [DOI] [PMC free article] [PubMed] [Google Scholar]
- 28.Sun YH. Health concern, food choice motives, and attitudes toward healthy eating: the mediating role of food choice motives. Appetite. 2008;51(1):42-49. doi: 10.1016/j.appet.2007.11.004 [DOI] [PubMed] [Google Scholar]
- 29.Development Initiatives. Global Nutrition Report 2020. Accessed May 16, 2022. https://globalnutritionreport.org/reports/2020-global-nutrition-report/
- 30.Nestle M, Wing R, Birch L, et al. Behavioral and social influences on food choice. Nutr Rev. 1998;56(5, pt 2):S50-S64. doi: 10.1111/j.1753-4887.1998.tb01732.x [DOI] [PubMed] [Google Scholar]
Associated Data
This section collects any data citations, data availability statements, or supplementary materials included in this article.
Supplementary Materials
eMethods. Detailed Methods
eTable 1. Participant Characteristics of 65 416 Adults Included in the Trend Analysis of KHEI in the KNHANES 2007-2018
eTable 2. Dietary Components and Scoring Scheme for the Korean Healthy Eating Index
eTable 3. Associations of KHEI With Cardiometabolic Risk Factors and Mortality Among Korean Adults in the KNHANES 2007-2015
eTable 4. Results From APC Models of KHEI Among Korean Adults in the KNHANES 2007-2018
eTable 5. β Coefficients From APC Models of Cardiometabolic Risk Factors Among Korean Adults in the KNHANES 2007-2018
eFigure 1. Mean KHEI Component Scores by Age Groups
eFigure 2. Difference in the Estimated Mean KHEI Including vs Excluding Saturated Fat Score in 2013-2018
eFigure 3. Age Effects in KHEI Component Scores
eFigure 4. Period Effects in KHEI Component Scores
eFigure 5. Cohort Effects in KHEI Component Scores