

Abstract
In the ciliate Euplotes raikovi, water-borne protein pheromones promote the vegetative cell growth and mating by competitively binding as autocrine and heterologous signals to putative cell receptors represented by membrane-bound pheromone isoforms. A previously determined crystal structure of pheromone Er-1 supported a pheromone/receptor binding model in which strong protein-protein interactions result from the cooperative utilization of two distinct types of contact interfaces that arrange molecules into linear chains, and these into two-dimensional layers. We have now determined the crystal structure of a new pheromone, Er-13, isolated from cultures that are strongly mating reactive with cultures source of pheromone Er-1. The comparison between the Er-1 and Er-13 crystal structures reinforces the fundamental of the cooperative model of pheromone/receptor binding, in that the molecules arrange into linear chains taking a rigorously alternate opposite orientation reflecting the presumed mutual orientation of pheromone and receptor molecules on the cell surface. In addition, the comparison provides two new lines of evidence for a univocal rationalization of observations on the different behaviour between the autocrine and heterologous pheromone/receptor complexes. (i) In the Er-13 crystal, chains do not form layers which thus appear to be an over-structure unique to the Er-1 crystal, not essential for the pheromone signalling mechanisms. (ii) In both crystal structures, the intra-chain interfaces are equally derived from burying amino-acid side-chains mostly residing on helix-3 of the three-helical pheromone fold. This helix is thus identified as the key structural motif underlying the pheromone activity, in line with its tight intra- and interspecific structural conservation.
Keywords: Signal proteins, Self/non-self recognition, Three-helix proteins, Ciliate mating, Protein–protein interactions, Water-borne pheromones
1. Introduction
Diffusible chemical signals, designated pheromones (Karlson and Lüscher, 1959), are used by members of many diverse communities to communicate with one another, as well as to consistently modify behaviors or induce specific developmental processes. Their molecular structures and mechanisms of action have mainly been studied and characterized from bacteria (Stephens, 1986; Dunny and Leonard, 1997; Kleerebezem and Quadri, 2001) and multi-cellular organisms (Shorey, 1976; Wyatt, 2014; Jones and Bennett, 2011). Only a minority are known from the vast and extremely diversified realm of the eukaryotic microorganisms. These are in general refractory to be stably cultivated in the laboratory, a requisite for planning bioassays for pheromone detection. Most of these exceptions reside among cultivable unicellular algae (Frenkel et al., 2014), diatoms (Sato et al., 2011; Gillard et al., 2013; Moeys et al., 2016) and, in particular, ciliates (Luporini et al., 2006, 2016a).
Species of one of the most popular and experimentally valuable ciliate, Euplotes, are unique in that they constitutively secrete families of signaling protein pheromones, which are encoded by high-multiple series of alleles at the same genetic locus (designated as ‘mat locus’) and capable of conferring distinctive chemical phenotypes (designated as ‘mating-types’ I, II, III and so forth) to otherwise morphologically identical cell types (Luporini et al., 2005, 2016b). The pheromone molecular structures have been determined by solution NMR spectroscopy for various members of the E. raikovi (Brown et al., 1993; Mronga et al., 1994; Ottiger et al., 1994; Luginbühl et al., 1996; Liu et al., 2001; Zahn et al., 2001) and E. nobilii (Pedrini et al., 2007; Di Giuseppe et al., 2011; Placzek et al., 2007) families, as well as for one member of the E. petzi family (Pedrini et al., 2017). All show a common up-down-up helical fold stabilized by a tightly conserved disulfide bridge pattern. In spite of relatively low sequence similarities that result in specificities of the chemical properties on the molecular surface, the up-down-up fold of three regular alpha helices is particularly well conserved among E. raikovi pheromomes (named Er-1, Er-2, Er-3 and so forth), with the only exception of an eccentric family member, designated Er-23 (Zahn et al., 2001). An analogous consideration holds for the E. nobilii pheromone family, in which the conserved three-helix fold is complemented with a relatively long N-terminal coil segment (Alimenti et al., 2009; Placzek et al., 2007).
Native pheromones can form unstable homodimers in solution with the subunits associated by non-covalent forces as determined by mass spectrometric analyses (Bradshaw et al., 1990), and show a double biological activity (Vallesi et al., 1995). As primary activity, they bind to their source cells in autologous or autocrine fashion, and behave like animal growth factors that promote the cell vegetative multiplication; as acquired activity, they bind to extraneous conspecifics in heterologous competitive fashion, and behave as sexual inducers of cell–cell unions in mating pairs.
In E. raikovi, the candidate pheromone receptors have been identified with longer pheromone isoforms represented by type-II transmembrane proteins (oriented with the amino and carboxyl termini lying on the cytoplasmic and extracellular sides, respectively), and specified by a mRNA which arises through an alternate intron splicing mechanism from the same primary gene transcript that yields the pheromone mRNA (Miceli et al., 1992; Ricci et al., 2019; Ricci et al., 2021). Because the membrane-anchored pheromone isoform of each cell type has the same genetic origin as the secreted pheromone, the amino-acid sequence of its extracellular and transmembrane domains turns to be identical with that of the unprocessed pheromone precursor (pre-pro-pheromone).
This structural context suggested to rationalize the pheromone/receptor binding reactions on the cell surface by studying the protein–protein interactions that lead soluble pheromone molecules to pack into a crystal (Weiss et al., 1995). Based on this hypothesis, the determination of the crystal structure of the 40-amino acid pheromone Er-1 distinctive of E. raikovi type-I cells provided evidence for a cooperative model of tight pheromone/receptor interactions, in which the receptor and pheromone molecules associate into complexes taking tight - alternate opposite orientations and forming two basic contact interfaces (Weiss et al., 1995). One interface leads the molecules to assemble into linear chains by mostly burying residues on helix-3 of each molecule, while the second interface leads chains to assemble into layers by burying residues on helices 1 and 2 of facing molecules on adjacent chains.
We have now determined the crystal structure of a novel 38-amino acid protein, Er-13, from the E. raikovi pheromone family. It is encoded by a gene allelic to the Er-1 coding gene and has been purified from type-XIII cells that are strongly mating compatible and reactive with the type-I cells source of Er-1. Consistently with their common allelic determination and biological function, the two proteins show closely homologous molecular structures, and the molecules similarly pack tightly into crystals taking alternate up-down orientations and arranging into linear chains.
However, the four-fold screw symmetries characteristic of the space group P43 of the Er-13 crystal prevent the chain assembly into layers, which thus appear to be an over-structure unique to the Er-1 crystal allowed by its space group C2. It is concluded that (i) only the intra-chain protein–protein contacts are critical to the pheromone activity, and (ii) helix-3 is identified by the comparison of the intra-chain intermolecular contacts between the Er-1 and Er-13 crystal structures as the key structural element of the mechanism underlying the pheromone/receptor interactions.
2. Results and discussion
2.1. Er-13 amino acid sequence and molecular structure
The newly determined Er-13 38-amino acid sequence (Fig. 1A) includes six Cys residues, Cys3, Cys10, Cys16, Cys20, Cys30 and Cys38, numbered I to VI starting from the sequence N-terminus. They unequivocally align with the six that are common to the E. raikovi pheromone family, with the exception of the pheromone Er-23 sequence which includes ten Cys residues (Di Giuseppe et al., 2002). The Er-13 molecular structure resulting from the crystal structure determination (see next section) exhibits a bundle of three antiparallel regular α-helices running with an up-down-up topological orientation (Fig. 1B), which conforms with the basic fold of the other E. raikovi pheromone sequences (Luginbühl et al., 1994). Helix-1 spanning from Glu2 to Gln8, helix-2 spanning from Glu13 to Cys20, and helix-3 spanning from Pro24 to Asn37 are connected by two segments with a coil structure. The three disulfide bridges repeat the conserved pattern of the Er pheromone family and provide strong stability to the main body of the molecular structure by joining helices 1 and 2 (bond I-IV), helices 2 and 3 (bond III-V), and the C-terminal Cys residue to the tetrapeptide coil segment extending between helices 1 and 2 (bond II-VI). The residues Met28 and Met32 take two distinct conformations (A and B) in the crystal, with occupation probabilities 50/50 and 60/40, respectively (Fig. 1C). In Met28, it is the whole sidechain that exhibits divergent orientations, while in Met32 only the final sidechain bond SD-CE points to opposite directions.
Fig. 1.
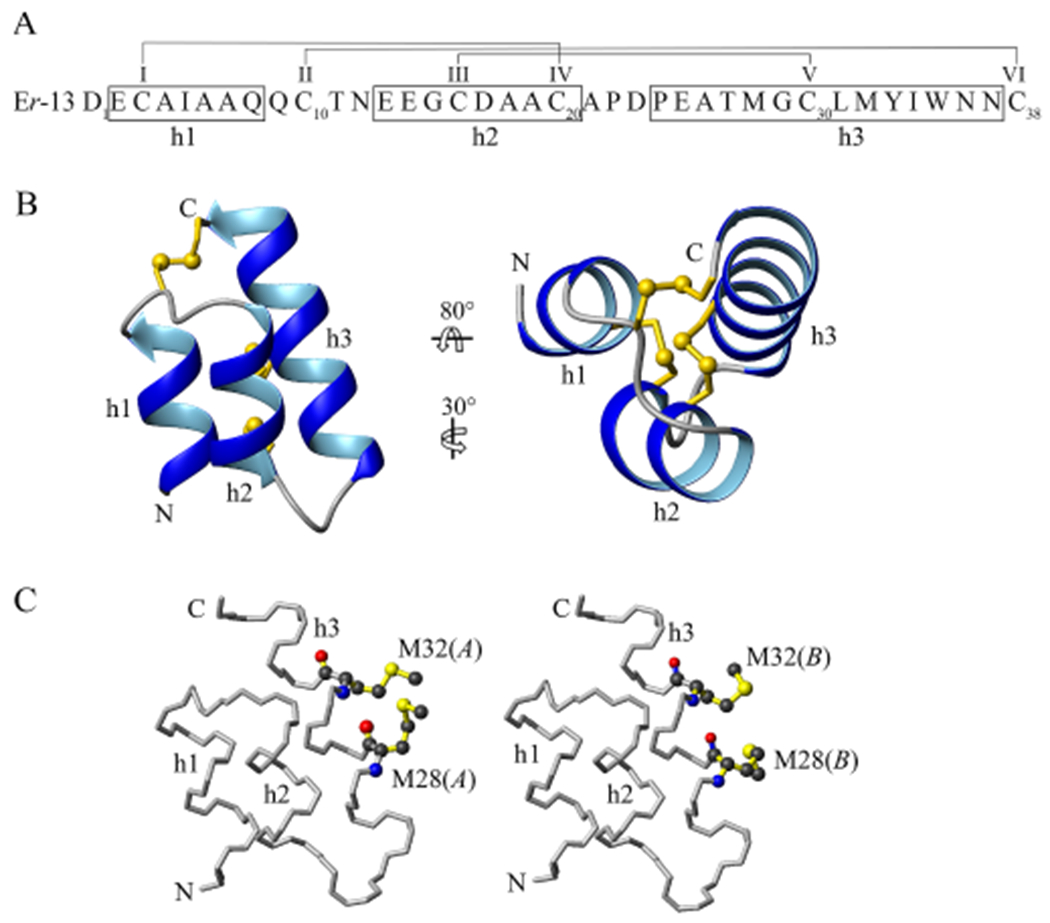
Er-13 amino acid sequence and molecular structure. (A) The sequence segments organized in three alpha-helix structures, h1, h2 and h3, are enclosed in boxes. The six cysteine residues are progressively numbered I to VI, and connected according to their disulfide pairings. (B) Ribbon representation of the molecular structure in front and top views, showing the spatial arrangement of the three disulfide bonds depicted as yellow ball-and-stick models. N and C identify the molecule amino and carboxyl termini, respectively. (C) Illustration as ball-and-stick model of the two different conformations A and B that the helix-3 residues Met28 and Met32 take in the crystal structure.
2.2. Er-13 crystal structure
The Er-13 crystal structure (Fig. 2A) was refined at a resolution of 1.36 Å and is deposited at the PDB data bank under accession code 6E6N. The space group is P43. The asymmetric unit consists of a single pheromone molecule and 23 ordered water molecules. The tetragonal unit cell (Fig. 2B) has lattice constants a = b = 39.1 Å, c = 19.4 Å, and α = β = γ = 90°, as reported in Table 1 together with other parameters from the structure determination protocol.
Fig. 2.

Er-13 crystal structure. (A) Perspective view of a crystal portion showing the molecule arrangement into chains. Molecules of the central chain are colored blue and cyan to highlight their mutually opposite orientations. A two-fold and a four-fold screw rotation axes distinctive of the Er-13 crystal space group P43 are indicated by standard symbols. (B) The unit cell including eight Er-13 molecules is shown with the tetragonal unit cell frame (in red), and the three lattice constants, a, b and c, are indicated along with their lengths.
Table 1.
X-ray data collection and refinement statistics of the Er-13 crystal structure. The overall values of different parameters are reported, with the values in the highest resolution shell given in parentheses.
| Parameter | Value |
|---|---|
| X-ray wavelength (Å) | 0,6198 |
| Resolution range (Å) | 39.12–1.363 (1.411–1.363) |
| Space group | P43 |
| Unit cell lattice parameters (Å / °) | 39.116, 39.116, 19.446 / 90°, 90°, 90° |
| Reflections | 85,988 (7819) |
| Unique reflections | 6477 (640) |
| Multiplicity | 13.3 (12.2) |
| Completeness | 1.00 (1.00) |
| Mean I/sigma(I) | 25.98 (2.92) |
| Wilson B-factor | 16,07 |
| R-merge | 0.05241 (0.8927) |
| R-meas | 0.05457 (0.9315) |
| CC1/2 | 1 (0.914) |
| CC* | 1 (0.977) |
| Reflections used in refinement | 6476 (639) |
| Reflections used for R-free | 648 (64) |
| R-work | 0.1522 (0.3158) |
| R-free | 0.1803 (0.3277) |
| CC (work) | 0.967 (0.861) |
| CC (free) | 0.926 (0.791) |
| Number of non-hydrogen atoms | 312 |
| macromolecules | 289 |
| Protein residues | 38 |
| RMS (bonds) | 0,018 |
| RMS (angles) | 1,85 |
| Ramachandran favored (%) | 97 |
| Ramachandran allowed (%) | 2,6 |
| Ramachandran outliers (%) | 0 |
| Rotamer outliers (%) | 0 |
| Clash score | 0 |
| Average B-factor | 12,77 |
| macromolecules | 11,32 |
| solvent | 30,96 |
| Number of TLS groups | 5 |
In the crystal, Er-13 molecules tightly order with an alternating antiparallel orientation into one-dimensional linear chains, each propagating along the two-fold screw-rotation symmetry axis parallel to the c crystallographic direction. Within the chain, two distinct protein–protein interfaces are identified, and helix-3 is the central element in establishing the intermolecular contacts (Fig. 3A). The first interface, labeled #1, extends over an area of about 390 Å2 between one molecule, for convenience named n, and its nearest-neighbor, n – 1. The two molecules have opposite orientations and are related by a two-fold screw rotation. The second interface, labeled #2, instead extends over a smaller area of about 200 Å2 between molecule n and its next-nearest-neighbor, n – 2. These two molecules have the same orientation and are related by two consecutive screw rotations, equivalent to a translation by the unit cell vector c.
Fig. 3.

Intra-chain Er-13 protein–protein interfaces. (A) Top view of a chain of an eight-molecule segment. Cyan molecules are oriented with the N-terminus close to the observer, and the C-terminus far from the observer; blue molecules have an opposite orientation. Red bars indicate the contact interface #1 between one molecule, n, and its nearest-neighbor, n – 1; orange bars indicate the contact interface #2 between molecule n and its next-nearest-neighbor, n – 2. The two-fold screw symmetry of the chain is indicated with the corresponding symbol on the right. (B) Close-up view of residue sidechains (stick representation) involved in the protein–protein contacts of interfaces #1 and #2. The trapped water molecule is depicted as a blue sphere. Hydrogen bonds are indicated by dashed green lines. (C) View of the surfaces of molecules n, n – 1 and n – 2 buried upon formation of interface #1 between molecules n and n – 1, and interface #2 between molecules n and n – 2. The buried residues are colored red, violet, yellow and green to indicate their acid, aromatic, hydrophobic and polar properties, respectively. The three molecules are rotated with respect to their orientation in panels A and B by −45° or 90° about a vertical axis as indicated.
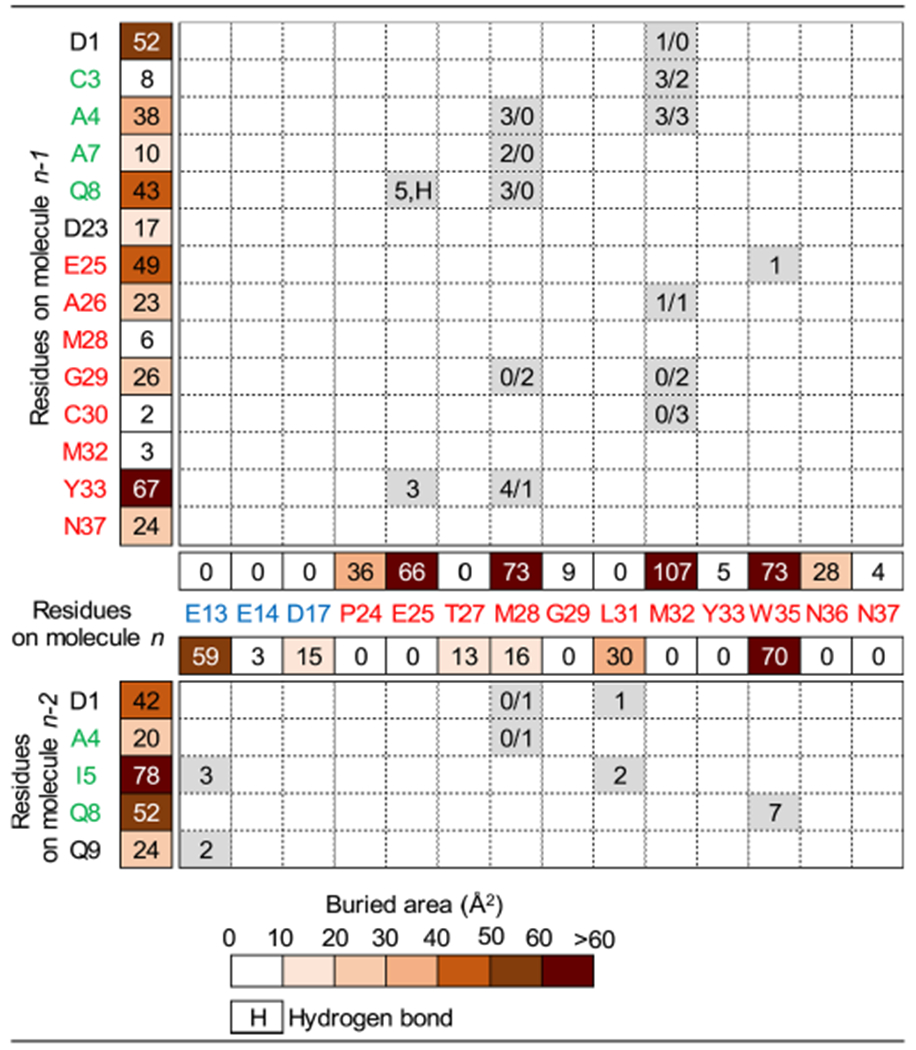
In interface #1, Glu25, Met28, Met32 and Trp35 all on helix-3 of molecule n establish direct contacts with Asp1, Cys3, Ala4, Ala7 and Gln8 on helix-1, and with Glu25, Ala26, Gly29, Cys30 and Tyr33 on helix-3 of molecule n – 1 (Fig. 3B, Table 2). In particular: (i) Glu25 interacts with Gln8 and Tyr33, and its side chain atom OE2 also forms one hydrogen bond with the side chain NE2 of Gln8; (ii) Met28 in conformation A interacts with Ala4, Ala7, Gln8, and Tyr33, and in conformation B with Gly29; (iii) Met32 in conformation A interacts with Asp1, Cys3, Ala4 and Ala26, and in conformation B with Gly29 and Cys30; and (iv) Trp35 interacts with Glu25. In this interface, three other residues that are not sites of direct intermolecular contacts bury an area of more than 10 Å2: Pro24 and Asn36 lying on helix-3 of molecule n, and Asp23 lying at the bottom of helix-3 of molecule n – 1.
Table 2.
Characterization of the Er-13 crystal structure interfaces. The upper part of the table relates to interface #1 between molecules n and n – 1, while the lower part relates to interface #2 between molecules n and n – 2 (see Fig. 3A). The surface areas buried on each residue in the interface formation are reported and color coded as indicated. The numbers of heavy atom contacts between pairs of residues are specified within the corresponding boxes, and for residues M28 and M32 (on molecule n) the two numbers refer to the A and B conformations. In the box corresponding to the Q8/E25 residue pair, the letter H indicates one hydrogen bond. Residues written in green lie on helix-1, in blue on helix-2, and in red on helix-3.
|
In interface #2, Glu13 on helix-2, Leu31 plus Met28 and Trp35 (both already involved in interface #1) on helix-3 of molecule n form direct contacts with Asp1, Ala4, Ile5, Gln8 and lying on, or immediately adjacent to helix-1 of molecule n – 2 (Fig. 3B, Table 2). In particular: (i) Glu13 interacts with Ile5 and Gln9; (ii) Met28 in conformation B interacts with Asp1 and Ala4; (iii) Leu31 interacts with Asp1 and Ile5; and (iv) Trp35 interacts with Gln8. Only two other residues that are not sites of direct intermolecular contacts remain significantly buried in this interface: Asp17 and Thr27, both from molecule n and lying on helix-2 and helix-3, respectively.
Overall, the trimeric association between molecules n, n – 1 and n – 2 mostly buries hydrophobic surfaces and aromatic rings of residue sidechains (Fig. 3C). It circumscribes a narrow internal cavity that is largely delimited by the surfaces of residues that are minimally, or not at all involved in the relevant intermolecular contacts, namely Asp17, Pro24 and Thr27 of molecule n, Gly29 of molecule n – 1, and Ala4 of molecule n – 2. Access to the cavity is blocked by one water molecule that forms a hydrogen bond with the backbone O of Pro24 of molecule n.
The three-dimensional Er-13 crystal results from the assembly of the one-dimensional chains aligned parallel with one another along the c crystallographic direction (Fig. 4A). The assembly leads to the formation of wider and narrower solvent channels (labelled Ch1 and Ch2, respectively), that are responsible for most of the 33% water content in the crystal. A four-fold crystal symmetry screw-rotation axis propagates in the middle of each channel and represents a symmetry operation of the group of the four closest chains.
Fig. 4.
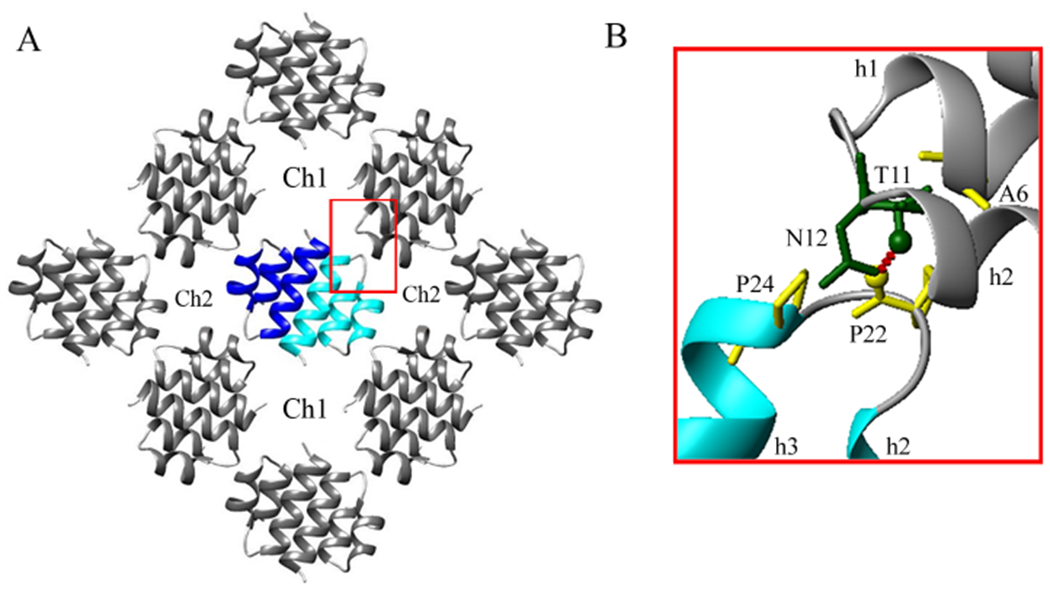
Inter-chain contacts in the Er-13 crystal. (A) Front view of the group of chains shown in Fig. 2A, displaying the larger and smaller solvent channels (Ch1 and Ch2, respectively), as well as one inter-chain contact region (boxed in red). (B) Close-up view of the inter-chain contact region showing the residue sidechains (stick representation) involved in the contacts, and the inter-chain Pro22-Thr11 hydrogen bond (dashed red line).
The inter-chain contacts take place between pairs of chains differing in orientation by 90°, with the most important intermolecular interface extending over a surface of about 155 Å and localized essentially at the level of two inter-helix coil regions (Fig. 4B). The molecules of one chain involve Pro22 and Pro24 of the coil segment which joins their helices 1 and 2; molecules of the parallel chain involve Thr11 and Asn12 of the coil segment joining their helices 1 and 2, as well as Ala6 lying on helix-1. Pro22 provides the backbone atom O to one hydrogen bond with the sidechain atom OG1 of Thr11, and forms one hydrophobic contact with Ala6. Pro24 forms two hydrophobic contacts with Thr11 and Asn12.
2.3. Comparison between the Er-13 and Er-1 molecular and crystal structures
The Er-1 crystal structure, on which the cooperative model of pheromone/receptor interactions is based, was originally solved at a resolution of 1.59 Å (PDB, 1ERL) (Weiss et al., 1995), and then refined to 1.0 Å (PDB, 2ERL) (Anderson et al., 1996; Anderson et al., 1997). As part of the investigations reported here, it has been re-determined at 0.7 Å of resolution on one Er-1 crystal of the seeding batch used for the Er-13 crystallization (Supplementary Methods and Supplementary Table S1), and found to fully overlap with the original determination except for very minor differences of which one is worth mentioning. The ethanol molecule earlier reported to be trapped in the interface between two adjacent protein molecules is replaced by a cluster of water molecules (Supplementary Figure S1). In the following, we rely on the newly determined Er-1 crystal structure (PDB, 6E6O) as reference for the comparison with the Er-13 structure.
The sequence alignment between the Er-13 and Er-1 proteins shows conservation of 17 of the 38 amino acid residues including the six cysteines which are involved in the three disulfide bridges distinctive of the E. raikovi pheromone family (Fig 5A). In spite of this relatively low sequence equivalence (about 40%), the secondary structure and the overall fold are substantially the same between the two proteins (Fig. 5B). An RMSD of about 0.7 Å is calculated in relation to the backbone atoms of residues 1–9, 16–20, 25–38 of the Er-13 protein and residues 1–9, 15–19 and 23–35 of the Er-1 protein. This value decreases further to about 0.5 Å if only residues on helices 1 and 3 are considered. Minor differences are limited to the helix lengths, the length and shape of the non-helical coil segments, and to helix-2 which is regular in the Er-13 protein and forms a 310-turn with the three first residues in the Er-1 protein.
Fig. 5.

Er-13 and Er-1 amino acid sequences and molecular structures. (A) Alignment of the Er-13 and Er-1 amino acid sequences, in which dots mark conserved residues, and boxes enclose residues forming the three conserved helical structures (h1, h2 and h3). The dashed line encloses Er-1 residues forming a 310-helix turn in h2, and italics distinguishes residues used in the superposition of the two molecular structures shown in B. In the Er-13 sequence, residue substitutions resulting in an increased hydrophobicity of the molecule are shadowed. (B) Superpositions of the Er-13 (red) and Er-1 (green) molecular structures for minimal backbone RMSD of the residues written in italics in panel A. The two plots are in ribbon and backbone stick representations, respectively. N and C indicate the amino- and carboxyl termini.
Molecules Er-13 and Er-1 similarly crystallize forming one-dimensional linear chains that propagate along a two-fold screw-symmetry rotation axis of the crystal, thus taking a rigorously alternating up-down orientation within the chain (Fig. 6A). However, the details of their intra-chain arrangement differ. The Er-13 molecules are rotated with respect to Er-1 molecules by about 30° around the axis parallel to the helix direction, and this different orientation strongly correlates with marked differences in the intra-chain interfaces. The minor Er-13 crystal interface #2 between two next-nearest-neighbor molecules, n and n – 2, finds no significant counterpart in the Er-1 crystal, in which it is reduced to a buried surface of only 35 Å2 with a single water molecule-mediated contact. Instead, the major Er-13 crystal interface #1 between two nearest neighbor molecules, n and n – 1, finds a precise counterpart with the interface earlier designed as “Dimer-2” in the Er-1 crystal (Weiss et al., 1995). In this interface, molecule n – 1 exposes a surface, formed by helices 1 and 3, which is extremely similar across both crystal structures (Fig 6B), due to the equivalence of the molecular backbones and the conservation, or semi-conservation, of many residues (Asp1, Cys3, Ala7, Gln8/Ile8, Glu25/Glu23, Gly29/Gly27, Cys30/Cys28, Met32/Met30, Tyr33/Tyr31, Asn36/Ser34 and Asn37/Asn35). Only two substitutions (Ala4/Asp4 and Ala26/Glu24) generate variations that increase the surface hydrophobicity in the Er-13 crystal. In contrast, the other molecule, n, exposes a surface formed by the helix-3 back side that is the site of a number of significant residue substitutions. In combination with the different orientations that molecule n takes with respect to molecule n – 1 in the two crystal structures, these substitutions are responsible for marked differences in the intra-chain interface which is common to the Er-1 and Er-13 crystals. The protein–protein contacts of this interface turn out to be mostly hydrophobic in the Er-13 crystal versus mostly hydrophilic in the Er-1 crystal, and this difference resides in the two following aspects, (i) In the Er-1 crystal, the interface contacts are in part mediated by six trapped water molecules that provide a network of hydrogen bonds, while in the Er-13 crystal the interface lacks any trapped water molecule and involves only direct contacts of typically hydrophobic character. (ii) In the Er-1 crystal, residues Arg25, Thr26, Tyr29 and Tyr33, all directly involved in the interface hydrogen-bond network (Anderson et al., 1997), are substituted in the Er-13 crystal: two (Thr26 and Tyr33) by the non-hydrophilic Met28 and Trp35 residues, and two (Arg25 and Tyr29) by residues Thr27 and Leu31 that are excluded from the interface and involved in interface #2 specific to the Er-13 crystal.
Fig. 6.
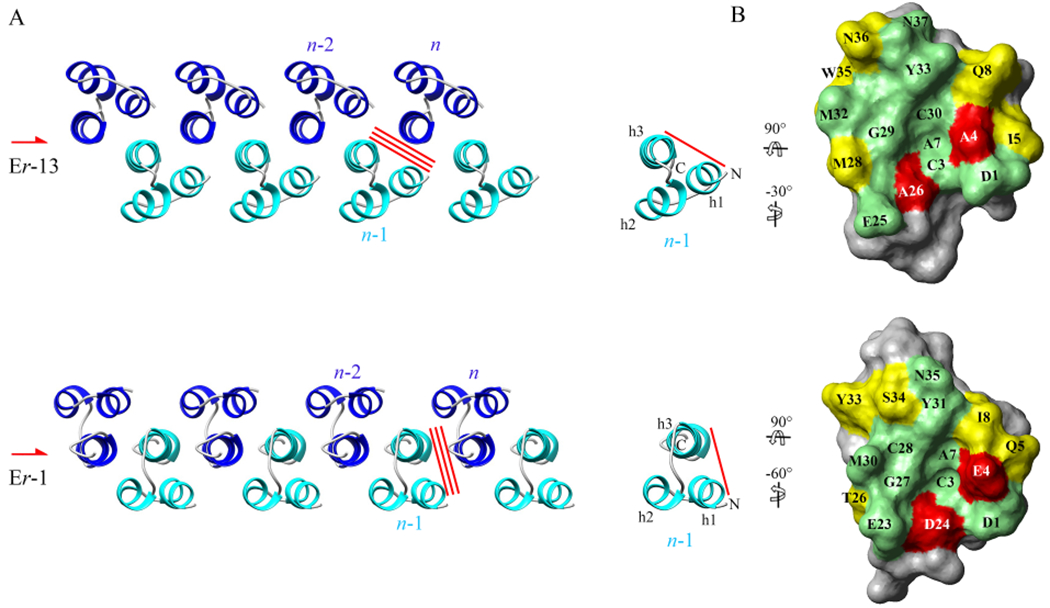
Intra-chain interface conservation between the Er-13 and Er-1 crystal structures. (A) Top view of the Er-13 and Er-1 chains propagating along a two-fold screw symmetry axis (symbol on the left). The red bars indicate the interfaces #1 between one molecule n and the nearest neighbor one, n – 1, that is conserved between the two chains. (B) View of the faces of molecules n – 1 (red bar) formed by helices 1 and 3 and involved in the interface #1. Residues that are conserved, semi-conserved, or not-conserved are colored green, yellow and red, respectively. With respect to their orientation in A, molecules are both first rotated by 90° about the horizontal axis, and then by −30° (Er-13) or −60° (Er-1) about the vertical axis, in order to bring them to the same orientation.
The different intra-chain orientation between the Er-13 and Er-1 molecules also determines differences in the outer chain surfaces. Molecules Er-1 orient helices 1 and 2 parallel to the chain sides and position helix-3 well inside the chain core (Fig. 6A). They can thus establish a mostly hydrophobic contact interface between the exposed molecular surfaces of helices 1 and 2 from molecules of one chain and the counterparts from molecules on the adjacent chain. This inter-chain interface, earlier designed “Dimer-1” (Weiss et al., 1995), is responsible for the layer formation and its two-fold symmetry is specific of the space group C2 distinctive of the Er-1 crystal (Fig. 7). An equivalent interface cannot be formed by Er-13 molecules because their helix-1 turns out to be closer to the chain core (Fig. 6A) and the exposure of the sole helix-2 on the outer chain surface is inadequate to establish effective facial inter-chain contacts. The two-fold symmetries of the Er-1 crystal are lost, and the chains of Er-13 molecules arrange at 90° between one another, in line with four-fold screw symmetries distinctive of the space group P43 of the Er-13 crystal (Fig. 7).
Fig. 7.
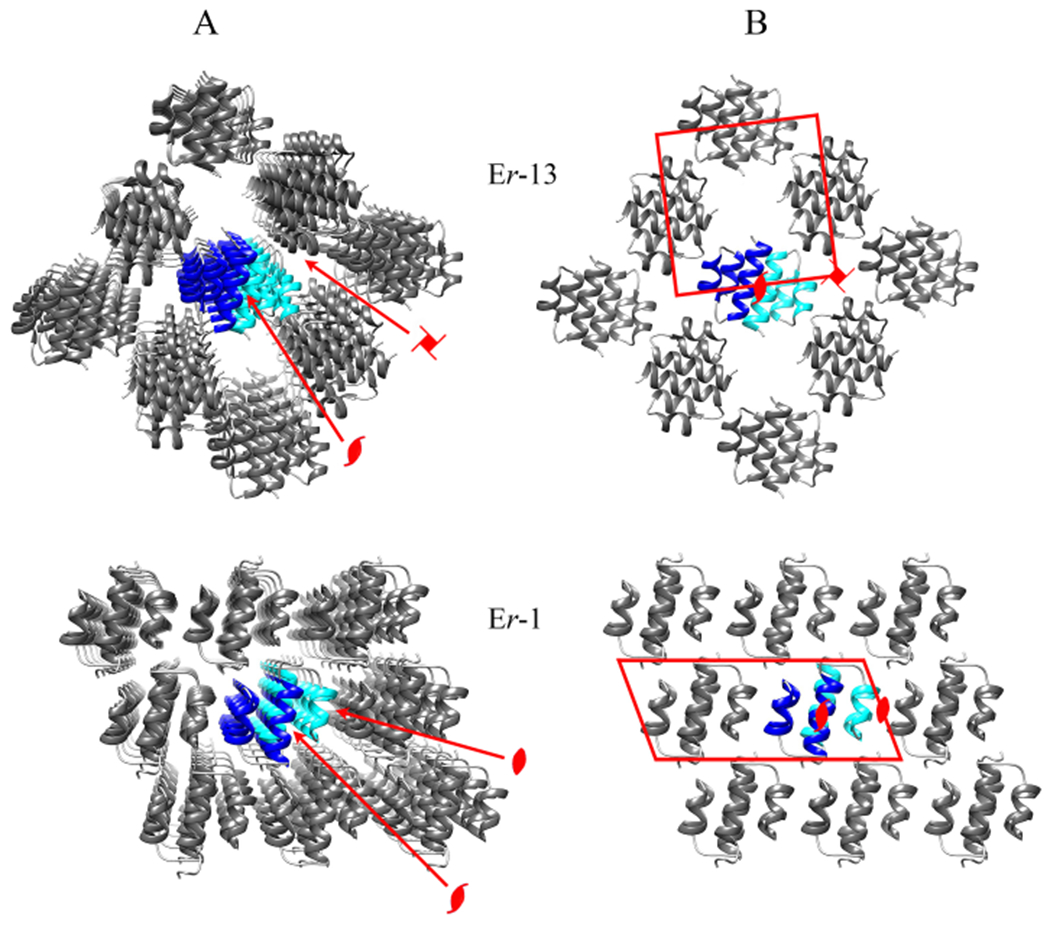
Symmetry axes and unit cells of the Er-13 and Er-1 crystal structures. (A) Perspective view of crystal portions (as in Fig 2A) with crystallographic symmetries indicated by standard symbols: a two-fold screw symmetry common to both crystals, a four-fold screw rotation symmetry distinctive of the Er-13 crystal, and a two-fold rotation symmetry distinctive of the Er-1 crystal. (B) Orthogonal projection of the structure shown in A along the chain propagation direction. The projected unit cell frame is represented in red, and the symmetry axes shown in A are indicated with their standard symbols.
2.4. Biological insights
Like mammalian cytokines and protein growth factors, Euplotes pheromones elicit different, context-dependent cell responses by binding to specific receptors on the cell surface in competition with one another due to their close structural homology (Ortenzi et al., 2000; Ortenzi and Luporini, 1995). The crystal structure determination of the E. raikovi pheromone Er-1 suggested a binding model of soluble pheromones to the extracellular ligand binding domain of their receptor membrane isoforms, in which molecules associate tightly on the cell surface rigorously taking mutually opposed orientations (Weiss et al., 1995). The determination of the new Er-13 pheromone crystal structure fully validates this fundamental of the model. In addition, it provides evidence for a new functional aspect relevant to the pheromone mechanism of action. Namely, the basic topological arrangement of the pheromone molecules in the crystal takes place in the form of linear chains, not of two-dimensional layers which have to be considered an overarching complication which is specific to the Er-1 crystal and, hence, physiologically not relevant to elicit the cell response to the pheromone/receptor interactions. As a consequence, the functionally most important element of the pheromone structure in determining the pheromone/receptor interactions has to be identified with helix-3 which lies right in the middle of the chain, and is the crucial site of the intrachain protein–protein contact interfaces. Helices 1 and 2, instead, have to be regarded as functionally secondary, less important structural elements because they are exposed to the chain surface and participate to a much minor extent in intrachain contact interfaces.
Support for the central role played by helix-3 in the Euplotes pheromone/receptor interactions is first derived from phylogenetic observations. The comparison between the pheromone molecular structures determined via NMR spectroscopy from E. raikovi, E. nobilii and E. petzi clearly indicates that helix-3 is structurally much more tightly conserved, at both intra- and inter-specific levels, than helices 1 and 2 in relation to backbone trace, extension, and regular conformation. This conservation likely also broadens to pheromones from other Euplotes species, and well accounts for pheromone-mediated cross-mating reactions that are frequently observed between heterospecific cell cultures (Nobili et al., 1978; Kuhlmann and Sato, 1993; Vallesi et al., 2014). In addition, it finds a striking analogy with a tight interspecific conservation of the helix which functions as the receptor binding site in a family of species-specific water-borne pheromones, collectively designated ‘attractins’, that each of the various species of the sea-hare gastropod Aplysia releases into the environment to induce breeding aggregations of mating and egg-laying individuals (Painter et al., 2003, 2004).
The helix-3 centrality in the pheromone/receptor interactions is further supported by biological observations relevant to a shift of the Er-1 pheromone activity, which is consequent to a cell ageing-dependent and experimentally reproducible sulphur atom oxidation of the Met30-residue side-chain lying exposed on the helix-3 surface of this pheromone (Alimenti et al., 2012). Due to this oxidation, Er-1 molecules bind to their source type-I cells no longer as an autocrine growth-promoting signal, which immunocytochemical analyses have shown to form autologous pheromone/receptor complexes that undergo clustering and internalization via endocytic vesicles determining the cell-growth promoting signal (Vallesi et al., 1995, 2005). Rather, they mimic the binding of non-self pheromone molecules forming heterologous pheromone/receptor complexes destined to remain exposed on the cell surface (Vallesi et al., 2005), and possibly functioning in promoting cell–cell adhesion in mating pairs (Weiss et al., 1995).
A close look at the Er-1 crystal structure suggests a prompt explanation for this change in biological activity of oxidized Er-1 molecules. The helix-3 Met30 residue shows a double conformation and is used by each molecule of the chain to stabilize key contacts with both the preceding and subsequent nearest-neighbour molecules (Anderson et al., 1997) (Supplementary Figure S2). Therefore, an enhanced steric hindrance and a modified surface potential consequent to the Met-30 sulphur atom oxidation well account for why oxidized Er-1 molecules, yet capable to form a single receptor contact interface, are no longer amenable to oligomerize ‘sandwiched’ between two non-oxidized receptor counterparts.
Further evidence that helix-3 may play a key role also in the formation of heterologous pheromone/receptor complexes comes from the structural comparison of the intra-chain interface which is common between the Er-13 and Er-1 crystals (Fig. 6B). This interface buries residues, lying mostly on helix-3 and a few on helix-1, that are tightly conserved in both crystals on the surface of only one of the two interacting molecules. This conservation implies that Er-13 and Er-1 molecules are fully competent to interact and associate with one another.
However, their complexes appear to be unsuitable to further oligomerize into chains capable of eliciting an autocrine cell growth signal via endocytic internalization. First, attempts to obtain ‘hybrid’ crystals from mixtures of Er-1 and Er-13 molecules were unsuccessful (unreported results). Second, any theoretical attempt to obtain chains from complexes between Er-13 and Er-1 molecules inevitably leads to steric clashes because the chains bend. This bending is the ultimate consequence of differences that distinguish the relative intra-chain orientation of the Er-13 and Er-1 molecules and is determined by mutual substitutions of key residues on the helix 3.
3. Material and Methods
3.1. Amino acid sequence determination
The amino acid sequence of the new pheromone Er-13 was determined from the nucleotide sequence of the coding gene, designed macer-13, cloned from DNA preparations of type-XIII cells via a two-step polymerase chain reaction (PCR) approach based on standard procedures (Ricci et al., 2019). The first amplification was run with a forward primer (5′-GTGGTCTTAATATCTGGTTGATACC-3′) and a reverse primer (5′-TATTGGAGTGAATTATATAATCAATCGG-3′) designed on nucleotide sequences located close to the gene’s telomeric ends and tightly conserved in the E. raikovi pheromone gene family. It generated a product equivalent to the gene’s central region with the open reading frame (ORF) encoding Er-13 in the form of a cytoplasmic precursor (preproEr-13). The second amplification was run with a forward primer (5′-ATGAAGAAGGATGTGATGCTG-3′) and a reverse primer (5′-CAGCATCACATCCTTCTTCAT-3′) designed on nucleotide sequences internal to the gene ORF and used in alternate combination with a telomer-specific primer (5′-CCCCAAAACCCCAAAACCCC-3′). It generated two products with sequences equivalent to the 5′ and 3′ gene regions necessary to compose the full-length sequence of 1038 bp of the mac-er-13 gene. This sequence is reported in Supplementary Figure S3 and deposited at the GenBank database under accession code MH748222.
3.2. Protein source
Pheromone Er-13 was prepared from type-XIII cell cultures maintained for 1–2 weeks, at 20–22 °C, under a natural cycle of weak light and dark, at a concentration of 5–10 × 103 cells/ml in the continuous presence of food provided by the green alga Dunaliella tertiolecta cultivated in natural sea water enriched with Walne medium. At the end of the growth period, cultures were deprived of food for 2–3 days by resuspension with fresh seawater before being used to prepare cell-free filtrates from which Er-13 was purified following a standard chromatographic procedure (Concetti et al., 1986). Protein was adsorbed from culture filtrates onto reverse-phase Sep-Pak C18 cartridges (Waters, Milford, CA) and fractionated, first by molecular exclusion chromatography onto a Superdex-Peptide HR 10/30 column (GE Healthcare, Little Chalfont, UK) and then by anion-exchange chromatography on a Mono Q HR 5/50 GL column (GE Healthcare, Little Chalfont, UK). Tris-HCl and NaCl were removed by adsorbing the purified protein from the eluate again onto Sep-Pak C18 cartridges which were then eluted with 35% 2-propanol. The final protein preparations were lyophilized, analyzed for homogeneity on a Matrix-Assisted Laser Desorption/Ionization Time Of Flight (MALDI-TOF) mass spectrometer, and stored dry at 4 °C with no loss of biological activity. From one liter of cell-free filtrate, approximately 30 μg of homogeneous Er-13 protein was recovered. Pheromone Er-1 for the cross-seeding crystallization described below was obtained by the same protocol, with a yield of about 200 μg homogeneous protein per liter of cell-free filtrate.
3.3. Protein crystallization and X-ray data collection
The Er-13 crystals were obtained by cross-seeding from a stock of Er-1 crystals according to the following procedure. Lyophilized Er-1 protein was dissolved with MilliQ water to a concentration of 8.8 mg/ml. Initial crystals were obtained following a crystallization protocol based on that given in (Weiss et al., 1995). Crystals grew at 20 °C by the sitting drop, vapor diffusion method with wells containing 0.1 M to 0.2 M (NH4)2SO4, 0.05 M Na-citrate, pH 3.5, and 6% (v/v) ethanol and using a drop size of 5 μl protein and 5 μl reservoir solution. To optimize the crystal quality a seed stock was made from these crystals and microseed matrix screening (MMS) was carried out using a Qiagen Classics I screen following the procedure detailed in D’Arcy et al 2014 (D’Arcy et al., 2014). Lyophilized Er-13 was then dissolved with MilliQ water to a concentration of 8.8 mg/ml. A seed stock was made from the optimized Er-1 crystals grown through seeding in 25% ethylene glycol. This seed stock was then used to cross seed with Er-13 using the MMS technique into a Qiagen Classics I screen. Crystals grew from the seeded 0.1 M HEPES, pH 7.5, 1.4 M Na-citrate condition and were used for data collection. X-ray diffraction data were recorded at a wavelength of 0.62 Å, at the X10SA beamline of the Swiss Light Source of the Paul Scherrer Institute (Switzerland), from one 100-μm Er-13 crystal cryo-protected in 80% saturated lithium sulfate and flash-frozen in liquid nitrogen.
3.4. Structure determination and analysis
The collected X-ray data were processed with the XDS software package (Kabsch, 2010). The Er-13 structure was solved by ab-initio molecular replacement/density modification as implemented in the ARCIMBOLDO_LITE program in CCP4-7.0 (Winn et al., 2011; Sammito et al., 2013). Model building was performed with the program COOT (Emsley and Cowtan, 2004). The structure refinement was accomplished with REFMAC5 (Murshudov et al., 2011). The TLS domains 1–6, 7–12, 13–18, 19–32 and 33–38, determined with the TLSMD server (Painter and Merritt, 2006), were included in the last refinement stages. For the final validation, the PDB_REDO utility (Joosten et al., 2012) was exploited to identify problematic areas that were interactively corrected.
The secondary structure elements of the Er-13 molecular structure were determined with the program Chimera (Pettersen et al., 2004), relying on the default ‘ksdssp’ method (Kabsch and Sander, 1983). The different interfaces between the molecules in the crystal were inferred with the software PISA (Krissinel and Henrick, 2007) (Supplementary Table S2), which determines the per-residue buried surface area and identifies the atoms involved in the interface formation. Using the heavy atom coordinate models as input, Chimera was also used to identify intermolecular hydrogen bonds (Pettersen et al., 2004), and intermolecular tight contacts between heavy atom pairs, defined as those for which the two van der Waals spheres with standard radii for atoms without explicit protons come closer than 0.4 Å.
Supplementary Material
Acknowledgements
This research was funded by the Italian Ministero dell’Università e della Ricerca and the Paul Scherrer Institut, Villigen, Switzerland, which provided the synchrotron radiation beamtime at beamline X10SA of the SLS.
Footnotes
CRediT authorship contribution statement
Bill Pedrini: Conceptualization, Validation, Visualization, Writing – original draft, Project administration. Aaron D. Finke: Methodology, Software, Formal analysis, Investigation. May Marsh: Methodology, Software, Formal analysis, Investigation, Resources. Pierangelo Luporini: Conceptualization, Supervision, Writing – original draft, Writing – review & editing, Supervision. Adriana Vallesi: Investigation, Resources, Funding acquisition. Claudio Alimenti: Investigation, Resources, Visualization, Project administration.
Declaration of Competing Interest
The authors declare that they have no known competing financial interests or personal relationships that could have appeared to influence the work reported in this paper.
Appendix A.: Supplementary data
Supplementary data to this article can be found online at https://doi.org/10.1016/j.jsb.2021.107812.
References
- Alimenti C, Vallesi A, Pedrini B, Wüthrich K, Luporini P, 2009. Molecular cold-adaptation: comparative analysis of two homologous familes of psychrophilic and mesophilic signal proteins of the protozoan ciliate, Euplotes. IUBMB Life 61, 838–845. [DOI] [PubMed] [Google Scholar]
- Alimenti C, Vallesi A, Luporini P, Buonanno F, Ortenzi C, 2012. Cell aging-induced methionine oxidation causes an autocrine to paracrine shift of the pheromone activity in the protozoan ciliate. Euplotes raikovi. Exp. Cell Res 318 (2), 144–151. [DOI] [PubMed] [Google Scholar]
- Anderson DH, Weiss MS, Eisenberg D, 1996. A challenging case for protein crystal structure determination: the mating pheromone Er-1 from Euplotes raikovi. Acta Crystallogr. D Biol. Crystallogr 52 (3), 469–480. [DOI] [PubMed] [Google Scholar]
- Anderson DH, Weiss MS, Eisenberg D, 1997. Charges, hydrogen bonds, and correlated motions in the 1 Å resolution refined structure of the mating pheromone Er-1 from Euplotes raikovi. J. Mol. Biol 273 (2), 479–500. [DOI] [PubMed] [Google Scholar]
- Bradshaw RA, Raffioni S, Luporini P, Chait BT, Lee T, Shively J, 1990. Amino acid sequence-mass spectrometric analyses of mating pheromones of the ciliate Euplotes raikovi. In: Horvath C, Nikelly JG (Eds.), Analytical Biotechnology. American Chemical Society, Washington, D.C. [Google Scholar]
- Brown LR, Mronga S, Bradshaw RA, Ortenzi C, Luporini P, Wüthrich K, 1993. Nuclear magnetic resonance solution structure of the pheromone Er-10 from the ciliated protozoan Euplotes raikovi. J. Mol. Biol 231 (3), 800–816. [DOI] [PubMed] [Google Scholar]
- Concetti A, Raffioni S, Miceli C, Barra D, Luporini P, 1986. Purification to apparent homogeneity of the mating pheromone of mat-1 homozygous Euplotes raikovi. J. Biol. Chem 261 (23), 10582–10586. [PubMed] [Google Scholar]
- D’Arcy A, Bergfors T, Cowan-Jacob SW, Marsh M, 2014. Microseed matrix screening for optimization in protein crystallization: what have we learned? Acta Crystallogr. F Struct. Biol. Commun 70 (9), 1117–1126. [DOI] [PMC free article] [PubMed] [Google Scholar]
- Di Giuseppe G, Miceli C, Zahn R, Damberger F, Wuthrich K, Luporini P, 2002. A structurally deviant member of the Euplotes raikovi pheromone family: Er-23. J. Eukaryot. Microbiol 49 (1), 86–92. [DOI] [PubMed] [Google Scholar]
- Di Giuseppe G, Erra F, Dini F, Alimenti C, Vallesi A, Pedrini B, Wuthrich K, Luporini P, 2011. Antarctic and Arctic populations of the ciliate Euplotes nobilii show common pheromone-mediated cell-cell signaling and cross-mating. Proc. Natl. Acad. Sci. USA 108 (8), 3181–3186. [DOI] [PMC free article] [PubMed] [Google Scholar]
- Dunny GM, Leonard BAB, 1997. Cell–cell communication in gram-positive bacteria. Ann. Rev. Microbiol 51 (1), 527–564. [DOI] [PubMed] [Google Scholar]
- Emsley P, Cowtan K, 2004. Coot: model-building tools for molecular graphics. Acta Crystallogr. D Biol. Crystallogr 60 (12), 2126–2132. [DOI] [PubMed] [Google Scholar]
- Frenkel J, Vyverman W, Pohnert G, 2014. Pheromone signaling during sexual reproduction in algae. Plant J. 79 (4), 632–644. [DOI] [PubMed] [Google Scholar]
- Gillard J, Frenkel J, Devos V, Sabbe K, Paul C, Rempt M, Inzé D, Pohnert G, Vuylsteke M, Vyverman W, 2013. Metabolomics enables the structure elucidation of a diatom sex pheromone. Angew. Chem. Int. Ed 52 (3), 854–857. [DOI] [PubMed] [Google Scholar]
- Jones SK, Bennett RJ, 2011. Fungal mating pheromones: choreographing the dating game. Fungal Genet. Biol 48 (7), 668–676. [DOI] [PMC free article] [PubMed] [Google Scholar]
- Joosten RP, Joosten K, Murshudov GN, Perrakis A, 2012. PDB_REDO: constructive validation, more than just looking for errors. Acta crystallogr. D Biol. Crystallogr 68 (4), 484–496. [DOI] [PMC free article] [PubMed] [Google Scholar]
- Kabsch W, 2010. XDS. Acta Crystallogr. D Biol. Crystallogr 66 (2), 125–132. [DOI] [PMC free article] [PubMed] [Google Scholar]
- Kabsch W, Sander C, 1983. Dictionary of protein secondary structure: pattern recognition of hydrogen-bonded and geometrical features. Biopolymers 22 (12), 2577–2637. [DOI] [PubMed] [Google Scholar]
- Karlson P, Lüscher M, 1959. ‘Pheromones’: a new term for a class of biologically active substances. Nature 183 (4653), 55–56. [DOI] [PubMed] [Google Scholar]
- Kleerebezem M, Quadri LE, 2001. Peptide pheromone-dependent regulation of antimicrobial peptide production in Gram-positive bacteria, a case of multicellular behavior. Peptides 22 (10), 1579–1596. [DOI] [PubMed] [Google Scholar]
- Krissinel E, Henrick K, 2007. Inference of macromolecular assemblies from crystalline state. J. Mol. Biol 372 (3), 774–797. [DOI] [PubMed] [Google Scholar]
- Kuhlmann H-W, Sato K, 1993. Interspecific mating reactions between Euplotes octocarinatus and Euplotes patella syngen 2. Eur. J. Protistol 29 (1), 24–31. [DOI] [PubMed] [Google Scholar]
- Liu A, Luginbühl P, Zerbe O, Ortenzi C, Luporini P, Wüthrich K, 2001. NMR structure of the pheromone Er-22 from Euplotes raikovi. J. Biomol. NMR 19, 75–78. [DOI] [PubMed] [Google Scholar]
- Luginbühl P, Ottiger M, Mronga S, WÜthrich K, 1994. Structure comparison of the pheromones Er-1, Er-10, and Er-2 from Euplotes raikovi. Prot. Sci 3 (9), 1537–1546. [DOI] [PMC free article] [PubMed] [Google Scholar]
- Luginbühl P, Wu J, Zerbe O, Ortenzi C, Luporini P, Wüthrich K, 1996. The NMR solution structure of the pheromone Er-11 from the ciliated protozoan Euplotes raikovi. Protein Sci. 5 (8), 1512–1522. [DOI] [PMC free article] [PubMed] [Google Scholar]
- Luporini P, Alimenti C, Ortenzi C, Vallesi A, 2005. Ciliate mating types and their specific protein pheromones. Acta Protozool. 44, 89–101. [Google Scholar]
- Luporini P, Vallesi A, Alimenti C, Ortenzi C, 2006. The cell type-specific signal proteins (pheromones) of protozoan ciliates. Curr. Pharm. Des 12, 3015–3024. [DOI] [PubMed] [Google Scholar]
- Luporini P, Pedrini B, Alimenti C, Vallesi A, 2016a. Revisiting fifty years of research on pheromone signaling in ciliates. Eur. J. Protistol 55, 26–38. [DOI] [PubMed] [Google Scholar]
- Luporini P, Alimenti C, Pedrini B, Vallesi A, 2016b. Ciliate communication via water-borne pheromones. In: Witzany G, Nowacki M (Eds.), Biocommunication of Ciliates. Springer, pp. 159–174. [Google Scholar]
- Miceli C, La Terza A, Bradshaw RA, Luporini P, 1992. Identification and structural characterization of a cDNA clone encoding a membrane-bound form of the polypeptide pheromone Er-1 in the ciliate protozoan Euplotes raikovi. Proc. Natl. Acad. Sci. USA 89 (5), 1988–1992. [DOI] [PMC free article] [PubMed] [Google Scholar]
- Moeys S, Frenkel J, Lembke C, Gillard JTF, Devos V, Van den Berge K, Bouillon B, Huysman MJJ, De Decker S, Scharf J, Bones A, Brembu T, Winge P, Sabbe K, Vuylsteke M, Clement L, De Veylder L, Pohnert G, Vyverman W, 2016. A sex-inducing pheromone triggers cell cycle arrest and mate attraction in the diatom Seminavis robusta. Sci. Rep 6 (1). [DOI] [PMC free article] [PubMed] [Google Scholar]
- Mronga S, Luginbühl P, Brown LR, Ortenzi C, Luporini P, Bradshaw RA, Wüthrich K, 1994. The NMR solution structure of the pheromone Er-1 from the ciliated protozoan Euplotes raikovi. Protein Sci. 3, 1527–1536. [DOI] [PMC free article] [PubMed] [Google Scholar]
- Murshudov GN, Skubák P, Lebedev AA, Pannu NS, Steiner RA, Nicholls RA, Winn MD, Long F, Vagin AA, 2011. REFMAC5 for the refinement of macromolecular crystal structures. Acta Crystallogr. D Biol. Crystallogr 67 (4), 355–367. [DOI] [PMC free article] [PubMed] [Google Scholar]
- Nobili R, Luporini P, Dini F, 1978. Breeding systems, species relationships and evolutionary trends in some marine species of Euplotidae (Hypotrichida Ciliata). In: Battaglia B, Beardmore l.A. (Eds.), Marine Organisms: Genetics, Ecology. and Evolution, Plenum Press, New York. [Google Scholar]
- Ortenzi C, Alimenti C, Vallesi A, Di Pretoro B, La Terza A, Luporini P, 2000. The autocrine mitogenic loop of the ciliate Euplotes raikovi, the pheromone membarne-bound forms are the cell binding sites and potential signalling receptors of soluble pheromones. Mol. Biol. Cell 11, 1445–1455. [DOI] [PMC free article] [PubMed] [Google Scholar]
- Ortenzi O, Luporini P, 1995. Competition among homologous polypeptide pheromones of the ciliate Euplotes raikovi for binding to each other’s cell receptors. J. Eukaryot. Microbiol 42 (3), 242–248. [Google Scholar]
- Ottiger M, Szyperski T, Luginbühl P, Ortenzi C, Luporini P, Bradshaw RA, WÜthrich K, 1994. The NMR solution structure of the pheromone Er-2 from the ciliated protozoan Euplotes raikovi. Protein Sci. 3 (9), 1515–1526. [DOI] [PMC free article] [PubMed] [Google Scholar]
- Painter SD, Clough B, Black S, Nagle GT, 2003. Behavioral characterization of attractin, a water-borne peptide pheromone in the genus Aplysia. Biol Bull. 205 (1), 16–25. [DOI] [PubMed] [Google Scholar]
- Painter SD, Cummins SF, Nichols AE, Akalal D-B-G, Schein CH, Braun W, Smith JS, Susswein AJ, Levy M, de Boer PACM, ter Maat A, Miller MW, Scanlan C, Milberg RM, Sweedler JV, Nagle GT, 2004. Structural and functional analysis of Aplysia attractins, a family of water-borne protein pheromones with interspecific attractiveness. Proc. Natl. Acad. Sci. USA 101 (18), 6929–6933. [DOI] [PMC free article] [PubMed] [Google Scholar]
- Painter J, Merritt EA, 2006. Optimal description of a protein structure in terms of multiple groups undergoing TLS motion. Acta Crystallogr. D Biol. Crystallogr 62 (4), 439–450. [DOI] [PubMed] [Google Scholar]
- Pedrini B, Placzek WJ, Koculi E, Alimenti C, LaTerza A, Luporini P, Wüthrich K, 2007. Cold-adaptation in sea-water-borne signal proteins, sequence and NMR structure of the pheromone En-6 from the Antarctic ciliate Euplotes nobilii. J. Mol. Biol 372 (2), 277–286. [DOI] [PubMed] [Google Scholar]
- Pedrini B, Suter-Stahel T, Vallesi A, Alimenti C, Luporini P, 2017. Molecular structures and coding genes of the water-borne protein pheromones of Euplotes petzi, an early diverging polar species of Euplotes. J. Eukaryot. Microbiol 64 (2), 164–172. [DOI] [PubMed] [Google Scholar]
- Pettersen EF, Goddard TD, Huang CC, Couch GS, Greenblatt DM, Meng EC, Ferrin TE, 2004. UCSF Chimera–A visualization system for exploratory research and analysis. J. Comput. Chem 25 (13), 1605–1612. [DOI] [PubMed] [Google Scholar]
- Placzek WJ, Etezady-Esfarjani T, Herrmann T, Pedrini B, Peti W, Alimenti C, Luporini P, Wüthrich K, 2007. Cold-adapted signal proteins: NMR structures of pheromones from the Antarctic ciliate Euplotes nobilii. IUBMB Life 59 (8), 578–585. [DOI] [PubMed] [Google Scholar]
- Ricci F, Candelori A, Brandi A, Alimenti C, Luporini P, Vallesi A, 2019. The sub-chromosomic macronuclear pheromone genes of the ciliate Euplotes raikovi: comparative structural analysis and insights into the mechanism of expression. J. Eukaryot. Microbiol 66 (3), 376–384. [DOI] [PubMed] [Google Scholar]
- Ricci F, Luporini P, Alimenti C, Vallesi A, 2021. Functional chimeric genes in ciliates: An instructive case from Euplotes raikovi. Gene 767, 145186. [DOI] [PubMed] [Google Scholar]
- Sammito M, Millán C, Rodríguez DD, de Ilarduya IM, Meindl K, De Marino I, Petrillo G, Buey RM, de Pereda JM, Zeth K, Sheldrick GM, Usón I, 2013. Exploiting tertiary structure through local folds for crystallographic phasing. Nature Methods 10 (11), 1099–1101. [DOI] [PubMed] [Google Scholar]
- Sato S, Beakes G, Idei M, Nagumo T, Mann DG, Lobaccaro J-M, 2011. Novel sex cells and evidence for sex pheromones in diatoms. PLoS ONE 6 (10), e26923. [DOI] [PMC free article] [PubMed] [Google Scholar]
- Shorey HH, 1976. Animal Communication by Pheromones. Academic Press, New York. [Google Scholar]
- Stephens K, 1986. Pheromones among the prokaryotes. Crit. Rev. Microbiol 13, 309–334. [DOI] [PubMed] [Google Scholar]
- Vallesi A, Giuli G, Bradshaw RA, Luporini P, 1995. Autocrine mitogenic activity of pheromones produced by the protozoan ciliate Euplotes raikovi. Nature 376 (6540), 522–524. [DOI] [PubMed] [Google Scholar]
- Vallesi A, Ballarini P, Di Pretoro B, Alimenti C, Miceli C, Luporini P, 2005. Autocrine, mitogenic pheromone receptor loop of the ciliate Euplotes raikovi: pheromone-induced receptor internalization. Euk. Cell 4 (7), 1221–1227. [DOI] [PMC free article] [PubMed] [Google Scholar]
- Vallesi A, Alimenti C, Federici S, Di Giuseppe G, Dini F, Guella G, Luporini P, 2014. Evidence for gene duplication and allelic codominance (not hierarchical dominance) at the mating-type locus of the ciliate, Euplotes crassus. J. Eukaryot. Microbiol 61 (6), 620–629. [DOI] [PubMed] [Google Scholar]
- Weiss MS, Anderson DH, Raffioni S, Bradshaw RA, Ortenzi C, Luporini P, Eisenberg D, 1995. A cooperative model for receptor recognition and cell adhesion: evidence from the molecular packing in the 1.6-Å crystal structure of the pheromone Er-1 from the ciliated protozoan Euplotes raikovi. Proc. Natl. Acad. Sci. USA 92, 10172–10176. [DOI] [PMC free article] [PubMed] [Google Scholar]
- Winn MD, Ballard CC, Cowtan KD, Dodson EJ, Emsley P, Evans PR, Keegan RM, Krissinel EB, Leslie AGW, McCoy A, McNicholas SJ, Murshudov GN, Pannu NS, Potterton EA, Powell HR, Read RJ, Vagin A, Wilson KS, 2011. Overview of the CCP4 suite and current developments. Acta Crystallogr. D Biol. Crystallogr 67 (4), 235–242. [DOI] [PMC free article] [PubMed] [Google Scholar]
- Wyatt TD, 2014. Pheromones and Animal Behavior, Chemical Signals and Signature Mixes, 2nd ed. Cambridge University Press, Cambridge. [Google Scholar]
- Zahn R, Damberger F, Ortenzi C, Luporini P, Wüthrich K, 2001. NMR structure of the Euplotes raikovi pheromone Er-23 and identification of its five disulfide bonds. J. Mol. Biol 313, 923–931. [DOI] [PubMed] [Google Scholar]
Associated Data
This section collects any data citations, data availability statements, or supplementary materials included in this article.