

Abstract
The chemisorption phenomenon is widely used in the explanation of catalysis, gas–solid reactions, and gas sensing mechanisms. Generally, some properties of adsorbents, such as adsorption sites and dispersion, can be predicted by traditional methods through the variation of the chemisorption capacity with the temperature, pressure, and gas–solid interaction potential. However, these methods could not capture the information of the interaction between adsorbents, the adsorption rate, and the competitive adsorption relationship between adsorbents. In this paper, metal oxide semiconductors (MOSs) are employed to study the adsorption behavior. The gas sensing responses (GSRs) of MOSs caused by the gas adsorption process are measured as a new method to capture some adsorption behaviors, which are impossible for the traditional methods to obtain. The following adsorption behaviors characterized by this new method are presented for the first time: (1) distinguishing the adsorption type using an example of two reducing gases: the adsorption type of the two gases is single-molecular layer adsorption in this work; (2) detecting the interaction between different gases: this will be a promising method to provide original characterization data in the fields of gas–solid reaction mechanisms and heterogeneous catalysis; and (3) measuring the adsorption rate based on the GSR.
1. Introduction
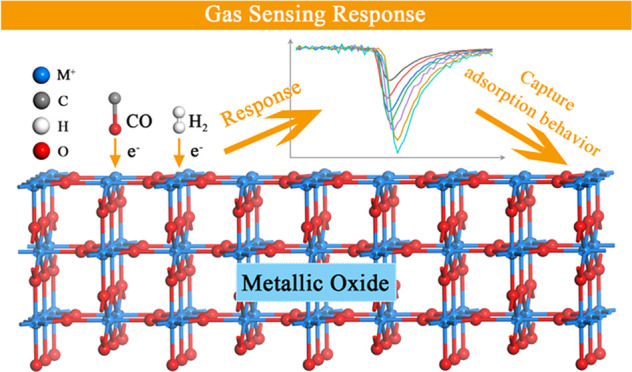
MOS-based materials have been extensively used for gas sensor application.1−3 Their operating mechanism can be simply formulated as follows. Oxidizing gases such as O2 adsorbed on the surface of SnO2 can capture free electrons from its conductivity band, which increases the electrical conductivity. Oppositely, reducing gases such as H2 and CO adsorbed on the surface of SnO2 can produce free electrons, which increases the electrical conductivity so as to achieve the purpose of gas detection.4−10 It is commonly accepted that the essence of the sensing behavior is the process of adsorption.
Otherwise, polyphase (gas–solid) catalysis converts reactant molecules into reaction products through a cycle of elementary steps. The catalytic process includes at least five steps: diffusion, adsorption, surface reaction, desorption, and reverse diffusion. Among them, adsorption is the most important link in the process of polyphase catalysis.11,12 Furthermore, the adsorption of reactant molecules on the catalyst surface determines the extent to which the reactant molecules are activated and the properties of the catalytic process, such as activity and selectivity. Also, adsorption can also be important evidence to analyze the gas–solid reaction mechanism.13 Therefore, it is of great significance to study the adsorption using a new method.
Over the years, researchers have used a variety of modern spectroscopy technologies including various spectroscopic techniques and surface morphology detection techniques to obtain the adsorption behavior.14−16 Among them, the in situ experimental method mainly adopts the programmed temperature analysis technique (TPAT) to study the chemical adsorption behavior. Programmed temperature-rise technology mainly includes programmed temperature-rise desorption (TPD), reduction (TPR), oxidation (TPO), and surface reaction (TPSR). This technique characterizes the adsorption behavior by the change of the gas adsorption quantity during the adsorption or desorption process. However, there is another important characteristic in the process of adsorption: the exchange or coexistence of electrons between the gas adsorbent and solid surface; due to the existence of an uneven field on the solid surface, atoms on the surface often have the remaining bonding capacity. Thus, the adsorption of gas on the semiconductor can cause some physical properties to change. For example, adsorption of gas on the semiconductor can cause the surface conductivity to change, which makes MOSs widely applicable as gas sensors.17−19 However, thus far, there is no report characterizing the adsorption behavior by employing the GSR.
In this paper, GSRs caused by the adsorption process are employed as a new method to capture some adsorption behaviors, which are impossible for the traditional methods to obtain. Based on the new method, three adsorption data mentioned above cannot be captured using traditional chemisorption instruments or other methods. Above all, the device in this work measures the change of the GSR during the adsorption process to capture adsorption information, which is reported for the first time.
2. Experimental Section
First, 5 g of tin tetrachloride pentahydrate (SnCl4·5H2O) was dissolved in 100 mL of deionizing water, 0.5 g of citric acid (C6H8O7·H2O) was added as a dispersant, and 0.5 mol/L ammonia water was used as a precipitant to prepare the tin hydroxide precipitate. The precipitate was aged for 12 h, and the chloride ions were removed by washing several times. The precipitate was heated to 60 °C and dissolved in saturated oxalic acid (H2C2O4·2H2O) until the precipitate was completely dissolved, and transparent SnO2 sol was obtained. The transparent SnO2 sol obtained by adding saturated polyethylene glycol as a surfactant was placed in a drying box and dried at 80 °C for 72 h to obtain the SnO2 gel precursor. The obtained dry gel was incubated at 600 °C for 2 h to obtain SnO2 nanopowder. The working conditions of the sensor are as follows: The sensing adsorption materials are tested in dry air at 400 °C. The gas concentration is presented in all figures. The test instrument and process can be seen in our previous work,3 as shown in Figure 1. The test system consists of two gas distribution devices, a test chamber, and an electrochemical workstation. The electrochemical workstation and the sensor element are connected with platinum wire electrodes, and the outlet of the secondary gas distribution device is connected with the test chamber. The system can achieve continuous and accurate gas distribution and testing of a wide range of target gases.The maximum flow rate of target gas such as H2 and CO controlled by MFC2 and MFC3 is 20 mL/min. The maximum flow rate of background gas such as Air, N2 and O2 controlled by MFC1 and MFC4 is 1000 mL/min. Thus, based on the test instrument, different concentration of target gas can be obtained accurately.
Figure 1.

Schematic diagram of the measurement apparatus for the gas adsorption sensing response.
3. Results and Discussion
Figure 2 represents the GSR after different gases are passed onto the surface of SnO2 in different orders. First, 10 ppm H2 is injected into the test furnace in which the SnO2 materials are present. After the H2 is absorbed onto the SnO2 surface and reaches adsorption equilibrium, 420 ppm CO is injected into the test furnace. After the two gases reach adsorption equilibrium, the SnO2 current can be indexed as C1. Then, the two gases are removed at the same time, and the SnO2 current returns to the ground state. Second, the ventilation sequence is reversed, that is, first, 420 ppm CO is injected into the test furnace, followed by 10 ppm H2; after the two gases reach adsorption equilibrium, the SnO2 current now can be indexed as C2. Interestingly, the two currents C1 and C2 under these two situations are the same. This indicates that the final state of CO and H2 coadsorption is independent of the adsorption order. It also indicates that the adsorption of CO and H2 is single-molecular layer adsorption, which can also be inferred further as follows. If the adsorption process belongs to multimolecular layer adsorption, CO and H2 adsorbed on the SnO2 surface will have different adsorption layer structures due to the different adsorption sequences, so the SnO2 current C1 and C2 should be totally different. Therefore, the single-adsorption layer of gas adsorption can be inferred by GSR (here, SnO2 current). To verify the conclusion, other two cases such as 100 ppm H2 and 300 ppm CO and 50 ppm H2 and 150 ppm CO are passed onto the surface of SnO2 in different orders, as presented in Figure 1b,c. The same conclusion as in Figure 1a is obtained. This adsorption information cannot be captured using traditional chemisorption instrument.
Figure 2.

Gas sensing response caused by (a) 10 ppm H2 and 420 ppm CO, (b) 100 ppm H2 and 300 ppm CO, and (c) 50 ppm H2 and 150 ppm CO adsorption after they are passed onto the surface of SnO2 in different orders in the air background.
Figure 3 represents the GSR caused by H2 and CO after they are passed onto the surface of SnO2 in different orders. First, 10 ppm H2 is injected into the test furnace in which the SnO2 materials are present. After the H2 is absorbed on the SnO2 surface and reaches adsorption equilibrium, the SnO2 current can be indexed as D1. Then, another 30 ppm H2 is injected into the test furnace. After the above-mentioned 40 ppm H2 gases reach adsorption equilibrium, the SnO2 current can be indexed as D2. Then, the 40 ppm H2 is removed, and the SnO2 current returns to the ground state. Second, 440 ppm CO is injected into the test furnace to make the current same as the current caused by 10 ppm H2, indexed as D3, and then, 30 ppm H2 is injected into the test furnace; after the mixture of 440 ppm CO and 30 ppm H2 reaches adsorption equilibrium, the SnO2 current now can be indexed as D4. Interestingly, the response change caused by 30 ppm H2 under the condition that the same current caused by 10 ppm H2 or 440 ppm CO previously is not the same can be indexed as ΔA and ΔB, respectively, as shown in Figure 3. There is a slight difference between ΔA and ΔB, which may indicate that there are small interactions between CO and H2. Therefore, the interaction between multicomponent gases during coadsorption can be inferred from the gas sensing behavior. This adsorption information cannot be captured using traditional chemisorption instruments or other methods.
Figure 3.

Gas sensing response caused by H2 and CO adsorption after they are passed onto the surface of SnO2 in different orders in the air background.
Figure 4a represents the GSR caused by the adsorption of 100, 200, 300, 400, and 500 ppm H2 on the SnO2 sample surface under different carrier gas conditions. The curve in Figure 4a is fitted with the empirical formula R = 1 + KCn(20) to obtain the quantitative relationship equation between the response value and the gas concentration, as shown in Figure 4b, where R represents the response of SnO2, that is, the air-divided resistance in H2, C is the gas concentration, and n is the exponent of the gas concentration. Taking the logarithm of both sides of R = 1 + KCn, the n values are obtained. It can be found that the n value has a small relationship with the oxygen concentration in different carrier gases, which may indicate that the adsorption site of O2 is totally different from that of H2. Thus, the adsorption site and the adsorption behavior between two homogeneous gases can be obtained by evaluating the n value.1,21,22
Figure 4.

(a) Gas sensing electronic signal caused by H2 adsorption in different oxygen concentrations. (b) n values obtained by taking the logarithm of both sides of R = 1 + KCn.
Figure 5 shows the adsorption sensing response kinetic curve of H2 on the SnO2 surface obtained by the GSR. The adsorption sensing response kinetic curve is obtained from Figure 4a as follows: taking the derivative of resistance with respect to time (dR/dt) versus time. From the figure, we can obtain the adsorption sensing response kinetic behavior of the H2 gas in different oxygen concentrations. From the curves, we can see that with the increase of oxygen concentrations, the adsorption sensing response kinetics of H2 decreases obviously. This is a new method to analyze the adsorption sensing response kinetic behavior in different gas concentrations. Above all, all the methods reported in this work may be promising to be employed in the explanation of catalysis, gas–solid reactions, and gas sensing mechanisms.
Figure 5.

Adsorption sensing response velocity curve of H2 on the SnO2 surface obtained by the GSR.
4. Conclusions
In this paper, GSRs caused by the adsorption process are employed as a new method to capture some adsorption behaviors, which are impossible for the traditional methods to obtain. The following adsorption behaviors characterized by this new method are presented for the first time: (1) distinguishing the adsorption type using the examples of H2 and CO: the single-adsorption layer of gas adsorption can be inferred by the GSR; (2) detecting the interaction between different gases: the interaction between multicomponent gases during coadsorption can be inferred from the gas sensing behavior; and (3) measuring the adsorption sensing response velocity based on the GSR. These three adsorption data mentioned above cannot be captured using traditional chemisorption instruments or other methods. Above all, the device in this work measures the change of the GSR during the adsorption process to capture adsorption information, which is reported for the first time. These methods will be promising to provide original characterization data in the research fields such as heterogeneous catalysis, gas–solid reactions, and gas sensing mechanisms.
Acknowledgments
Financial support is provided by the National Natural Science Foundation of China (Grant Nos. 51874169, 51974157, 52074153, 11674145), the Natural Science Foundation of Shandong Province (No. ZR2020KF025), and the Research Foundation for Advanced Talents of Ludong University (No. ZR2021019). We also thank the support of Shandong Youth Innovation Team Introduction and Education Program.
The authors declare no competing financial interest.
References
- Shimizu Y.; Nakamura Y.; Egashira M. Effects of diffusivity of hydrogen and oxygen through pores of thick film SnO2 based sensors on their sensing properties. Sens. Actuators, B 1993, 13, 128–131. 10.1016/0925-4005(93)85342-8. [DOI] [Google Scholar]
- Yin X.-T.; Li J.; Dastan D.; Zhou W. D.; Garmestani H.; Alamgir F. M. Ultra-high selectivity of H2 over CO with a p-n nanojunction based gas sensors and its mechanism. Sens. Actuators, B 2020, 319, 128330 10.1016/j.snb.2020.128330. [DOI] [Google Scholar]
- Yin X.-T.; Li J.; Wang Q.; Dastan D.; Shi Z.-C.; Alharbi N.; Garmestani H.; Tan X.-M.; Liu Y.; Ma X.-G. Opposite sensing response of heterojunction gas sensors based on SnO2–Cr2O3 nanocomposites to H2 against CO andits selectivity mechanism. Langmuir 2021, 37, 13548–13558. 10.1021/acs.langmuir.1c01706. [DOI] [PubMed] [Google Scholar]
- Yamazoe N.; et al. Effect of additives on semiconductor gas sensors. Sens. Actutors 1983, 4, 283–289. 10.1016/0250-6874(83)85034-3. [DOI] [Google Scholar]
- Strässler S.; Reis A. Simple models for N-type metal oxide gas sensors. Sens. Actuators 1983, 4, 456–472. 10.1016/0250-6874(83)85058-6. [DOI] [Google Scholar]
- Morrison S. R. Selectivity in semiconductor gas sensors. Sens. Actuators 1987, 12, 425–440. 10.1016/0250-6874(87)80061-6. [DOI] [Google Scholar]
- Kohl D. Surface processes in the detection of reducing gases with SnO2-based devices. Sens. Actuators B 1989, 18, 71–113. 10.1016/0250-6874(89)87026-X. [DOI] [Google Scholar]
- Yamazoe N. New approaches for improving semiconductor gas sensors. Sens. Actuators B 1991, 5, 7–19. 10.1016/0925-4005(91)80213-4. [DOI] [Google Scholar]
- Shimizu Y.; Kuwano N.; Hyodo T.; Egashira M. High H2 sensing performance of anodically oxidized TiO2 film contacted with Pd. Sens. Actuators, B 2002, 83, 195–201. 10.1016/S0925-4005(01)01040-1. [DOI] [Google Scholar]
- Bârsan N.; Hübner M.; Weimar U. Conduction mechanisms in SnO2 based polycrystalline thick film gas sensors exposed to CO and H2 in different oxygen backgrounds. Sens. Actuators, B 2011, 157, 510–517. 10.1016/j.snb.2011.05.011. [DOI] [Google Scholar]
- Rong F.; Zhao J.; Su P.; Yao Y.; Li M.; Yang Q.; Li C. Zinc–cobalt oxides as efficient water oxidation catalysts: the promotion effect of ZnO. J. Mater. Chem A 2015, 3, 4010–4017. 10.1039/C4TA06527A. [DOI] [Google Scholar]
- Yang C.; Wang J.; Fan H. L.; Shangguan J.; Mi J.; Huo C. Contributions of tailored oxygen vacancies in ZnO/Al2O3 composites to the enhanced ability for H2S removal at room temperature. Fuel 2018, 215, 695–703. 10.1016/j.fuel.2017.11.037. [DOI] [Google Scholar]
- Haerifar M.; Azizian S. Mixed surface reaction and diffusion-controlled kinetic model for adsorption at the solid/solution interface. J. Phys. Chem. C 2013, 117, 8310–8317. 10.1021/jp401571m. [DOI] [Google Scholar]
- Yu L.; Wang L.; Xu W.; Chen L.; Fu M.; Wu J.; Ye D. Adsorption of VOCs on reduced graphene oxide. J. Environ. Sci. 2018, 67, 171–178. 10.1016/j.jes.2017.08.022. [DOI] [PubMed] [Google Scholar]
- Zaera F. The surface chemistry of metal-based hydrogenation catalysis. ACS Catal. 2017, 7, 4947–4967. 10.1021/acscatal.7b01368. [DOI] [Google Scholar]
- Arvaniti I.; Netos V.; Siokos V.; Metaxa E.; Kalantzopoulou F. R. Relation between adsorption and catalysis in the case of NiO and Co3O4. Appl. Surf. Sci. 2010, 256, 5559–5565. 10.1016/j.apsusc.2009.12.147. [DOI] [Google Scholar]
- Muttakin M.; Pal A.; Rupa M. J.; Ito K.; Saha B. B. A critical overview of adsorption kinetics for cooling and refrigeration systems. Adv. Colloid Interface Sci. 2021, 294, 102468 10.1016/j.cis.2021.102468. [DOI] [PubMed] [Google Scholar]
- Rupa M. J.; Pal A.; Mitra S.; Saha B. B. Time adapted linear driving force model for gas adsorption onto solids. Chem. Eng. J. 2021, 420, 129785 10.1016/j.cej.2021.129785. [DOI] [Google Scholar]
- Rupa M. J.; Pal A.; Saha B. B. Activated carbon-graphene nanoplates based green cooling system: Adsorption kinetics, heat of adsorption, and thermodynamic performance. Energy 2020, 193, 116774 10.1016/j.energy.2019.116774. [DOI] [Google Scholar]
- Yin X.-T.; Lv P.; Li J.; Jafari A.; Wu F.-Y.; Wang Q.; Dastan D.; Shi Z.-C.; Yu S.-T.; Garmestani H. Nanostructured tungsten trioxide prepared at various growth temperatures for sensing applications. J. Alloys Compd. 2020, 825, 154105 10.1016/j.jallcom.2020.154105. [DOI] [Google Scholar]
- Shimizu Y.; Maekawa T.; Nakamura Y.; Egashira M. Effects of gas diffusivity and reactivity on sensing properties of thick film SnO2-based sensors. Sens. Actuators, B 1998, 46, 163–168. 10.1016/S0925-4005(97)00247-5. [DOI] [Google Scholar]
- Yin X.-T.; Zhou W.-D.; Li J.; Wang Q.; Wu F.-Y.; Dastan D.; Wang D.; Garmestani H.; Wang X.-M.; Talu S. A highly sensitivity and selectivity Pt-SnO2 nanoparticles for sensing applications at extremely low level hydrogen gas detection. J. Alloys Compd. 2019, 805, 229–236. 10.1016/j.jallcom.2019.07.081. [DOI] [Google Scholar]