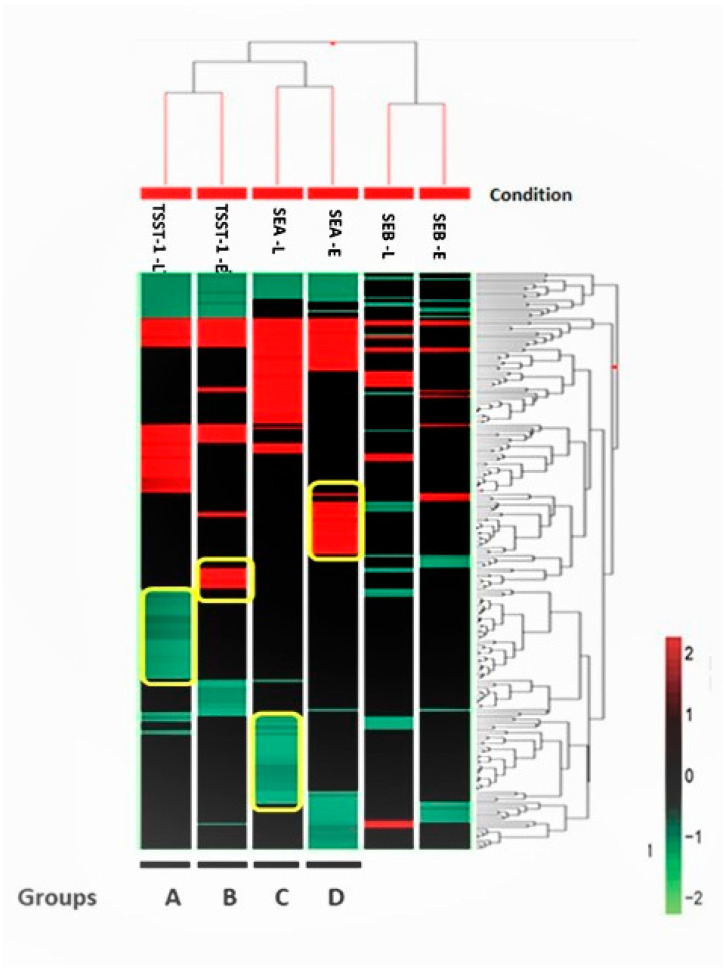
Figure 2.
Hierarchical clustering analysis using of 217 genes with a log2 fold change > |2| enriching the necrosis pathway. The Euclidian algorithm was used to sort both conditions and genes. Each block represents one gene, and its color code is at the bottom right. Clusters bordered by yellow lines represent those genes which were potentially unique signatures of the particular condition. The conditions from left to right are named as TSST-1-L, TSST-1-E, SEA-L, SEA-E, SEB-L, and SEB-E, which represent TSST-1 at the late time point, TSST-1 at the early time point, SEA at the late time point, SEA at the early time point, SEB at the late time point, and SEB at the early time point, respectively.

