Abstract
Monitoring and detection of cyanide are of crucial interest as the latter plays versatile roles in many biological events, is ubiquitous in environment, and responsible for several acute poisoning and adverse health effects if ingested. We describe herein the synthesis and characterization of novel phenothiazine-based push–pull chromogenic chemosensors suitable for naked eye cyanide sensing. Indeed, specific detections were achieved for cyanide with a LOD of ca 9.12 to 4.59 µM and, interestingly, one of the new chemosensors has also revealed an unprecedented affinity for acetate with a LOD of ca 2.68 µM. Moreover, as proof of concept for practical applications, a paper test strip was prepared allowing its use for efficient qualitative naked eye cyanide sensing.
Keywords: push–pull, chromophore, phenothiazine, cyanide, acetate, optical detection
1. Introduction
Anionic species are a major class of structures involved in many physiological, biological, chemical, and environmental events and processes [1]. Owing to their central roles, the design and synthesis both of artificial and bioinspired probes of anion is of crucial interest for their detection in real samples [2]. Among them, cyanide constitutes one of the most toxic anionic species because it is able to readily bind hemoglobin’s iron and interferes with many vital processes [3,4,5]. Nevertheless, despite its harmful effects, it is still widely used in mining or metallurgical industries and in plastic production plants. Thus, industrial accidents or ineffective effluent treatments are the main sources of large cyanide spills into water and environment. According to the WHO, cyanide concentration should not exceed 1.9 µM in drinking water [6]. In addition, accidental ingestion from the cyanogenesis of cyanogenic glycosides present in stone fruit kernels (bitter almonds, apricot), cassava, sorghum, linseed, etc. is also responsible of acute poisoning [7] requiring the development of efficient and reliable sensing tools.
During the last decades, important efforts have been devoted to developing efficient analytical techniques such as ion chromatography coupled with pulse amperometric detection [8] or capillary electrophoresis [9] but they require sophisticated equipment, expert manpower, and are time-consuming. In addition, a preconcentration or a filtering step is usually needed, acting as a drag in real-time detection or analysis at the point-of-need. To overcome these issues, scientists have strived to design and develop optical probes for fast cyanide sensing [2,10]. In peculiar, naked eye techniques based on colorimetric sensors are more suitable for in situ sensing and have drawn deep attention due to their low-cost instrumentation, ease-of-use, nondestructive determination, specificity, and selectivity.
To this aim, supramolecular chemistry based on noncovalent interactions has aroused particular interest in anion sensing [11]. Indeed, a host–guest recognition induces some photophysical changes associated with a detectable optical output signal. Based on their structures and mode of action, those chromogenic/fluorogenic chemosensors are categorized in different categories, namely, two- or three-component, multicomponent, and inorganic–organic hybrid, which have been exploited and used in cyanide sensing [10,12,13,14]. Furthermore, putative competitive ions remain one of the main problems to be solved in order to improve the specificity and selectivity toward the desired analyte. For this purpose, the nucleophilic properties of cyanide have been exploited in order to avoid or limit the competition of interferent ions. Those include the nucleophilic substitution reactions of the cyanide with a variety of electron poor chemical structures such as squaraine [15], acridinium [16], pyrylium [17], indolium [18], oxazine [19], trifluoroacetamide or trifluoroacetophenone derivatives [20], dicyanovinyl electrophilic groups derivatives [21], and so on. Although, important improvements achieved in the design and synthesis of naked eye-based chemosensors is still of great interest, with the main challenge to conceive structures exhibiting high sensitivity and selectivity.
Considering its intrinsic optical properties, phenothiazine constitutes a promising candidate as signaling scaffold for the development of optical chemosensors. Phenothiazine acts as electron donor due to the presence of electron-rich nitrogen and sulfur atoms. We sought to combine the aromatic core with different electron-withdrawing groups, as recognition moiety, in order to synthesize novel phenothiazine-based push–pull (D-π-A) chemosensors that will be optically sensitive to the nucleophilic addition of the cyanide. Interestingly, few phenothiazine derivatives [22,23,24,25,26,27,28,29,30,31,32,33] have been designed and synthetized for cyanide sensing and all are based on the direct substitution of the phenothiazine scaffold with electron-poor aromatic rings. Based on these considerations, we report herein on the synthesis of a set of new push–pull chromophores, where the substitution with dicyano-based acceptors occurred at the nitrogen position linked to a benzene ring as electron relay between the donor and acceptor parts. In addition, the functionalization of the phenothiazine pattern at the nitrogen atom vanished its intrinsic fluorescence properties, making the newly synthetized compounds as only colorimetric sensors.
2. Materials and Methods
2.1. General
All reactants and solvents were analytical grade, purchased from Alfa Aesar and used as received. Acetonitrile spectrophotochemical grade was used for the optical properties and electrochemical analysis. The salt solutions of PF6−, Cl−, Br−, CN−, HSO4−, NO2−, and CH3CO2− were prepared from their respective tetrabutylammonium derivatives. UV–visible absorption spectra were obtained on a Varian Cary 1E spectrophotometer at room temperature. Limit of detection (LOD) was determined according to the formula given by the IUPAC [34,35]. LODu = 3.3 sy/x (1 + h0 +1/I)1/2/m, where sy/x is the residual standard deviation, h0 is the leverage of the sample, m is the regression slope, and I is the number of samples. NMR spectra were recorded on a JEOL ECS400 NMR spectrometer at room temperature. Electrochemical studies were performed on a VersaSTAT 4 potentiostat from Princeton Applied Research (Hi Tech Detection Systems, Massy, France ). A three-electrode system based on a platinum (Pt) working electrode (ø: 1.6 mm), a Pt counter electrode, and an Ag/AgCl reference electrode was used. Bu4N+PF6− served as a supporting electrolyte (0.1 M). All experiments were carried out in CH3CN at 20 °C. Electrochemical potential values versus Ag/AgCl were determined from the cyclic voltammogram at a concentration of 1.10−3 M with a scan rate of 100 mV·s−1. NMR chemical shifts are given in ppm (δ) relative to Me4Si with solvent resonances used as internal standards (CD2Cl2 5.32 ppm for 1H and 53.5 for 13C; CD3CN: 1.93 ppm for 1H and 1.30; 117.7 for 13C; DMSO-d6: 2.50 ppm for 1H and 39.5 for 13C). The electronic absorption maxima (λmax) are directly extracted from absorption spectra of the tested molecules. Under the optimum conditions, the stoichiometry between the synthesized chemosensors and the different analytes were investigated by the molar ratio method by UV−visible spectroscopy. Melting points were uncorrected and obtained from a Stuart melting point apparatus SMP30. High-resolution mass spectrometry (HRMS) was performed on a SYNAPT G2 HDMS (Waters) spectrometer with an electrospray ionization source (ESI) and a TOF mass analyzer at Aix-Marseille Université Spectropole [36]. The structures and energy levels of the target compounds were calculated using the B3LYP/6-31G* level of theory and method implemented in the Gaussian 09 package. The theoretical spectrum was obtained with a Matlab script using the lsqnonlin function from the experimental data, stoichiometry, and molar extinction coefficient of the studied chromophores according to reference. A detailed description is given in the Supplementary Material Information.
2.2. Synthesis
4-(10H-Phenothiazine-10-yl) Benzaldehyde (1). In a 50-mL round flask, phenothiazine (2.440 g, 12.0 mmol), 4-bromebenzaldehyde (2.523 g, 12.3 mmol), palladium acetate (0.225 g, 1.0 mmol), tri-tert-butylphosphine (297 μL, 1.2 mmol), and anhydrous K2CO3 (4.188 g, 30.0 mmol) were dissolved in 20 mL of dry toluene and heated at 110 °C under an argon atmosphere for 24 h. After removing the excess of solvent, 30 mL of a 2 M aqueous HCl solution was added then extracted with 40 mL of ethyl acetate (3×) and the organic phases were dried over MgSO4. The obtained brownish oil was further purified by column chromatography over SiO2 using ethyl acetate/petroleum ether 1:4 as eluent (Rf = 0.4). Recrystallisation in pentane gives 2.840 g of a beige solid (yield 76%). 1H-NMR (CD3CN, 400 MHz). δ 9.84 (s, 1H), 7.77 (m, 2H), 7.47 (dd, J = 7.7, 1.3, 2H), 7.33 (dtd, J = 9.5, 8.1, 1.4, 4H), 7.23 (m, 2H), 7.15 (m, 2H). 13C-NMR (CD3CN, 101 MHz, ppm). δ 191.66 (-CHO), 151.02 (N-C), 142.26 (N-C), 132.68, 132.36 (Ar-C), 131.79 (Ar-C), 129.51 (Ar-C), 128.62 (S-C), 127.05 (Ar-C), 126.47 (Ar-C). Mass analysis: [M + H]+ m/z 304.1, [2M + 1]+; 607.2. Elemental analysis for C19H13ONS: Calculated, C—75.22, H—4.32, O—5.27, N—4.62, S—10.57; found, C—75.17, H—4.32, O—5.67, N—4.53, S—10.31. Melting point: 106.6 °C.
2-(4-(10H-Phenothiazin-10-yl)benzylidene)malononitrile (6). In a 25-mL round flask, 4-(10H-phenothiazine-10-yl) benzaldehyde 1 (303,4 mg, 1.0 mmol) and malononitrile 3 (233.6 mg, 3.5 mmol) were dissolved in 12 mL of absolute ethanol and heated at 85 °C under an argon atmosphere for 24 h. After removing the excess solvent, the solid was purified by column chromatography over SiO2 using CH2Cl2/C6H12 (1:1) as eluent (Rf = 0.35) affording 218.4 mg of an orange solid (yield 62%). 1H-NMR ((CD3)2SO, 400 MHz). δ 8.30 (s, 1H), 7.87 (d, J = 9.05, 2H), 7.62 (dd, J = 0.91, 7.71, 2H), 7.56 (dd, J = 0.54, 7.72, 2H), 7.47 (td, J = 1.17, 7.78, 2H), 7.35 (td, J = 0.89, 7.75, 2H), 7.11 (d, J = 9.04, 2H). 13C-NMR. ((CD3)2SO, 101 MHz, ppm). δ 159.79 (=CH), 150.01 (Ar-C), 139.82 (Ar-C), 133.25 (Ar-C), 132.85 (Ar-C), 129.05 (Ar-C), 129.04 (Ar-C), 126.90 (Ar-C), 114.96 (Ar-C), 114.22 (Ar-C), 115.15 (-CN), 75.36 (=C). Elemental analysis for C22H13N3S-0.05 CH2Cl2-0.1C6H12: Calculated, C—74.72, H—3.96, N—11.54, S—8.81; found, C—74.52, H—3.65, N—11.71, S—8.42. HRMS (ESI+): Calculated for C22H13N3S (m/z 351.0830), [M + H]+ 352.0903; found, [M + H]+ 352.0901. Melting point: 220.3 °C.
(Z)-2-(2-(4-(10H-Phenothiazin-10-yl)benzylidene)-3-oxo-2,3-dihydro-1H-inden-1-ylidene)malononitrile (7). In a 25-mL round flask, 4-(10H-phenothiazine-10-yl) benzaldehyde 1 (189.61 mg, 0.625 mmol) and 2-(3-oxo-2,3-dihydro-1H-inden-1-ylidene)malononitrile 4 (97.1 mg, 0.5 mmol) were dissolved in 4 mL of acetic anhydride and heated at 100 °C for 3 days. After removing the excess solvent, the solid was washed using a mixture of C6H14/acetone (7:1) affording 140.5 mg of a red solid (yield 58%). 1H-NMR. (CD2Cl2, 400 MHz) δ 8.62 (d, J = 7.8 Hz, 1H), 8.43 (s, 1H), 8.18 (d, J = 9.1 Hz, 2H), 7.85 (dd, J = 6.9, 1.7 Hz, 1H), 7.73 (dqd, J = 14.4, 7.4, 1.2 Hz, 2H), 7.51 (ddd, J = 7.6, 4.2, 1.1 Hz, 4H), 7.39 (td, J = 7.7, 1.4 Hz, 2H), 7.26 (td, J = 7.7, 1.2 Hz, 2H), 7.11 (d, J = 9.1 Hz, 2H). 13C-NMR. (CD2Cl2, 101 MHz, ppm) δ 187.16, 163.05, 150.90, 147.38, 140.35, 139.99, 137.78, 135.37, 134.77, 129.36, 127.84, 127.18, 126.32, 125.93, 125.29, 124.12, 115.18, 114.90, 114.51, 70.33. Elemental analysis for C31H17N3OS, 1.7 H2O: Calculated, C—72.98, H—4.03, N—8.24, S—6.28; found, C—72.26, H—3.27, N—8.25, S—6.01. HRMS (ESI+): Calculated for C31H17ON3S (m/z 479.1092), [M + H]+ 480.1165; found, [M + H]+ 480.1164. Melting point: 234.6 °C.
2,2′-(2-(4-(10H-Phenothiazin-10-yl)benzylidene)-1H-indene-1,3(2H)-diylidene)dimalononitrile (8). In a 10-mL round flask, 4-(10H-phenothiazine-10-yl) benzaldehyde (189.6 mg, 0.625 mmol), 2,2′-(1H-indene-1,3(2H)-diylidene)dimalononitrile 5 (121.1 mg, 0.5 mmol), and a catalytic amount of piperidine were dissolved in 5 mL of acetic anhydride and heated at 38 °C for 24 h. After removing the excess solvent in a rotatory evaporator, the solid was dissolved in 100 mL of dichloromethane and washed with 60 mL of distillated water (3×). The organic phase was dried with MgSO4 and the solvent was removed. The crude was further purified by silica column chromatography using CH2Cl2/C6H12 (3:2) as eluent (Rf = 0.53). The grayish green solid was washed with diethyl ether to obtain 69.1 mg (yield 26%). 1H-NMR. (CD2Cl2, 400 MHz) δ 8.65 (d, J = 7.4 Hz, 1H), 8.46 (s, 1H), 8.21 (d, J = 9.1 Hz, 2H), 7.91 ñ 7.84 (m, 1H), 7.76 (dqd, J = 14.4, 7.4, 1.3 Hz, 2H), 7.54 (ddd, J = 7.6, 4.5, 1.2 Hz, 4H), 7.42 (td, J = 7.7, 1.4 Hz, 2H), 7.29 (td, J = 7.6, 1.3 Hz, 2H), 7.14 (d, J = 9.2 Hz, 2H). 13C-NMR. (CD2Cl2, 101 MHz, ppm) δ 144.85, 140.46, 134.82, 133.99, 133.75, 129.07, 128.01, 127.57, 126.70, 126.41, 126.30, 116.33, 113.70, 77.37. Elemental analysis for C34H17N5S-0.1 C4H10O-0.45 H2O: Calculated, C—76.07, H—3.51, N—12.89, S—5.90; found, C—75.70, H—3.14, N—12.87, S—5.55. HRMS (ESI+): Calculated for C34H17N5S (m/z 527.1205), [M + NH4]+ 545.1543; found, [M + NH4]+ 545.1545. Melting point: 287.7 °C.
3. Results and Discussion
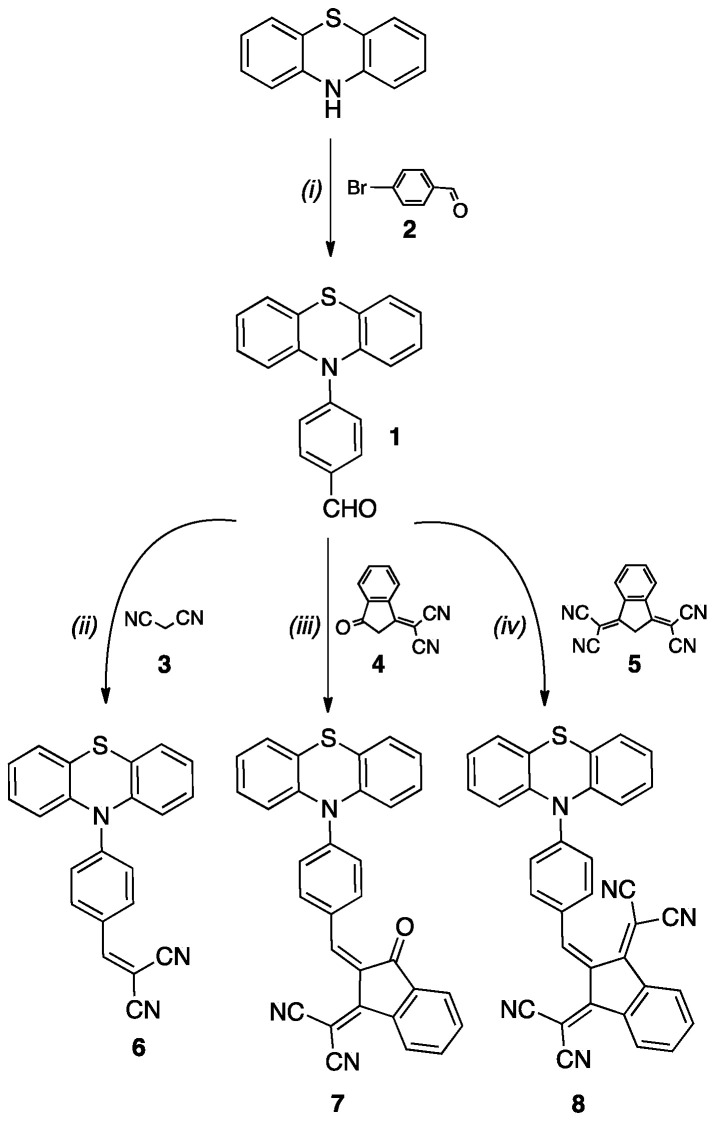
Straightforward synthesis of the titled derivatives has been achieved in 3 steps starting from commercially available phenothiazine (Scheme 1). Compound 1 was readily prepared with 76% yield according to reported procedures from phenothiazine and 4-bromobenzaldehyde 2 [37]. The corresponding aldehyde 1 was subsequently reacted with active methylene groups of acceptors moieties, i.e., malononitrile (3), 3-dicyanomethylidene-1-indanone (4), and 1,3-bis(dicyanomethylidene)indane (5), affording the push–pull chromophores 6, 7, and 8 with 62%, 58%, and 26% yield, respectively. The two indane-based acceptors were synthetized from 1,3-indanedione and malononitrile [38]. The conditions used for the Knoevenagel’s condensation reactions were adapted accordingly to the nature of the acceptor moiety, i.e., refluxing ethanol for malononitrile, refluxing acetic anhydride for 3-dicyanomethylidene-1-indanone, and refluxing acetic anhydride in the presence of piperidine for 1,3-bis(dicyanomethylidene) indane [39]. All synthetized chromophores were characterized by 1H, 13C NMR, high-resolution mass spectrometry, and elemental analysis.
Scheme 1.
(i) Pd(OAc)2, tertBu3P, K2CO3, Toluene 110 °C, 24 h (76%); (ii) malononitrile (3), EtOH 85 °C, 24 h (62%); (iii) 3-dicyanomethylidene-1-indanone (4) Ac2O 100 °C, 3 days (58%); (iv) 1,3-bis(dicyanomethylidene)indane (5), Ac2O 40 °C piperidine cat., 24 h (26%).
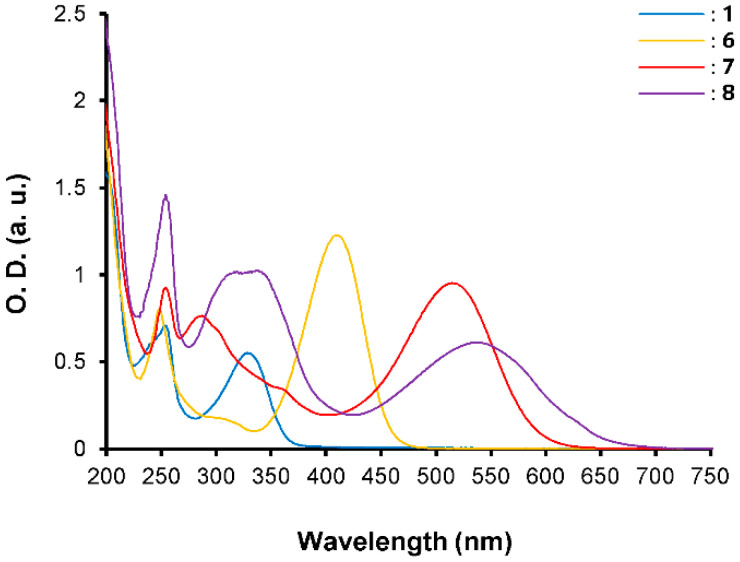
Optical properties of the synthetized compounds 6–8 have been investigated by absorption spectroscopy in acetonitrile at a concentration of ca 1.40 × 10⁻⁵ M. All compounds exhibit a broad and intense band at low energy related to the internal charge transfer (ICT) taking place from the electron-rich phenothiazine unit to the electron withdrawing unit. The ICT band is red-shifted from 6 to 8 evidencing the higher electron affinity for the 1,3-bis(dicyanomethylidene)indane acceptor, which is corroborated with the electrochemical data (Table 1, Figure 1). Thus, compound 6 exhibits an ICT band centered at 410 nm (ε = 86,830 M−1), while for 7 the ICT is centered at 514 nm (ε = 67,470 M−1) and 8 at 531 nm (ε = 43,290 M−1).
Table 1.
Spectroscopic a and electrochemical b data for phenothiazine-based chemosensors 6–8.
| λmax (nm) |
E°Ox1 (V) |
E°Ox2 c (V) |
E°Red (V) |
E°Ox1ONSET (V) |
E°RedONSET (V) |
Egelec (eV) |
|
|---|---|---|---|---|---|---|---|
| 6 | 410 | 0.90 | 1.51 | −1.01 | 0.76 | −0.94 | 1.70 |
| 7 | 514 | 0.85 | 1.51 | −0.57 | 0.74 | −0.47 | 1.21 |
| 8 | 531 | 0.84 | 1.50 | −0.39 | 0.71 | −0.27 | 0.98 |
a 1.41 × 10⁻⁵ mol L−1 in CH3CN. b 10−3 M in nBu4NPF6 (0.1 M) in CH3CN, scan rate 100 mV s−1, E° versus Ag/AgCl (0.1 M). c shoulder at 1.42 V.
Figure 1.
UV–vis spectra for compounds 1 and 6–8 in CH3CN at [C] = ca 1.40 × 10⁻⁵ M.
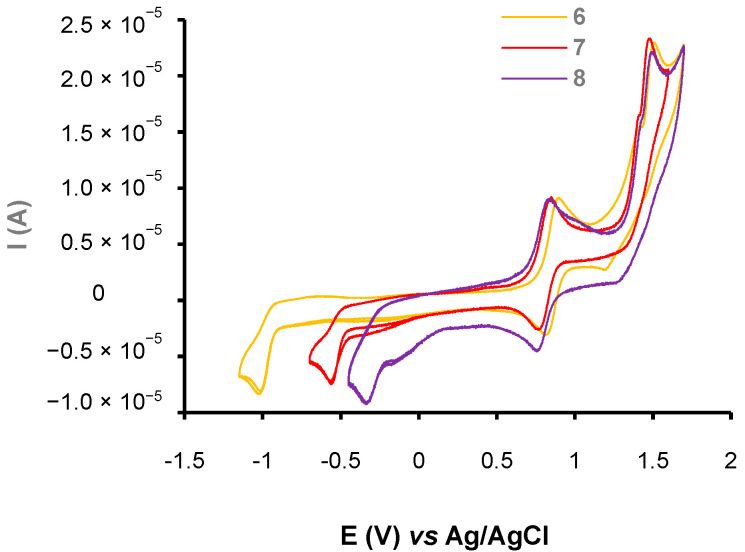
The electrochemical behavior of the phenothiazine-based chromophores 6–8 has been evaluated by cyclic voltammetry in acetonitrile and the data are compiled in Table 1. The cyclic voltammograms (CV, Figure 2) of compounds 6–8 present one reversible oxidation peak at 0.90, 0.85, and 0.83 V, respectively, vs. Ag/AgCl associated to the formation of the radical cation on the nitrogen atom of the phenothiazine ring and two successive irreversible oxidation peaks, at similar values around 1.50 V and 1.42 V (as a shoulder) for the three compounds. Those are ascribed to the formation of the radical cation on the sulfur atom of the phenothiazine ring and the aromatic ring. In the negative potential region, an irreversible wave centered at −1.01, −0.57, and −0.39 V was observed for compounds 6, 7, and 8, respectively, which is assigned to the reduction of the electron-withdrawing groups. As observed, the reduction strongly depends on the nature and strength of the acceptor. For each compound, only the first oxidation exhibits the higher potential variation due to conjugation of the nitrogen atom with the acceptor moiety. These behaviors also suggest that the phenothiazine ring is not fully conjugated with the whole π-conjugated systems and may adopt an orthogonal orientation, confirmed by standard DFT calculations (Table 2, vide infra). Furthermore, the electrochemical bandgaps (Egelec) reveal similar characteristics and are in good agreement with the optical bandgaps reflecting a linear decrease in the HOMO–LUMO gap while the acceptor strength increases.
Figure 2.
Cyclic voltammograms of compounds 6–8. [C] = 10−3 M in nBu4NPF6 (0.1 M) in CH3CN, scan rate 100 mV s−1, E° versus Ag/AgCl.
Table 2.
HOMO–LUMO calculated values in eV for compounds 6–8 (B3LYP/6-31G(d,p)).
| HOMO (eV) | LUMO (eV) | |
|---|---|---|
| 6 |
 −5.32 eV |
 −3.13 eV |
| 7 |
 −5.15 eV |
 −3.38 eV |
| 8 |
 −5.15 eV |
 −3.60 eV |
Computational DFT theoretical studies at the DFT level of the chromophores 6–8 were performed using the (B3LYP/6-31G(d,p)) basis set (Table 2) [40]. All HOMO levels are located along the phenothiazine ring system, whereas the LUMO levels are mainly located on the acceptor and the π-conjugated spacer. The energy values of the calculated frontier orbitals can be correlated with the cyclic voltammetry experiments for the HOMO levels while the LUMO levels appear at higher energies than expected. These main differences could be explained by the fact that in the excited state, the compounds exhibit a higher polarization due to the ICT, which is more stabilized by solvation effects in CH3CN giving lowered LUMO energy levels.
The anion binding properties of the compounds 6–8 were investigated by UV–visible spectroscopy with several anions such as PF6−, HSO4−, Cl−, Br− NO2−, CH3CO2−, and CN− as tetrabutylammonium salts in CH3CN. Even in polar solvent, these anionic guests interact with the chemosensors 6–8 leading to different spectroscopic changes that are structure-dependent and more specifically to the nature of the acceptor unit. Spectroscopic changes are associated to batho-, hyper-, or hypochromic effects of the ICT band. The optical changes and their amplitude as well as the presence of isosbestic points are ascribed to the ability of chemosensors to interact more or less specifically with a given anion.
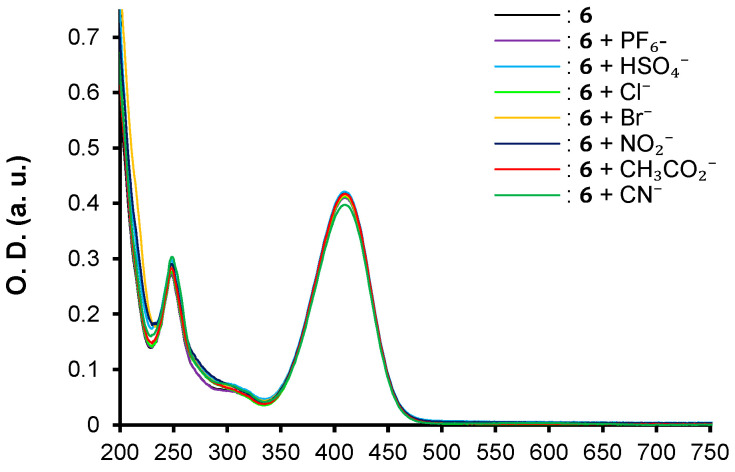
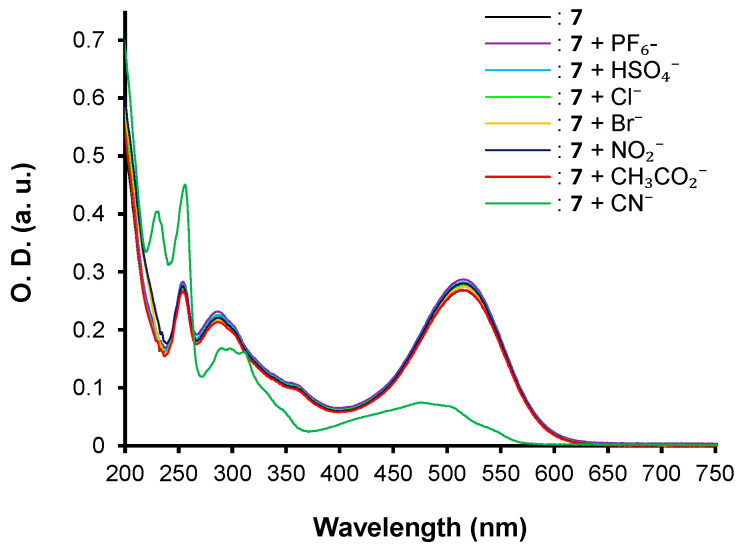
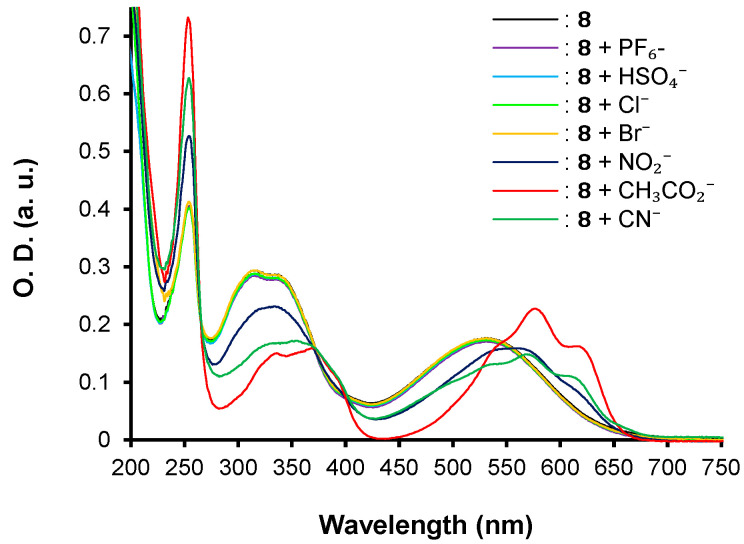
The three push–pull phenothiazine derivatives exhibit different behaviors, as shown in Figure 3, Figure 4 and Figure 5. Hence, compounds 7 and 8 displayed the most significant spectroscopic changes while compound 6 did not undergo any changes regardless of the anion tested (Figure 3). In addition, net disparities emerged between 7 and 8 (Figure 4 and Figure 5) depending on the nature of the analyte. In both cases, trivial or no interaction are seen for PF6−, HSO4−, Cl−, and Br−, whereas with NO2−, CH3CO2−, and CN−, the main spectral modifications are attained. Moreover, chromophore 7 interacts only the cyanide anion while 8 gives a colorimetric response with NO2−, CH3CO2−, and CN−.
Figure 3.
UV–vis spectra for compounds 6 in acetonitrile at [C] = ca 1.40 × 10⁻⁵ M in presence of 1 equivalent of PF6−, HSO4−, Cl−, Br− NO2−, CH3CO2−, and CN− anions as tetrabutylammonium salts in CH3CN.
Figure 4.
UV–vis spectra for compounds 7 in acetonitrile at [C] = ca 1.40 × 10⁻⁵ M in presence of 1 equivalent of PF6−, HSO4−, Cl−, Br−, NO2−, CH3CO2−, and CN− anions as tetrabutylammonium salts in CH3CN.
Figure 5.
UV–vis spectra for compounds 8 in acetonitrile at [C] = ca 1.40 × 10⁻⁵ M in presence of 1 equivalent of PF6−, HSO4−, Cl−, Br−, NO2−, CH3CO2−, and CN− anions as tetrabutylammonium salts in CH3CN.
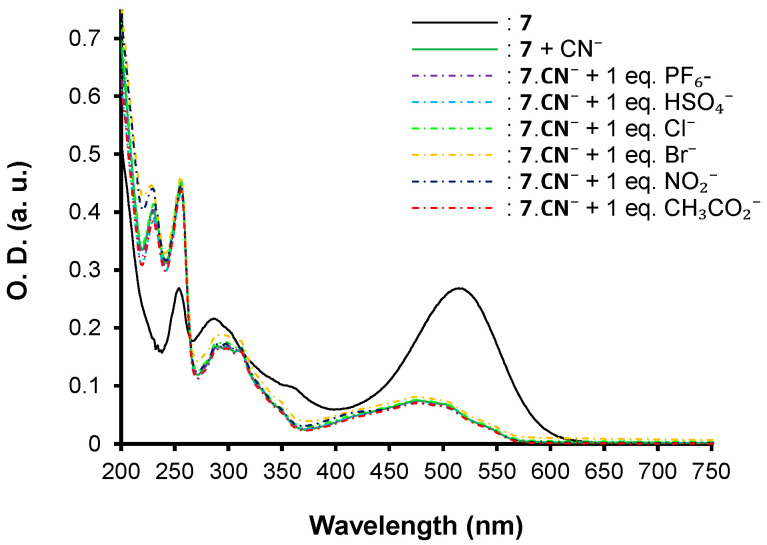
Thus, optical properties of compound 6 remain unchanged regardless of the tested anions, even with an excess. On the contrary, the addition of 1 equivalent of cyanide anion to chromophore 7 induces the formation of the adduct product 2-(2-((4-(10H-phenothiazin-10-yl)phenyl)(cyano)methyl)-3-oxo-2,3-dihydro-1H-inden-1-ylidene)malononitrile. 7.CN− (Figure 5) associated with a striking hypochromic effect and a hypsochromic shift, highlighting the nucleophilic conjugate addition of the cyanide on the β-vinylic carbon of the p-conjugated system as depicted in Figure 6, and altering the push–pull effect in agreement with previously reported results on similar systems [33].
Figure 6.
Nucleophilic conjugate addition (Michael addition reaction) of cyanide anion on chromophore 7 in CH3CN affording the adduct 7.CN−.
In the case of chromophore 8, the recognition mode appears to be different as a bathochromic shift of 561 nm, 571 nm, and 576 nm is observed for NO2−, CN−, and CH3CO2− anions, respectively. In addition to the red shift of the maximum of absorption, a fine vibronic structure appears for the ICT band. This behavior is in favor of the presence of anion–π interactions related to the π-acceptor strength [41,42,43] instead of nucleophilic conjugate addition, as seen for chromophore 7 (Figure 7).
Figure 7.
Recognition of X− anions by the chromophore 8 based on anion–π interactions in CH3CN affording the adducts 8.X−.
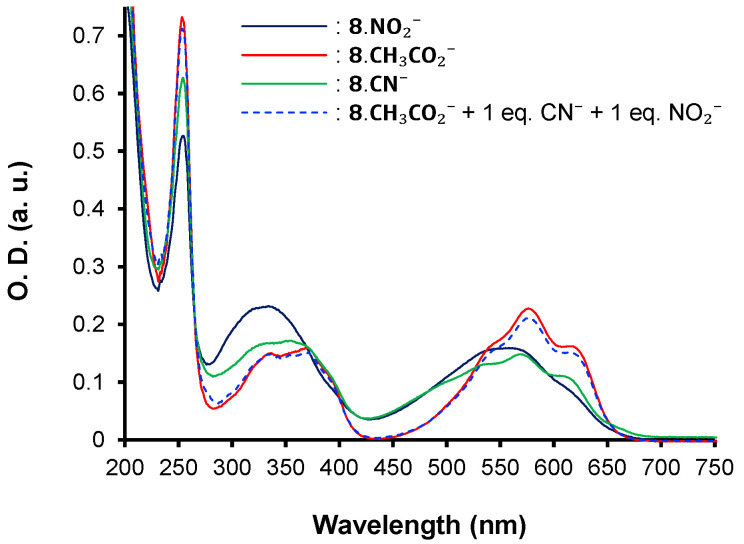
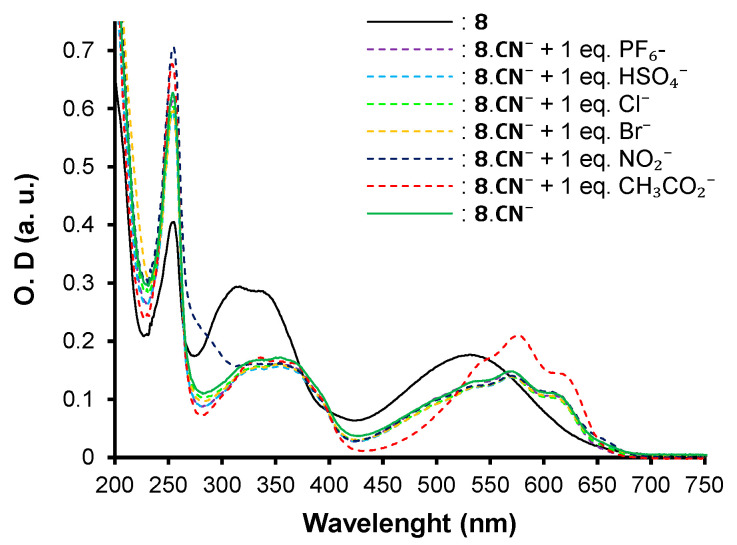
Interestingly, the strongest bathochromic shift is observed for the unexpected CH3CO2− anion. This result suggests a greater affinity of 8 towards the acetate anion compared to the others even if its pKb (9.25) is two-fold higher than the pKb (4.60) of cyanide. To confirm this hypothesis, competitive titration assays were conducted with 8.CH3CO2− by the concomitant addition of 1 equivalent of the most competitive NO2− and CN− anions (Figure 8). The absorption spectrum of 8.CH3CO2− remained unchanged, testifying to the stronger specificity of 8 for the acetate anion. Similar results were obtained when CH3CO2− was added to a solution of the complex 8.CN− or of 8.NO2− (Figure 9). In addition, experiments conducted between the complex 8.CN− and NO2− demonstrate the higher ability of 8 to interact with the cyanide anion, corroborating the observed spectroscopic changes and following the pKb range (pKb = 10.85 for nitrite anion). For the other anions having a pKb higher than ~11 (pKb (HSO4−) = 17, pKb (Cl−) = 20, pKb (Br−) = 22, pKb (PF6−) > 22 [44]), no interaction is observed. Nevertheless, not only must the pKb be taken into consideration to explain the trend, but also the symmetry, geometry, and size of the anions. On the basis of these results, a series of affinity can be settled as follows for chromophore 8: CH3CO2− > CN− > NO2− >>> Cl− ~ Br− ~ HSO4− ~ PF6−.
Figure 8.
Competitive UV–vis titration assays upon addition of 1 equivalent of NO2− and CN− to 8.CH3CO2−.
Figure 9.
Competitive UV–vis titration assays upon addition of 1 equivalent of competitive anions to 8.CN−.
The selectivity of chromophore 7 was also investigated by UV–vis spectroscopy (Figure 10). Upon the addition of putative competitive anions, the spectrum of 7.CN− remained unchanged, highlighting the fact that the addition of the cyanide is irreversible and unaffected by the presence of other ions in the medium. This indicates that the chemosensors are selective and specific to cyanide over the other anions. The same behaviors are attained when chromophore 7 is mixed with 1 eq. of CN− and 1 eq. of each anion.
Figure 10.
Competitive UV–vis titration assays upon addition of 1 equivalent of the studied anions to 7.CN−.
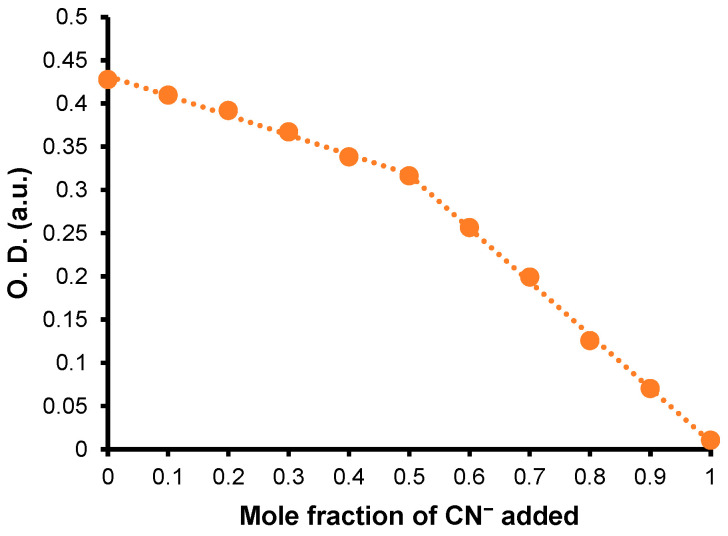
Job-plots were performed in CH3CN and indicate, for the studied anions, the formation of either a complex [1:1] for 8.CN− and 8.NO2− (as exemplified in Figure 11) or a complex [1:2] for 8.CH3CO2−.
Figure 11.
UV–Vis Job-plot for 8.CN−, [8]0 + [CN−]0 = ca 1.40 × 10⁻⁵ M.
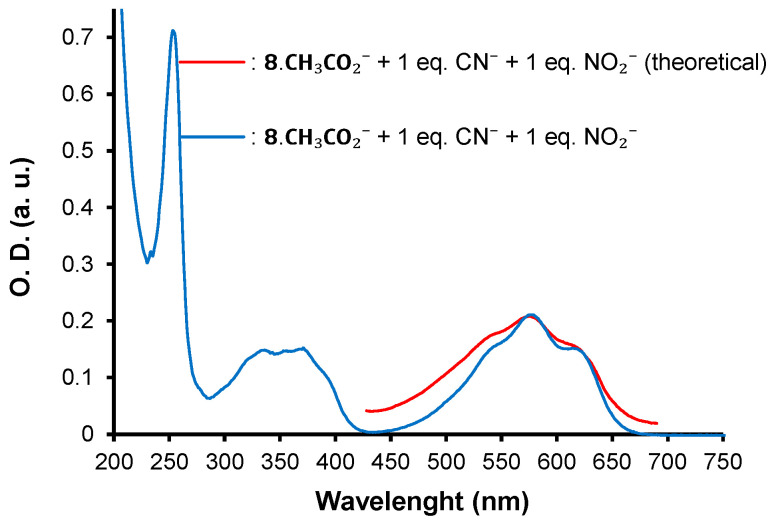
Association constants Ki were determined by solving the nonlinear equations given in literature [45]. For instance, for complex [1:1], [H0] = [H] + [G], [G0] = [G] + [HG] and K1[H].[G] = [HG]; for complex [1:2], [H0] = [H] + [G] + [HG], [G0] = [G] + [HG] + [HG2], K1[H].[G] = [HG], and K2[HG].[H] = [HG2] (where H corresponds to the host, G the guest, and the subscript 0 denotes the initial concentration for each species). The total absorbance is given by the equation , where corresponds to the molar extinction coefficient for each species. Hence, the determination of the association constants K1 gives the following trend KCH3CO2− >> KCN− > KNO2− (Table 3), which is in good agreement with the experimental optical changes observed in UV–Vis spectra. In addition, based on the equilibrium constants and , we are able to predict a reasonable titration theoretical spectrum (Figure 12) matching with the experimental data.
Table 3.
Association constants (Ki) determined in CH3CN at 293 K for the host–guest complexes 8.X−.
| LogK1 | LogK2 | Stoichiometry | |
|---|---|---|---|
| 8.NO2− | 4.31 ± 0.10 | - | 1:1 |
| 8.CN− | 5.51 ± 0.12 | - | 1:1 |
| 8.CH3CO2− | 6.28 ± 0.10 | 5.19 ± 0.10 | 1:2 |
Figure 12.
Theoretical (calculated) spectrum from 425 to 700 nm of 8.CH3CO2− + 1eq. CN− + 1eq. NO2− (red) and experimental spectrum for the same (blue) ([8.CH3CO2−]0 = ca 1.40 × 10⁻⁵ M).
According to the calculations, only 7.2% of CH3CO2− remains free in solution vs. 26.8% and 36% for CN− and NO2−, respectively. Both experimental and calculation findings pinpoint that 8 interacts more strongly with CH3CO2− than CN− and NO2−.
Finally, as proof of concept for practical applications, a paper test strip was prepared as follows: a white paper strip was dipped into a 10−3 M solution of 7 in CH3CN for 1 min, then air-dried. After this process, the paper took on a red wine color tint. The immersion of the latter into a solution of CN− anions colorized the test strip in orange, whereas for the others (PF6−, HSO4−, Cl−, Br− NO2−, CH3CO2−), the strip’s color remained unchanged. The same behavior was observed when the paper test strip was immersed in a solution containing all anions together (Figure 13). These results clearly demonstrate the possibility of using this strip as qualitatively naked eye sensing of cyanide in complex solutions. The method is very cheap and does not require any calibration for qualitative detection.
Figure 13.
Qualitatively naked eye sensing of cyanide anions (right side) with a paper test strip treated with compound 7. Color of the paper test strip (left side) in presence of other anions.
4. Conclusions
In summary, we reported herein the straightforward synthesis and characterization of novel phenothiazine derivatives possessing remarkable sensitivity and selectivity for cyanide (LOD = 9.12 µM) over other anions. The sensing mechanism is based on the irreversible nucleophilic addition of the cyanide leading to an irreversible change of the color. This behavior makes it a system of choice for naked eyes sensing devices (Table 4) based on the absorption properties since most of the phenothiazine-based chemosensors developed up to now have been used as fluorescent probes. Interestingly, by changing the strength of the acceptor, the mechanism is switched into an anion-p interactions recognition mechanism associated to almost a two-fold increase in the LOD for cyanide detection reaching a value of 4.59 µM. In addition, the enhancement of the acceptor strength has allowed the possibility to selectively detect nitrite and acetate. Experimental data demonstrated that the highest binding ability is achieved for the acetate anion even in presence of nitrite and cyanide with a LOD of 2.68 µM. A paper test strip was efficiently prepared and used to sense qualitatively cyanide anions in solutions. Further studies are in progress striving for new chemosensors suitable for sensing applications as well as their implementation in electronic devices such as field effect transistors [46].
Table 4.
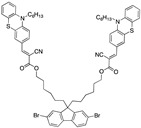
Literature survey of optical phenothiazine-based chemosensors used in cyanide sensing associated with their LOD. a Fluorescence, b absorption.
| Phenothiazine-Based Chemosensors |
LOD Solvent [Ref] |
Phenothiazine-Based Chemosensors | LOD Solvent [Ref] |
|---|---|---|---|

|
1.56 µM b DCM [22] |

|
9.80 × 10⁻² µM DMF/Tris-HCl buffer 1:99 v/v 10 mM, pH 9.3 [29] |

|
6.70 × 10⁻² µM a DMSO/H2O (9:1) [23] 3.21 × 10⁻³ µM aCH3CN [26] |

|
3.06–3.20 × 10⁻³ µM a CH3CN [30] |

|
13.00 µM a CH3CN [24] |

|
3.20 × 10⁻³ µM a CH3CN: water (9:1) [31] |
|
4.26 µM THF [32] |

|
9.85 µM EtOH/PBS (4:6) [25] |

|
0.57 µM a DMSO [27] |

|
3.39 µM b, 0.011 µM a CH3CN: water (9:1) [33] |

|
0.32 µM a DMSO [27] |

|
9.12 µM b CH3CN [this work] |

|
0.02 µM DMSO [28] |

|
4.59 µM b CH3CN (this work) |
Acknowledgments
This work was supported by the Centre National de la Recherche Scientifique (CNRS) and the Ministère de l’Enseignement Supérieur et de la Recherche (MESR). Frédéric Brunel is acknowledged for melting point and FTIR measurements. P.E.M.V. thanks also the CONACYT agency for his doctoral financial support n°553260/295449.
Supplementary Materials
The following supporting information can be downloaded at: https://www.mdpi.com/article/10.3390/bios12060407/s1.
Author Contributions
Conceptualization, methodology, supervision, project administration, writing review and editing, J.-M.R.; synthesis, formal analysis, electrochemistry, investigation, P.E.M.V. All authors have read and agreed to the published version of the manuscript.
Institutional Review Board Statement
Not applicable.
Informed Consent Statement
Not applicable.
Data Availability Statement
The data presented in this study are available on request from the corresponding author.
Conflicts of Interest
The authors declare no conflict of interest.
Funding Statement
This research received no external funding.
Footnotes
Publisher’s Note: MDPI stays neutral with regard to jurisdictional claims in published maps and institutional affiliations.
References
- 1.Mangani S., Ferraroni M. In: Supramolecular Chemistry of Anions. Bianchi A., Bowman-James K., Garcia-Espana E., editors. John Wiley-VCH; New York, NY, USA: 1997. p. 63. Chapter 3. [Google Scholar]
- 2.Wu J., Kwon B., Liu W., Anslyn E.V., Wang P., Kim J.S. Chromogenic/fluorogenic ensemble chemosensing systems. Chem. Rev. 2015;115:7893–7943. doi: 10.1021/cr500553d. [DOI] [PubMed] [Google Scholar]
- 3.Cliff J., Nzwalo H., Muquingue H. Toxicology of Cyanides and Cyanogens. John Wiley & Sons, Ltd.; Hoboken, NJ, USA: 2016. Cyanide in the production of long-term adverse health effects in humans; pp. 98–112. Chapter 7. [Google Scholar]
- 4.Puljak L., Kilic G. Emerging roles of chloride channels in human diseases. Biochim. Biophys. Acta. 2006;1762:404–413. doi: 10.1016/j.bbadis.2005.12.008. [DOI] [PubMed] [Google Scholar]
- 5.Weiner M.L., Salminen W.F., Larson P.R., Barter R.A., Kranetz J.L., Simon G.S. Toxicological review of inorganic phosphates. Food Chem. Toxicol. 2001;39:759–786. doi: 10.1016/S0278-6915(01)00028-X. [DOI] [PubMed] [Google Scholar]
- 6.World Health Organization Guidelines for Drinking-Water Quality 2017. [(accessed on 20 April 2022)]; Available online: https://apps.who.int/iris/handle/10665/254637.
- 7.Zagrobelny M., Bak S., Møller B.L. Cyanogenesis in plants and arthropods. Phytochemistry. 2008;69:1457–1468. doi: 10.1016/j.phytochem.2008.02.019. [DOI] [PubMed] [Google Scholar]
- 8.Jaszczak E., Kozioł K., Kiełbratowska B., Polkowska Z. Appliation of ion chromatography with pulsed amperometric detection for the determination of trace cyanide in biological samples, including breast milk. J. Chromatogr. B. 2019;1110–1111:36–42. doi: 10.1016/j.jchromb.2019.02.008. [DOI] [PubMed] [Google Scholar]
- 9.Zhang Q., Maddukuri N., Gong M. A direct and rapid method to determine cyanide in urine by capillary electrophoresis. J. Chromatogr. A. 2015;1414:158–162. doi: 10.1016/j.chroma.2015.08.050. [DOI] [PMC free article] [PubMed] [Google Scholar]
- 10.Udhayakumari D. Chromogenic and fluorogenic chemosensors for lethal cyanide ion. A comprehensive review of the year 2106. Sens. Actuators B Chem. 2018;259:1022–1057. doi: 10.1016/j.snb.2017.12.006. [DOI] [Google Scholar]
- 11.Gale P., Steed J., editors. Molecular Recognition in Supramolecular Chemistry: From Molecules to Nanomaterials. John Wiley & Sons, Ltd.; London, UK: 2012. [Google Scholar]
- 12.Jackson R., Logue B.A. A review of rapid and field-portable analytical techniques for the diagnosis of cyanide exposure. Anal. Chim. Acta. 2017;960:18–39. doi: 10.1016/j.aca.2016.12.039. [DOI] [PubMed] [Google Scholar]
- 13.Bencini A., Lippolis V. Metal-based optical chemosensors for CN− detection. Environ. Sci. Pollut. Res. 2016;23:24451–24475. doi: 10.1007/s11356-016-7419-1. [DOI] [PubMed] [Google Scholar]
- 14.Touceda-Varela A., Stevenson E.I., Galve-Gasion J.A., Dryden D.T., Mareque-Rivas J.C. Selective turn-on fluorescence detection cyanide in water using hydrophobic CdSe quantum dots. Chem. Commun. 2008;17:1998–2000. doi: 10.1039/b716194h. [DOI] [PubMed] [Google Scholar]
- 15.Liu T., Liu X., Valencia M.A., Sui B., Zhang Y., Belfield K.D. Far-red-emitting TEG-substituted squaraine dye: Synthesis, optical properties, and selective detection of cyanide in aqueous solution. Eur. J. Org. Chem. 2017;2017:3957–3964. doi: 10.1002/ejoc.201700649. [DOI] [Google Scholar]
- 16.Yang Y.-K., Tae J. Acrinium salt based fluorescent and colorimetric chemosensor for the detection of cyanide in water. Org. Lett. 2006;8:5721–5723. doi: 10.1021/ol062323r. [DOI] [PubMed] [Google Scholar]
- 17.Mouradzadegun A., Abadast F. An improved organic/inorganic solid receptor for colorimetric cyanide-chemosensing in water: Towards new mechanism aspects, simplistic use and portability. Chem. Commun. 2014;50:5983–15986. doi: 10.1039/C4CC06756H. [DOI] [PubMed] [Google Scholar]
- 18.Li J., Chang Z., Pan X., Dong W., Jia A.-Q. A novel colorimetric and fluorescent probe based on indolium salt for detection of cyanide in 100% aqueous solution. Dyes Pigm. 2019;168:175–179. doi: 10.1016/j.dyepig.2019.04.059. [DOI] [Google Scholar]
- 19.Prakash K., Ranjan Sahoo P., Kumar S. A fast, highly selective and sensitive anion probe stemmed from anthracene-oxazine conjugation with CN- induced FRET. Dye. Pigm. 2017;143:393–400. doi: 10.1016/j.dyepig.2017.04.060. [DOI] [Google Scholar]
- 20.Hao Y., Nguyen K.H., Zhang Y., Zhang G., Fan S., Li F., Guo C., Lu Y., Song X., Qu P., et al. A highly selective and ratiometric fluorescent probe for cyanide by rationally altering the susceptible H-atom. Talanta. 2018;176:234–241. doi: 10.1016/j.talanta.2017.08.032. [DOI] [PubMed] [Google Scholar]
- 21.Orrego-Hernaández J., Portilla J. Synthesis of dicyanovinyl-substituted 1-(2-pyridyl)pyrazoles: Design of a fluorescent chemosensor for selective recognition of cyanide. J. Org. Chem. 2017;82:13376–13385. doi: 10.1021/acs.joc.7b02460. [DOI] [PubMed] [Google Scholar]
- 22.Garg B., Yan L., Bisht T., Zhu C., Ling Y.-C. A phenothiazine-based colorimetric chemodosimeter for the rapid detection of cyanide anions in organic and aqueous media. RSC Adv. 2014;4:36344–36349. doi: 10.1039/C4RA06440B. [DOI] [Google Scholar]
- 23.Zou Q., Li X., Xu Q., Agren H., Zhao W., Qu Y. A near-infrared “on-off” fluorescent and colourimetriccyanide chemodosimeter based on phenothiazine with applications in living cell imaging. RSC Adv. 2014;4:59809–59816. doi: 10.1039/C4RA11567H. [DOI] [Google Scholar]
- 24.Garg B., Ling Y.-C. A highly selective phenothiazine-based fluorescence “turn-on” indicator based on cyaide-promoted novel protection/deprotection mechanism. Chem. Commun. 2015;51:8809–8812. doi: 10.1039/C5CC01626F. [DOI] [PubMed] [Google Scholar]
- 25.Zhao S., Wu F., Zhao Y., Liu Y., Zhu L. Phenothiazine-cyanine-functionalized upconversion nanoparticles for LRET and colorimetric sensing of cyanide ions in water samples. J. Photochem. Photobiol. A. 2016;319–320:53–61. doi: 10.1016/j.jphotochem.2015.12.022. [DOI] [Google Scholar]
- 26.El-Shishtawy R.M., Al-Zahrani F.A.M., Al-Amshany Z.M., Asiri A.M. Synthesis of a new fluorescent cyanide chemosensor based on phenothiazine derivative. Sens. Actuators B Chem. 2017;240:288–296. doi: 10.1016/j.snb.2016.08.168. [DOI] [Google Scholar]
- 27.Ramachandran E., Vandarkuzhali S.A.A., Sivaraman G., Dhamodharan R. Phenothiazine based donor-acceptor compounds with solid-state emission in the yellow to NIR region and their highly selective and sensitive detection of cyanide ion in ppb level. Chem. Eur. J. 2018;24:11042–11050. doi: 10.1002/chem.201800216. [DOI] [PubMed] [Google Scholar]
- 28.Zhao H.-W., Wu G., Sun X.-Y., Chao J.-B., Li Y.Q., Jiang L., Han H. A highly selective and ratiometric molecular probe for cyanide sensing based on a phenothiazine-hemicyanine dye. J. Lumin. 2018;201:474–478. doi: 10.1016/j.jlumin.2018.05.021. [DOI] [Google Scholar]
- 29.Zhu L., Nie J., Li Q., Du J., Fan X., Bai F., Yang Q., Shan Y., Li Y. Reaction-based fluorescent probe for differential detection of cyanide and bisulfite in the aqueous media. J. Lumin. 2019;215:116620. doi: 10.1016/j.jlumin.2019.116620. [DOI] [Google Scholar]
- 30.Al-Zahrani F.A.M. Selective “turn-on” fluorescent sensor for cyanide in aqueous environment and test strips. J. Fluoresc. 2019;29:1–8. doi: 10.1007/s10895-018-2334-0. [DOI] [PubMed] [Google Scholar]
- 31.Al-Soliemy A.M. Novel asymmetrical phenothiazine for fluorescent detection of cyanide anions. J. Mol. Struct. 2019;1179:525–531. doi: 10.1016/j.molstruc.2018.11.046. [DOI] [Google Scholar]
- 32.Suganya S., Ravindran E., Mahato M.K., Prasad E. Orange emitting fluorescent probe for the selective detection of cyanide ion in solution and solid states. Sens. Actuators B Chem. 2019;291:426–432. doi: 10.1016/j.snb.2019.04.066. [DOI] [Google Scholar]
- 33.Al-Zahratni F.A.M., El-Shishtawy R.M., Asiri A.M., Al-Soliemy A.M., Mellah K.A., Ahmed N.S.E., Jedidi A. A new phenothiazine-based selective visual and fluorescent sensor for cyanide. BMC Chem. 2020;14:2. doi: 10.1186/s13065-019-0656-x. [DOI] [PMC free article] [PubMed] [Google Scholar]
- 34.Olivieri A.C. Practical guidelines for reporting results in single-and multi-component analytical calibration: A tutorial. Anal. Chim. Acta. 2015;868:10–22. doi: 10.1016/j.aca.2015.01.017. [DOI] [PubMed] [Google Scholar]
- 35.Allegrini F., Olivieri A.C. IUPAC-consistent approach to the limit of detection in partial least-squares calibration. Anal. Chem. 2014;86:7858–7866. doi: 10.1021/ac501786u. [DOI] [PubMed] [Google Scholar]
- 36.Fédération Sciences Chimiques Marseille. [(accessed on 20 April 2022)]. Available online: https://fr-chimie.univ-amu.fr/spectropole/
- 37.Hart A.S., Bikram C.K.C., Subbaiyan N.K., Karr P.A., D’Souza F. Phenothiazine-sensitized organic solar cells: Effect of dye anchor group positioning on the cell performance. ACS Appl. Mater. Interfaces. 2012;4:5813–5820. doi: 10.1021/am3014407. [DOI] [PubMed] [Google Scholar]
- 38.Bello K.A., Cheng L., Griffiths J. Near-infrared absorbing methine dyes based on dicyanovinyl derivatives of indan-1,3-dione. J. Chem. Soc. Perkin Trans. 1987;2:815–818. doi: 10.1039/p29870000815. [DOI] [Google Scholar]
- 39.Raimundo J.-M., Blanchard P., Gallego Planas N., Mercier N., Ledoux-Rak I., Hierle R., Roncali J. Design and synthesis of push-pull chromophores for second-order nonlinear optics derived from rigidified thiophene pi-conjugating spacers. J. Org. Chem. 2002;67:205–218. doi: 10.1021/jo010713f. [DOI] [PubMed] [Google Scholar]
- 40.Frisch M.J., Trucks G.W., Schlegel H.B., Scuseria G.E., Robb M.A. Gaussian 09, Revision D.01. Gaussian, Inc.; Wallingford, CT, USA: 2009. [Google Scholar]
- 41.Schottel B.L., Chifotides H.T., Dunbar K.R. Anion-pi interactions. Chem. Soc. Rev. 2008;37:68–83. doi: 10.1039/B614208G. [DOI] [PubMed] [Google Scholar]
- 42.Giese M., Albrecht M., Rissanen K. Experimental investigation on anion-π-interactions-applications and biochemical relevance. Chem. Commun. 2016;52:1778–1795. doi: 10.1039/C5CC09072E. [DOI] [PubMed] [Google Scholar]
- 43.Kepler S., Zeller M., Rosokha S.V. Anion—π Complexes of halides with p-benzoquinones: Structures, thermodynamics, and criteria of charge transfer to electron transfer transition. J. Am. Chem. Soc. 2019;141:9338–9348. doi: 10.1021/jacs.9b03277. [DOI] [PubMed] [Google Scholar]
- 44.Sugimoto H., Miyake H., Tsukube H. Receptor versatility of tris(pyridine-1-ium-2-ylmethyl)amine in anion binding through hydrogen bonding. J. Chem. Soc. Dalton Trans. 2002;24:4535–4540. doi: 10.1039/b209331f. [DOI] [Google Scholar]
- 45.Thordason P. Determining association constants from titration experiments in supramolecular chemistry. Chem. Soc. Rev. 2011;40:1305–1323. doi: 10.1039/C0CS00062K. [DOI] [PubMed] [Google Scholar]
- 46.Martín Várguez P.E., Brunel F., Raimundo J.-M. Recent electrochemical/electrical microfabricated sensor devices for ionic and polyionic analytes. ACS Omega. 2020;5:4733–4742. doi: 10.1021/acsomega.9b04331. [DOI] [PMC free article] [PubMed] [Google Scholar]
Associated Data
This section collects any data citations, data availability statements, or supplementary materials included in this article.
Supplementary Materials
Data Availability Statement
The data presented in this study are available on request from the corresponding author.


