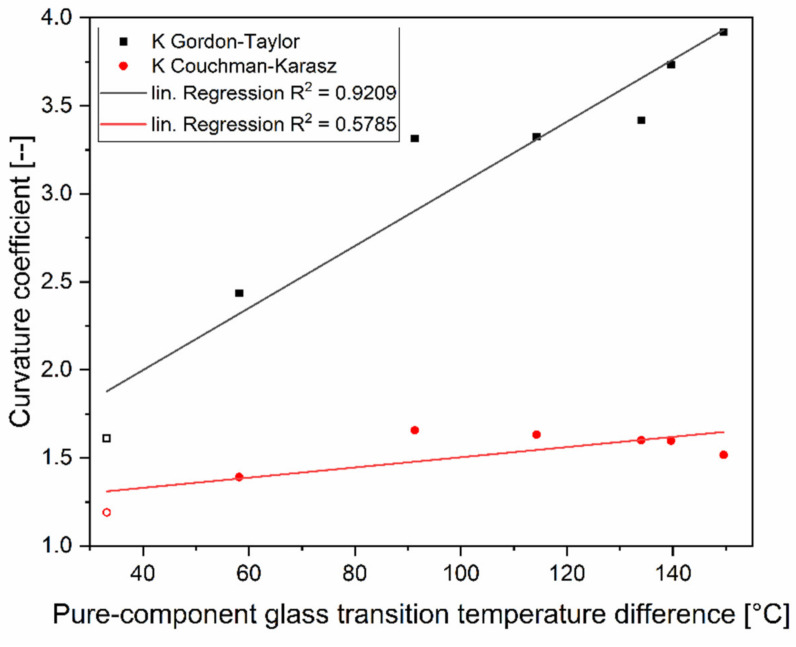
Figure 5.
Empirical curvature coefficients K (Gordon–Taylor fit) and theoretical K-values (derived from the pure-component Δcp values) as a function of the pure-component glass transition temperature difference ΔTg for the binary carbohydrate mixtures used in this study. Also included are the values of the binary maltose–maltotriose mixture from the ternary mixture design of this study (symbols without filling).

