Abstract
Matrix-assisted laser desorption-ionization (MALDI) time-of-flight mass spectrometry was used to characterize the spores of 14 microorganisms of the Bacillus cereus group. This group includes the four Bacillus species B. anthracis, B. cereus, B. mycoides, and B. thuringiensis. MALDI mass spectra obtained from whole bacterial spores showed many similarities between the species, except for B. mycoides. At the same time, unique mass spectra could be obtained for the different B. cereus and B. thuringiensis strains, allowing for differentiation at the strain level. To increase the number of detectable biomarkers in the usually peak-poor MALDI spectra of spores, the spores were treated by corona plasma discharge (CPD) or sonicated prior to MALDI analysis. Spectra of sonicated or CPD-treated spores displayed an ensemble of biomarkers common for B. cereus group bacteria. Based on the spectra available, these biomarkers differentiate B. cereus group spores from those of Bacillus subtilis and Bacillus globigii. The effect of growth medium on MALDI spectra of spores was also explored.
Mass spectrometry (MS) is widely used for characterization of microorganisms (11). Success in characterization of microorganisms and in differentiation between species and strains hinges upon the detection of an ample number of unique biomarkers in the desired m/z range. Various sources of such biomarkers have been exploited, including cell wall lipids (15, 17), carbohydrates (12), nucleic acids (28), and proteins (21).
At the end of 1999, the Bacillus cereus group bacteria included the four species B. anthracis, B. cereus, B. mycoides, and B. thuringiensis (http://www.ncbi.nlm.nih.gov/Taxonomy/tax.html). All of these species exhibit DNA homology (16). B. mycoides is more distantly related to B. anthracis, B. cereus, and B. thuringiensis and has not always been included in the B. cereus group (26, 29). Much of the interest in these microorganisms focuses primarily on one group member, B. anthracis, which is a pathogenic bacterium. B. cereus is a known source of food poisoning, and B. thuringiensis is widely used as a pesticide and is not considered to be dangerous for humans. B. thuringiensis has more than 80 subspecies (27), and that number continues to grow. Bacillus cereus group spores and bacteria have been included in a number of previous MS studies (5, 14, 22, 23; J. Stutler, J. Ezzell, W. Bryden, P. Demirev, Y. Hathout, and J. Jackman, Abstr. 47th ASMS Conf. Mass Spectrom. Allied Top., abstr. 1626, 1999). Several MS-based techniques have been applied. Pyrolysis MS has been proposed to characterize the B. cereus group spores by looking at dipicolinic acid (4) or bacteria by looking at the fatty acid profiles (2). Electrospray ionization (13) has been used to analyze the phospholipid content of B. cereus microorganisms. Gas chromatography-MS provides distinct carbohydrate profiles for both vegetative bacteria and spores of B. cereus and B. anthracis (12).
When rapid and reliable analysis is needed, direct characterization of whole bacterial cells is especially attractive. The analysis of intact bacteria has thus far been dominated by matrix-assisted laser desorption-ionization (MALDI)-MS (1, 7, 9, 10, 19, 21, 23). Protein biomarkers have been shown to be readily accessible with MALDI (1, 8, 24), and computer programs are under development to identify the microorganisms in the sample by searching libraries of reference spectra (18) and by searching genome or proteome databases (phyloproteomics) (9; F. Pineda, J. Linn, C. Fenselau, and P. A. Demirev, submitted for publication).
The majority of viable airborne bacteria occur in the form of spores. A limited number of papers have discussed their rapid characterization by MS techniques (5, 12, 14). It is more difficult to release biomarkers from spores than from vegetative cells, and we previously applied corona plasma discharge (CPD) to increase the number and amount of observable biomarkers (6). Here, in addition to CPD, we evaluate another technique to release protein biomarkers from spores, ultrasonication, which has been used for transdermal protein delivery (25) and transdermal monitoring of glucose levels in blood (20) and which has recently been proposed to disrupt bacterial spores for DNA analysis (3).
Recent MALDI studies showed facile distinction between spores of some Bacillus strains (14; Stutler et al., Abstr. 47th ASMS Conf. Mass Spectrom. Allied Top.). However, a high similarity between fingerprints of B. cereus and B. anthracis spores was also found. The present report documents the continuing effort to characterize and distinguish spores by MALDI-MS. Differentiation is evaluated at the strain and group levels.
MATERIALS AND METHODS
Microorganisms.
B. thuringiensis strains (ATCC) 13366, 13367, 19269, 29730, and 55172 and B. mycoides 6462 were purchased from American Type Culture Collection (ATCC), Rockville, Md. B. thuringiensis 4AA-1; ATCC strains 10792, 33679 (same as HD-1), and 35646; and B. cereus T, B33, and NCTC 8035 spores were provided by Joany Jackman (U.S. Army Research Institute of Infectious Diseases [USAMRIID], Frederick, Md.). These spores were grown in chemically defined sporulation medium (CDSM) according to procedures described elsewhere (14). B. thuringiensis subsp. kurstaki (strain 33679) was grown in two additional media, nutrient broth (NB) and AK agar no. 2 (AK#2). Spores from B. anthracis Sterne, a nonpathogenic strain, were prepared as previously reported (14). Spores were harvested by mild centrifugation (10,000 × g) for 10 min. The harvested material was treated with lysozyme (50 μg/ml) in 50 mM Tris HCl (pH 7.2) to destroy the remaining vegetative cells. The purified spores were lyophilized and stored at −20°C. Spore preparations were microscopically evaluated for the presence of dormant spores, germinated spores, and vegetative cells.
MS.
MALDI mass spectra were obtained on a Kompact MALDI 4 (Kratos Analytical Instruments, Chestnut Ridge, N.Y.) time-of-flight instrument in the linear mode at a 20-kV accelerating voltage with a 0.3-μs delay time. Laser fluence was typically 10 mJ/cm2. Each spectrum was an average from 50 laser shots and was reproduced on many occasions. Untreated spores were suspended (5 mg/ml) in acetonitrile–0.1% trifluoroacetic acid (70:30 [vol/vol]), and 0.2 μl was deposited in a well of a Kratos sample slide. The sample was covered with 0.2 μl of matrix solution (50 mM sinapinic acid in the same solvent mixture). Both internal (bovine insulin, bovine ubiquitin, equine cytochrome c, and chicken lysozyme) and external mass calibrations were used to provide a mass accuracy of 1 part in 3,000. The calibrants were purchased from Sigma, St. Louis, Mo., and added in small amounts (5 to 20 μM) to the matrix solution to give signals comparable in intensity to those of the bacterial biomarkers.
Sample treatment.
In general, spores were suspended in acetonitrile–0.1% trifluoroacetic acid (70:30 [vol/vol]) at a concentration of 5 mg/ml and analyzed immediately by MALDI. Some samples were allowed to stand at room temperature for 3 days in the suspension solvent before MALDI analysis.
(i) CPD.
A high-frequency high-voltage generator, model BD-20A (MesoSystems Technology, Richland, Wash.) was used for CPD experiments. The original electrode was placed about 3 mm above each well in the sample slide in air to provide low-current CPD pulses with repetition rates of 120 pulses/s. About 0.3 μl of spore suspension was placed in each well. The duration of CPD treatment was about 3 s. The treated sample was then covered with 0.3 μl of the matrix solution and analyzed by MALDI.
(ii) Sonication.
Disruption of spores by sonication was achieved by placing a probe tip of a sonicator–cell disruptor (model W 185F; Heat Systems—Ultrasonics, Inc., Plainview, N.Y.) into a plastic vial containing 100 μl of the spore suspension (0.5 to 5 mg/ml in acetonitrile–0.1% trifluoroacetic acid at 70:30 [vol/vol]). The sonicator was operated at 20 kHz for between 30 s and 2 min at a maximum power setting for the microtip. An aliquot of 0.1 μl of sonicated suspension was used for MALDI-MS analysis.
RESULTS AND DISCUSSION
MALDI-MS fingerprints of untreated spores.
The 14 types of spores studied here displayed distinct MALDI spectra when analyzed directly, without special treatment. The masses of the major biomarker ions observed in the m/z range of 4,000 to 20,000 are listed in Table 1, where they are organized by mass range. The biomarker with an m/z of 4,833 was detected in examples from all species, except B. mycoides, in agreement with the results from other laboratories (Stutler et al., Abstr. 47th ASMS Conf. Mass Spectrom. Allied Top.). None of the biomarkers detected in spectra from B. cereus group samples was observed in either B. subtilis or Bacillus globigii (Table 1). The MALDI mass spectrum of B. anthracis Sterne contained the same major peaks at m/zs of 4,705 and 4,833 as the spectra of B. cereus T and B. cereus B33; however, these B. cereus spectra contain additional biomarkers (Table 1). Overall, the number of biomarkers detected from untreated spores was limited, and so additional processing methods were evaluated.
TABLE 1.
Biomarkers observed in MALDI-MS of whole spore cells of B. cereus group bacteria
| Organism | Strain | Biomarker(s) (m/z)a | ||||||||||
|---|---|---|---|---|---|---|---|---|---|---|---|---|
| B. cereus | T | 4,705 | 4,815 | 5,033 | 5,381 | |||||||
| 4,833 | ||||||||||||
| B33 | 4,333 | 4,705 | 4,815 | 4,936 | 5,381 | 6,105 | ||||||
| 4,833 | 5,091 | |||||||||||
| NCTC 8035 | 4,871 | 5,145 | ||||||||||
| B. anthracis | Sterne | 4,333 | 4,705 | 4,833 | ||||||||
| B. thuringiensis subsp. kurstaki | 33679 | 4,833 | 5,108 | 6,712 | 6,834 | 7,082 | 7,317 | 8,067 | ||||
| 9,997 | ||||||||||||
| B. thuringiensis subsp. israelensis | 35646 | 4,165 | 4,833 | 6,712 | 6,834 | 7,930 | ||||||
| B. thuringiensis subsp. finitimus | 19269 | 5,032 | 5,469 | |||||||||
| 5,172 | ||||||||||||
| B. thuringiensis subsp. galleriae | 29730 | 4,654 | 4,833 | 5,108 | 6,712 | |||||||
| 4,767 | 4,883 | 5,246 | ||||||||||
| B. thuringiensis subsp. tenebrionis | 4AA-1 | 4,833 | 6,712 | 6,834 | 7,082 | |||||||
| B. thuringiensis subsp. berliner | 10792 | 5,577 | 6,695 | 6,827 | 7,082 | 19,030 | ||||||
| 5,652 | ||||||||||||
| 13366 | 4,933 | 6,374 | 6,712 | 6,834 | 7,082 | 7,930 | ||||||
| 13367 | 4,933 | 5,893 | 6,712 | 6,834 | 7,082 | 7,331 | 7,930 | |||||
| 5,922 | 6,907 | 8,062 | ||||||||||
| 55172 | 4,089 | 4,815 | 6,374 | 7,930 | ||||||||
| 4,160 | 4,833 | |||||||||||
| B. mycoides | 6462 | 4,543 | 4,976 | 6,525 | 6,873 | |||||||
| 5,297 | ||||||||||||
| B. subtilisb | EMG 168 | 7,779 | ||||||||||
| B. globigiib (B. subtilis subsp. niger) | 9372 | 4,897 | 6,775 | |||||||||
Numbers in boldface denote peaks occurring in several species.
Reference 14.
Biomarkers released by CPD and sonication.
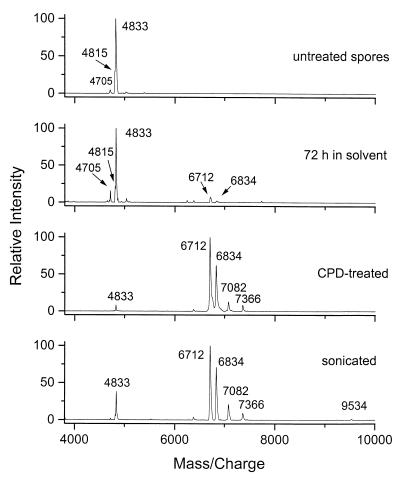
To obtain more informative fingerprints, whole spores were subjected to a 3-day soak in organic solvent, CPD treatment (6), or sonication. Each treatment resulted in release of two to five additional biomarkers in the m/z range of 6,000 to 8,000 as summarized in Table 2. Figure 1 illustrates the effects of different treatments on mass spectra of B. cereus T spores. After long exposure to organic solvent, new biomarkers were detected in the MALDI spectrum (Fig. 1 [72 h in solvent]). These peaks became dominant in the spectrum of spores treated by CPD (Fig. 1). Some of the CPD-released biomarkers were present in MALDI spectra of intact spores (compare to Table 1), but their intensity was greatly increased upon the CPD treatment. Ultrasonic treatment (Fig. 1) produced results similar to those of CPD, with an additional peak at an m/z of 9,540. Again, there were many similarities among the members of the B. cereus group studied, with the exception of B. mycoides. The peaks at m/zs of 6,834 and 7,082 were present in spectra of examples of all three species (Table 2) B. anthracis, B. cereus, and B. thuringiensis. The biomarker peak at an m/z of 6,712 was also detected in most of the samples. B. subtilis and B. globigii, which do not belong to the B. cereus group, again showed nonoverlapping sets of biomarkers. The common peaks detected in spectra of the B. cereus species and strains studied here, except B. mycoides, may constitute an ensemble that will permit group classification. At least two of the three peaks were present in each spectrum. Additional biomarkers released by CPD or sonication in the range of 7,100 to 9,500 varied between the various strains and could be used to help distinguish between them.
TABLE 2.
Biomarkers released from spores of B. cereus group bacteria by CPD and sonication
| Organism | Straina | Biomarker(s) (m/z)b | ||||
|---|---|---|---|---|---|---|
| B. cereus | T* | 6,712 | 6,834 | 7,082 | 7,366 | 9,534 |
| B33* | 6,695 | 6,834 | 7,082 | 7,451 | 7,930 | |
| 9,244 | ||||||
| NCTC 8035 | 6,712 | 6,834 | 7,082 | 7,353 | ||
| B. anthracis | Sterne | 6,678 | 6,834 | 7,082 | 7,366 | |
| B. thuringiensis subsp. kurstaki | 33679* | 6,712 | 6,834 | 7,082 | 7,317 | |
| B. thuringiensis subsp. israelensis | 35646 | 6,712 | 6,834 | 7,082 | 7,366 | |
| B. thuringiensis subsp. finitimus | 19269 | 6,695 | 6,834 | 7,082 | 7,366 | |
| B. thuringiensis subsp. galleriae | 29730* | 6,712 | 6,834 | 7,082 | 7,331 | |
| B. thuringiensis subsp. tenebrionis | 4AA-1 | 6,712 | 6,834 | 7,082 | 7,366 | |
| B. thuringiensis subsp. berliner | 10792* | 6,695 | 6,827 | 7,082 | ||
| 13366* | 6,712 | 6,834 | 7,082 | 7,205 | ||
| 7,331 | ||||||
| 13367* | 6,712 | 6,834 | 7,082 | 7,331 | 7,751 | |
| 55172* | 6,712 | 6,827 | 7,082 | 7,331 | 9,180 | |
| B. mycoides | 6462 | 6,529 | 6,877 | 7,066 | ||
| B. subtilisc | EMG 168 | 6,847 | 6,949 | 9,136 | ||
| B. globigiic (B. subtilis subsp. niger) | 9372 | 7,346 | 8,898 | |||
Asterisked organisms were sonicated.
Numbers in italic correspond to peaks observed only after sonication. Numbers in boldface denote peaks characteristic of the B. cereus group, excluding B. mycoides.
Reference 14.
FIG. 1.
MALDI mass spectra of B. cereus T spores. Results for intact (untreated) spores, spores after long (72 h) exposure to solvent, CPD-treated spores, and sonicated spores are shown.
Differentiation of strains.
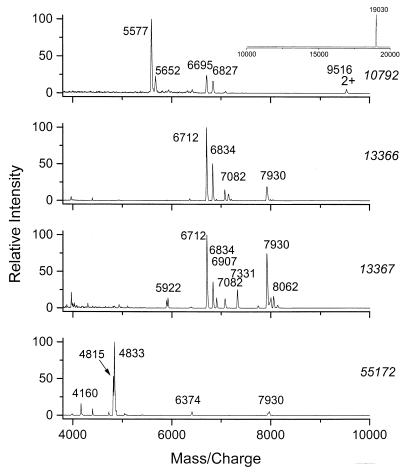
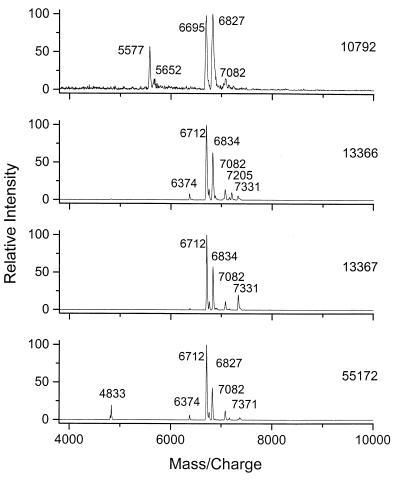
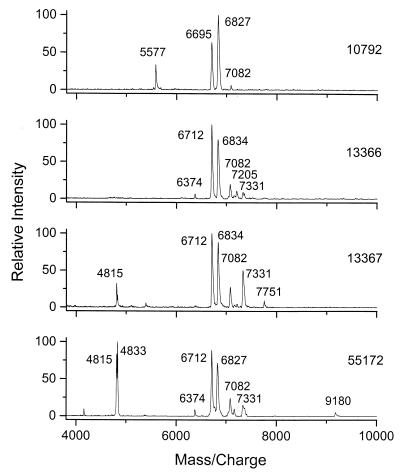
Previously (14), we reported that three B. cereus strains (T, NCTC 8035, and B33) could be distinguished based on the MALDI mass spectra of either intact or CPD-treated spores. Here the spectra of four B. thuringiensis subsp. berliner strains (ATCC strains 10792, 13366, 13367, and 55172) can be compared. Mass spectra of the intact spores are shown in Fig. 2. Overall, the MALDI spectra of the four strains were different. The spectra of strains 13366 and 13367 contained common major peaks; however, these two can be distinguished by the presence of a number of additional peaks in the spectrum of 13367. Treatment of spores by CPD did not improve the differentiation of the group of B. thuringiensis subsp. berliner strains (Fig. 3). However, following sonication, the four spectra displayed more distinctive peaks (Fig. 4 and Table 2).
FIG. 2.
MALDI mass spectra of whole bacterial spore cells of B. thuringiensis subsp. berliner strains 10792, 13366, 13367, and 55172.
FIG. 3.
MALDI mass spectra of CPD-treated spores of B. thuringiensis subsp. berliner strains 10792, 13366, 13367, and 55172.
FIG. 4.
MALDI mass spectra of sonicated spores of B. thuringiensis subsp. berliner strains 10792, 13366, 13367, and 55172.
Effect of growth medium on mass spectra.
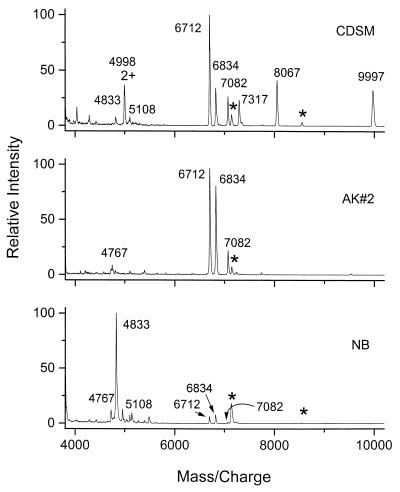
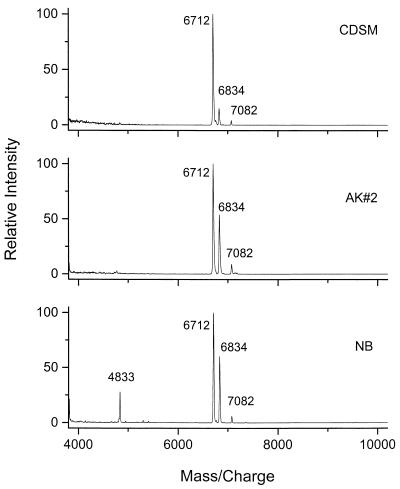
In a prior study, lower-molecular-weight biomarkers were found to be constant in the MALDI spectra of B. globigii spores grown in CDSM, NSM, and CADM (14) and B. thuringiensis subsp. kurstaki spores grown in CDSM, AK#2, and NB media (Y. Hathout, Y. P. Ho, V. Ryzhov, P. A. Demirev, and C. Fenselau, submitted for publication). The effect of growth medium on biomarkers in the higher-mass range of interest in the present study was examined by using B. thuringiensis subsp. kurstaki spores. The spectra obtained from this set of samples and shown in Fig. 5 appear to be more variable. It is reassuring that the ensemble of peaks characteristic of the B. cereus group (m/zs of 6,712, 6,834, and 7,082) is present in all three spectra, although with different relative intensities. After CPD treatment, spectra of the spores grown in the three media displayed the same set of major peaks, the B. cereus group ensemble at m/zs of 6,712, 6,834, and 7,082 (Fig. 6). The MALDI spectra of B. globigii spores grown in different media were also different in the mass range above 4,000. However, MALDI spectra of the CPD-treated spores displayed the same major peak at an m/z of 7,346 (data not shown) for all media. This limited study of the effect of growth medium needs to be expanded. However, it suggests that successful analysis of spectra by library searching will require a reference spectrum associated with each potential growth medium. A more interpretive, decision-based approach would be more practical.
FIG. 5.
Dependence of MALDI mass spectra of B. thuringiensis subsp. kurstaki whole spores on CDSM, AK#2, or NB growth medium. Peaks marked with an asterisk denote calibrants.
FIG. 6.
MALDI mass spectra of CPD-treated B. thuringiensis subsp. kurstaki spores grown in CDSM, AK#2, or NB medium.
Identification of protein biomarkers.
Recently, our laboratory has proposed identification of microorganisms by phyloproteomics (9; Pineda et al., submitted). Vegetative bacteria such as E. coli and B. subtilis were identified from their MALDI spectra by comparing the molecular masses of protein biomarkers determined by MS with the molecular masses of proteins in the SwissProt-TrEMBL database. Extension of this approach to characterization of spores is hampered by detection of limited numbers of biomarkers in the spore spectra. For example, the MALDI mass spectrum of CPD-treated B. subtilis spores contained only 3 peaks in the range of 4,000 to 10,000 m/z (14), compared to 15 peaks in the spectrum of vegetative cells (9). Nevertheless, all three peaks were tentatively matched with molecular masses of proteins in the database (14).
There are now more than 30 organisms with completely known genomes, including the abovementioned E. coli and B. subtilis. Unfortunately, this list does not yet include members of the B. cereus group, although the B. anthracis genome has been almost completely sequenced (www.tigr.org). Anecdotal protein information for these bacteria is scarce in the SwissProt-TrEMBL database. B. cereus has only 28 entries in the m/z range of 4,000 to 10,000, B. anthracis has 26, B. thuringiensis has 9, and B. mycoides has none. However, tentative identifications were made for several of the spore biomarkers observed in the present study. The peak at an m/z of 7,353 in the B. cereus NCTC 8035 spectrum (Table 2) corresponds to the protonated molecular mass of spore germination protein F within 1 Da. The m/z 6,827 peak of B. thuringiensis subsp. berliner strain 55172 (Table 2) matches the protonated molecular mass of spore protein SSPF isolated from B. cereus. Two more biomarkers—one with an m/z of 7,331 in spectra of several strains and one with an m/z of 7,451 from the spectrum of B. cereus B33—match the molecular masses calculated for protonated small acid-soluble spore proteins of other Bacillus species. With the rapid expansion of the protein database, we expect identification of more protein biomarkers.
Conclusions.
The results reported here suggest that MALDI analysis of spore cells provides no pattern of biomarkers characteristic of the entire Bacillus genus. However, the study suggests that MALDI spectra do allow characterization of spores as belonging to the B. cereus group. Spectra of the B. anthracis, B. cereus, and B. thuringiensis species examined contained peaks corresponding to several common biomarkers, most notably m/zs of 6,712, 6,834, and 7,082. These became more evident when spores were treated by CPD or sonication prior to MS analysis. These biomarkers were not observed in B. mycoides, genetically classified with the B. cereus group, or in B. subtilis or B. globigii spores. More individual strains of B. cereus and B. anthracis should be studied to test the hypothesis that this ensemble of peaks can be used to assign B. cereus group identity to unknown samples.
The effects of different growth media on mass spectra may have significant implications for characterization of spores. Although the lipopeptide biomarkers secreted by B. thuringiensis subsp. kurstaki or B. globigii with molecular masses below 2,000 have been observed in spores grown in three different media (14), variation is reported here in the mass range above an m/z of 4,000. The source of the variant biomarkers is under study. Treatment of the spore sample by sonication or CPD released a new set of biomarkers in the m/z range of 6,000 to 8,000, which remained constant regardless of sample growth history.
ACKNOWLEDGMENTS
We thank Danying Zhu for culturing most of the spores used in these studies. Joany Jackman of USAMRIID, Frederick, Md., is gratefully acknowledged for providing some of the spore lines and for helpful discussions.
This work was supported by contracts from the Applied Physics Laboratory of the Johns Hopkins University.
REFERENCES
- 1.Arnold R, Reilly J. Fingerprint matching of E. coli strains with matrix-assisted laser desorption/ionization time-of-flight mass spectrometry of whole cells using a modified correlation approach. Rapid Commun Mass Spectrom. 1998;12:630–636. doi: 10.1002/(SICI)1097-0231(19980529)12:10<630::AID-RCM206>3.0.CO;2-0. [DOI] [PubMed] [Google Scholar]
- 2.Basile F, Beverly M B, Voorhees K J, Hadfield T L. Pathogenic bacteria: their detection and differentiation by rapid lipid profiling with pyrolysis mass spectrometry. Trends Anal Chem. 1998;17:95–109. [Google Scholar]
- 3.Belgrader P, Hansford D, Kovacs G T, Venkateswaran K, Mariella R, Jr, Milanovich F, Nasarabadi S, Okuzumi M, Pourahmadi F, Northrup M A. A minisonicator to rapidly disrupt bacterial spores for DNA analysis. Anal Chem. 1999;71:4232–4236. doi: 10.1021/ac990347o. [DOI] [PubMed] [Google Scholar]
- 4.Beverly M B, Basile F, Voorhees K J, Hadfield T L. A rapid approach for the detection of dipicolinic acid in bacterial spores using pyrolysis mass spectrometry. Rapid Commun Mass Spectrom. 1996;10:455–458. doi: 10.1002/(SICI)1097-0231(19960315)10:4<455::AID-RCM500>3.0.CO;2-Y. [DOI] [PubMed] [Google Scholar]
- 5.Beverly M B, Voorhees K J, Hadfield T L. Direct mass spectrometric analysis of Bacillus spores. Rapid Commun Mass Spectrom. 1999;13:2320–2326. doi: 10.1002/(SICI)1097-0231(19991215)13:23<2320::AID-RCM791>3.0.CO;2-Q. [DOI] [PubMed] [Google Scholar]
- 6.Birmingham J, Demirev P, Ho Y P, Thomas J, Bryden W, Fenselau C. Corona plasma discharge for rapid analysis of microorganisms by mass spectrometry. Rapid Commun Mass Spectrom. 1999;13:604–606. doi: 10.1002/(SICI)1097-0231(19990415)13:7<604::AID-RCM529>3.0.CO;2-M. [DOI] [PubMed] [Google Scholar]
- 7.Claydon M A, Davey S N, Edwards-Jones V, Gordon D B. The rapid identification of intact microorganisms using mass spectrometry. Nat Biotechnol. 1996;14:1584–1586. doi: 10.1038/nbt1196-1584. [DOI] [PubMed] [Google Scholar]
- 8.Dai Y, Li L, Roser D C, Long S R. Detection and identification of low-mass peptides and proteins from solvent suspensions of Escherichia coli by high performance liquid chromatography fractionation and matrix-assisted laser desorption/ionization mass spectrometry. Rapid Commun Mass Spectrom. 1999;13:73–78. doi: 10.1002/(SICI)1097-0231(19990115)13:1<73::AID-RCM454>3.0.CO;2-N. [DOI] [PubMed] [Google Scholar]
- 9.Demirev P A, Ho Y P, Ryzhov V, Fenselau C. Microorganism identification by mass spectrometry and protein database searches. Anal Chem. 1999;71:2732–2738. doi: 10.1021/ac990165u. [DOI] [PubMed] [Google Scholar]
- 10.Erhard M, von Dohren H, Jungblut P. Rapid typing and elucidation of new secondary metabolites of intact cyanobacteria using MALDI-TOF mass spectrometry. Nat Biotechnol. 1997;15:906–909. doi: 10.1038/nbt0997-906. [DOI] [PubMed] [Google Scholar]
- 11.Fenselau C, editor. Mass spectrometry for the characterization of microorganisms (symposium series) Vol. 541. Washington, D.C.: American Chemical Society; 1994. [Google Scholar]
- 12.Fox A, Black G E, Fox K, Rostovtseva S. Determination of carbohydrate profiles of Bacillus anthracis and Bacillus cereus including identification of O-methyl methylpentoses by using gas chromatography-mass spectrometry. J Clin Microbiol. 1993;31:887–894. doi: 10.1128/jcm.31.4.887-894.1993. [DOI] [PMC free article] [PubMed] [Google Scholar]
- 13.Goodacre R, Heald J K, Kell D B. Characterisation of intact microorganisms using electrospray ionisation mass spectrometry. FEMS Microbiol Lett. 1999;176:17–24. [Google Scholar]
- 14.Hathout Y, Demirev P A, Ho Y-P, Bundy J L, Ryzhov V, Sapp L, Stutler J, Jackman J, Fenselau C. Identification of Bacillus spores by matrix-assisted laser desorption ionization-mass spectrometry. Appl Environ Microbiol. 1999;65:4313–4319. doi: 10.1128/aem.65.10.4313-4319.1999. [DOI] [PMC free article] [PubMed] [Google Scholar]
- 15.Heller D N, Cotter R J, Fenselau C, Uy O M. Profiling of bacteria by fast atom bombardment mass spectrometry. Anal Chem. 1987;59:2806–2809. doi: 10.1021/ac00150a018. [DOI] [PubMed] [Google Scholar]
- 16.Henderson I, Duggleby C J, Turnbull P C. Differentiation of Bacillus anthracis from other Bacillus cereus group bacteria with the PCR. Int J Syst Bacteriol. 1994;44:99–105. doi: 10.1099/00207713-44-1-99. [DOI] [PubMed] [Google Scholar]
- 17.Ho Y P, Fenselau C. Applications of 1.06-μm IR laser desorption on a Fourier transform mass spectrometer. Anal Chem. 1998;70:4890–4895. doi: 10.1021/ac980914s. [DOI] [PubMed] [Google Scholar]
- 18.Jarman K H, Cebula S T, Saenz A J, Petersen C E, Valentine N B, Kingsley M T, Wahl K L. An algorithm for automated bacterial identification using matrix-assisted laser desorption/ionization time-of-flight mass spectrometry. Anal Chem. 2000;72:1217–1223. doi: 10.1021/ac990832j. [DOI] [PubMed] [Google Scholar]
- 19.Jarman K H, Daly D S, Petersen C E, Saenz A J, Valentine N B, Wahl K L. Extracting and visualizing matrix-assisted laser desorption/ionization time-of-flight mass spectral fingerprints. Rapid Commun Mass Spectrom. 1999;13:1586–1594. doi: 10.1002/(SICI)1097-0231(19990815)13:15<1586::AID-RCM680>3.0.CO;2-2. [DOI] [PubMed] [Google Scholar]
- 20.Kost J, Mitragotri S, Gabbay R A, Pishko M, Langer R. Transdermal monitoring of glucose and other analytes using ultrasound. Nat Med. 2000;6:347–350. doi: 10.1038/73213. [DOI] [PubMed] [Google Scholar]
- 21.Krishnamurthy T, Ross P L. Rapid identification of bacteria by direct matrix-assisted laser desorption/ionization mass spectrometric analysis of whole cells. Rapid Commun Mass Spectrom. 1996;10:1992–1996. doi: 10.1002/(SICI)1097-0231(199612)10:15<1992::AID-RCM789>3.0.CO;2-V. [DOI] [PubMed] [Google Scholar]
- 22.Krishnamurthy T, Ross P L, Rajamani U. Detection of pathogenic and nonpathogenic bacteria by matrix-assisted laser desorption/ionization time-of-flight mass spectrometry. Rapid Commun Mass Spectrom. 1996;10:883–888. doi: 10.1002/(SICI)1097-0231(19960610)10:8<883::AID-RCM594>3.0.CO;2-V. [DOI] [PubMed] [Google Scholar]
- 23.Leenders F, Stein T H, Kablitz B, Franke P, Vater J. Rapid typing of Bacillus subtilis strains by their secondary metabolites using matrix-assisted laser desorption/ionization mass spectrometry of intact cells. Rapid Commun Mass Spectrom. 1999;13:943–949. [Google Scholar]
- 24.Liang X, Zheng K, Qian M G, Lubman D M. Determination of bacterial protein profiles by matrix-assisted laser desorption/ionization mass spectrometry with high-performance liquid chromatography. Rapid Commun Mass Spectrom. 1996;10:1219–1226. doi: 10.1002/(SICI)1097-0231(19960731)10:10<1219::AID-RCM660>3.0.CO;2-R. [DOI] [PubMed] [Google Scholar]
- 25.Mitragotri S, Blankschtein D, Langer R. Ultrasound-mediated transdermal protein delivery. Science. 1995;269:850–853. doi: 10.1126/science.7638603. [DOI] [PubMed] [Google Scholar]
- 26.Nakamura L K, Jackson M A. Clarification of the taxonomy of Bacillus mycoides. Int J Syst Bacteriol. 1995;45:46–49. [Google Scholar]
- 27.Schnepf E, Crickmore N, Van Rie J, Lereclus D, Baum J, Feitelson J, Zeigler D R, Dean D H. Bacillus thuringiensis and its pesticidal crystal proteins. Microbiol Mol Biol Rev. 1998;62:775–806. doi: 10.1128/mmbr.62.3.775-806.1998. [DOI] [PMC free article] [PubMed] [Google Scholar]
- 28.Snyder A P, Smith P B W, Dworzanski J P, Meuzelaar H L C. Pyrolysis-gas chromatography-mass spectrometry-detection of biological warfare agents. In: Fenselau C, editor. Mass spectrometry for the characterization of microorganisms (symposium series) Vol. 541. Washington, D.C.: American Chemical Society; 1994. pp. 62–84. [Google Scholar]
- 29.Wunschel D, Fox K F, Black G E, Fox A. Discrimination among the Bacillus-cereus group, in comparison to Bacillus-subtilis, by structural carbohydrate profiles and ribosomal-RNA spacer region PCR. Syst Appl Microbiol. 1995;17:625–635. [Google Scholar]


