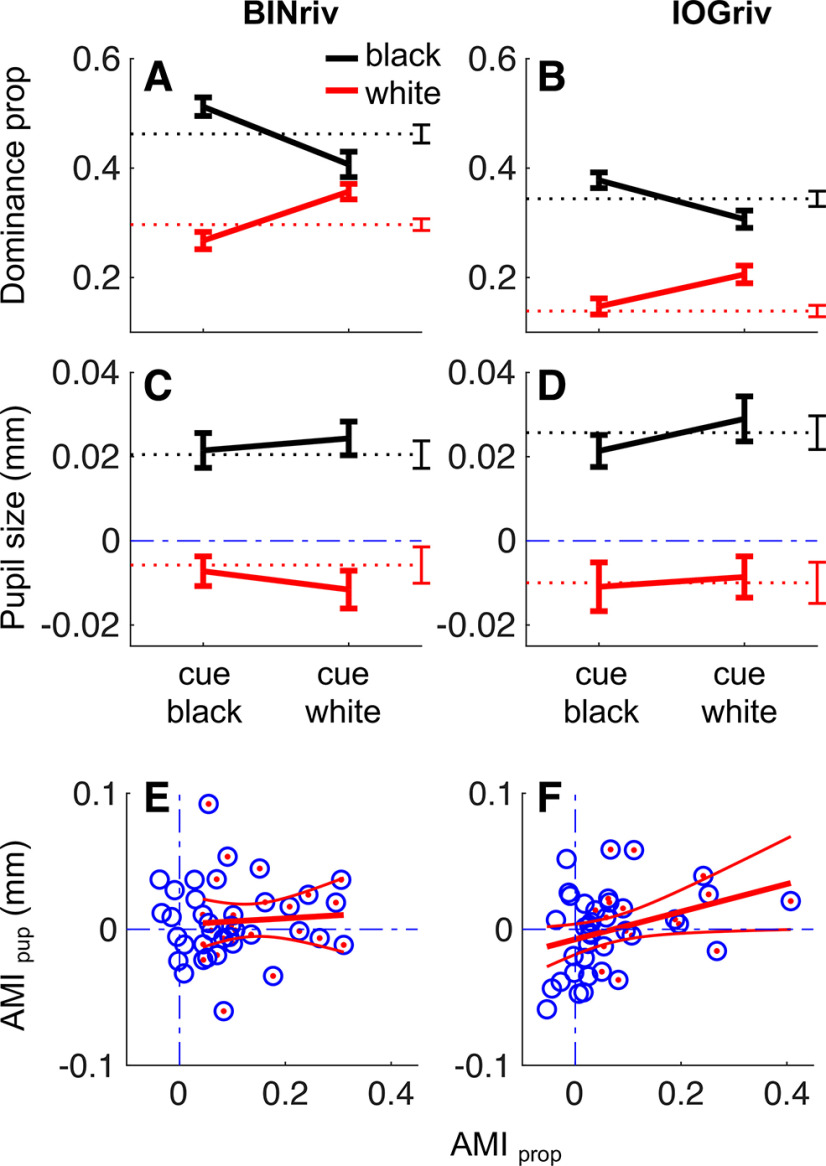
Figure 3.
Attention cueing affect perceptual alternations but not pupil modulations. A, B, Perceptual dominance for exclusive white or black disk percepts, without attentional cueing (dashed lines) or when the white or the black disk percept were cued (continuous lines, cueing condition indicated on the abscissa). Error bars report ±1 SE across participants. C, D, Baseline corrected average pupil size computed in a fixed temporal window (between –0.5 and 1 s from the perceptual transition) during phases of exclusive dominance of the black (black line) and the white disk (red line). Results from the no-cueing condition are reported by dashed lines. Continuous lines report the results from the trials where the white or the black percepts were cued (separated on the abscissa). Error bars report ±1 SE across participants. E, F, Individual participants’ attentional modulation indices for perceptual dominance (x-axis) and pupil size (y-axis), computed with Equations 3, 4. Dash-dot blue lines mark the x = 0 and y = 0 lines, indicating no effect of attention cueing. Each circle reports results from one participant; red dots highlight participants with a significant attentional modulation index for perceptual dominance. Red lines show the best fitting line and its 95% confidence intervals. In all panels, the left column reports results for binocular rivalry and the right for interocular grouping rivalry.

