

Abstract
The phylogenetic diversity of the bacterial communities supported by a seven-stage, full-scale biological wastewater treatment plant was studied. These reactors were operated at both mesophilic (28 to 32°C) and thermophilic (50 to 58°C) temperatures. Community fingerprint analysis by denaturing gradient gel electrophoresis (DGGE) of the PCR-amplified V3 region of the 16S rRNA gene from the domain Bacteria revealed that these seven reactors supported three distinct microbial communities. A band-counting analysis of the PCR-DGGE results suggested that elevated reactor temperatures corresponded with reduced species richness. Cloning of nearly complete 16S rRNA genes also suggested a reduced species richness in the thermophilic reactors by comparing the number of clones with different nucleotide inserts versus the total number of clones screened. While these results imply that elevated temperature can reduce species richness, other factors also could have impacted the number of populations that were detected. Nearly complete 16S rDNA sequence analysis showed that the thermophilic reactors were dominated by members from the β subdivision of the division Proteobacteria (β-proteobacteria) in addition to anaerobic phylotypes from the low-G+C gram-positive and Synergistes divisions. The mesophilic reactors, however, included at least six bacterial divisions, including Cytophaga-Flavobacterium-Bacteroides, Synergistes, Planctomycetes, low-G+C gram-positives, Holophaga-Acidobacterium, and Proteobacteria (α-proteobacteria, β-proteobacteria, γ-proteobacteria and δ-proteobacteria subdivisions). The two PCR-based techniques detected the presence of similar bacterial populations but failed to coincide on the relative distribution of these phylotypes. This suggested that at least one of these methods is insufficiently quantitative to determine total community biodiversity—a function of both the total number of species present (richness) and their relative distribution (evenness).
Most municipal and industrial wastewaters generated in industrialized nations are treated to prevent the deterioration of surface water quality. Aerobic biological strategies are commonly used to treat wastewater containing soluble and particulate organic material. These bioreactors support mixed consortia of microorganisms that can simultaneously convert a broad spectrum of compounds into new cells, innocuous byproducts, carbon dioxide, and water. In spite of the importance of these processes, there is only a limited understanding of the relationship between microbial community structure and function. This is largely due to an inability to cultivate a large fraction of the organisms identified by direct counts, typically less than 15% for wastewater treatment processes (3).
Recent developments in cultivation-independent techniques, such as the rRNA approach (25), now permit considerably more detailed and accurate analysis of mixed microbial communities. These studies have confirmed the presence of complex microbial communities that are likely the underlying reason for the functionally robust nature of biological wastewater treatment systems (for examples, see references 2, 5, 22, and 33). These studies have generally demonstrated that the dominant members of aerobic reactors treating municipal wastewater are from the β subdivision of the division Proteobacteria (5, 22, 33). Manz et al. (22), however, found that the dominant members of an industrial treatment facility were from the Cytophaga-Flavobacterium-Bacteriodes division. Nonetheless, there have been very few studies investigating how different operating variables (temperature, pH, etc.) impact bacterial community structure and diversity.
Our recent efforts have focused on the investigation of thermophilic aerobic biological treatment processes. These systems are often reported to be advantageous compared to conventional treatment processes because of more-rapid biodegradation rates and reduced cell yield without loss of physiological function (29, 34). However, the results from our laboratory studies suggest that thermophilic reactors are less adept at simultaneously utilizing multiple substrates (19) and in achieving efficient removal of carbonaceous substances (T. M. LaPara, C. H. Nakatsu, L. M. Pantea, and J. E. Alleman, submitted for publication) compared to analogous mesophilic systems. Our hypothesis was that these reductions in reactor function were associated with a reduction in reactor microbial diversity. Preliminary results provided by denaturing gradient gel electrophoresis (DGGE) of PCR-amplified 16S rRNA genes suggested that fewer distinct phylotypes were present in bench-scale thermophilic bioreactors as determined by band counting (16, 19).
Herein, we analyze the bacterial community structures from a full-scale industrial wastewater treatment facility consisting of seven reactors operated in series. This treatment facility is quite unique (10); its first four reactors are typically operated at thermophilic temperatures (45 to 65°C), while the final three reactors are operated at much lower temperatures (25 to 35°C). The objective of this study was to determine if the thermophilic reactors supported reduced biodiversity compared to the mesophilic reactors. The phylogenetic diversity of the thermophilic and mesophilic bioreactors was studied by two complementary methods: (i) PCR-DGGE of the variable V3 region of the 16S rRNA gene and (ii) cloning and determination of the nucleotide sequence of nearly complete 16S rRNA genes amplified by PCR.
MATERIALS AND METHODS
Study site.
The wastewater treatment facility consists of seven consecutive biological reactors with temperatures ranging from as high as 58°C in the first four tanks to as low as 28°C in the last three tanks. A process flow schematic, the relative size of each of these reactors, and their temperatures at the time of sampling are shown in Fig. 1. The first four tanks operate at temperatures exceeding 45°C without cell recycling, due to poor bacterial flocculation. The final three tanks are operated as a modified Ludzack-Ettinger (MLE) process that achieves both nitrification and denitrification. The mean solids retention time of each of these final three reactors is 10 days. The chemical oxygen demand of the untreated wastewater has historically varied between 5,000 and 15,000 mg 1−1. This treatment facility treats wastewater generated by three different fermentation processes.
FIG. 1.

Process flow schematic of the industrial wastewater treatment facility studied. Relative tank sizes are shown as HRT values. Temperatures shown indicate values at the time of sampling.
Sample collection and nucleic acid extraction.
Samples were collected from each of the seven full-scale biological treatment reactors during a 30-min period on 3 August 1998. Approximately 40 ml of well-mixed reactor samples was collected and centrifuged (10 min; 10,000 × g). The pellet was resuspended in 10 ml of lysis buffer (120 mM sodium phosphate buffer [pH 8.0], 5% sodium dodecyl sulfate), divided into 1.5-ml aliquots, and stored frozen at −20°C within 1 h of sample collection. Cells were lysed by performing a 75-min incubation at 70°C followed by two consecutive freeze-thaw cycles. Total DNA was then purified from this solution using the FastDNA Spin kit per the manufacturer's instructions (BIO 101; Vista, Calif.).
PCR-DGGE.
Partial 16S rRNA genes were amplified from the extracted genomic DNA by PCR using a PTC 100 thermal cycler (MJ Research, Inc., Watertown, Mass.). The variable V3 region of the 16S rRNA gene from members of the domain Bacteria was amplified using the PRBA338F primer (5′-ACTCCTACGGGAGGCAGCAG-3′; Escherichia coli positions 338 to 358) (18) and the PRUN518R primer (5′-ATTACCGCGGCTGCTGG-3′; E. coli positions 534 to 518) with a GC clamp (23). The final 50-μl reaction mixture contained 1× PCR buffer (Promega, Madison, Wis.), 175 μmol of MgCl2, 4 nmol of deoxynucleoside triphosphates, 2% bovine serum albumin, 100 pmol (each) of forward and reverse primers, 2 units of Taq polymerase, and ∼1 ng of template DNA. The PCR protocol included a 5-min initial denaturation at 94°C, 30 cycles of 92°C for 30 s, 55°C for 30 s, and 72°C for 30s, followed by 7 min at 72°C and incubation at 4°C until processed further.
DGGE was performed on a D-Gene apparatus (Bio-Rad, Hercules, Calif.). Samples containing approximately equal amounts of PCR amplicons were loaded onto 8% (wt/vol) polyacrylamide gels (37.5:1, acrylamide:bisacrylamide) in 0.5× Tris-acetate-EDTA (TAE) (31) with a denaturing gradient ranging from 30 to 60% denaturant (100% denaturant contains 7 M urea and 40% [vol/vol] formamide in 0.5× TAE). Electrophoresis was performed at 60°C, initially at 20 V (15 min) and then at 200 V (270 min). Following electrophoresis, the gel was stained with SYBR Green I (Molecular Probes, Eugene, Oreg.; diluted 1:5,000 in 0.5× TAE), visualized on a UV transillumination table, and photographed. Photographs were digitized and analyzed using Adobe Photoshop, version 5.0. Band intensities were determined using Scion Image software (Scion Corp., Frederick, Md.).
Amplification, cloning, and nucleotide sequence determination.
Nearly complete 16S rRNA genes were PCR amplified from genomic extracts (described above) with the pA (5′-AGAGTTTGATCCTGGCTCAG-3′; E. coli positions 8 to 27) and pH (5′-AAGGAGGTGATCCAGCCGCA-3′; E. coli positions 1541 to 1522) primers (11). The final 50-μl reaction mixture contained 1× PCR buffer, 75 μmol of MgCl2, 4 nmol of deoxynucleoside triphosphates, 100 pmol (each) of forward and reverse primers, 2 units of Taq polymerase, and 50 to 100 ng of template DNA. The PCR protocol included a 5-min initial denaturation at 95°C, 30 cycles of 94°C for 30 s, 55°C for 30 s, and 72°C for 30 s, followed by 10 min at 72°C and incubation at 4°C until processed further.
PCR amplicons were purified with a Wizard PCR Prep kit per the manufacturer's instructions (Promega) and ligated into the pGEM-T cloning vector (Promega). Ligated DNA was transformed into competent E. coli DH5α cells (31). Plasmid inserts were extracted by the alkaline lysis method (31). Different 16S rDNA sequences were identified by PCR-DGGE (described above) as determined by differential band migration.
Nucleotide sequences were determined using the Thermo Sequenase cycle sequencing kit (Amersham Pharmacia Biotech, Piscataway, N.J.) and an ALFexpress automated sequencer (Amersham Pharmacia Biotech). Nucleotide sequences of all clones were determined at least twice.
Data analysis.
Nucleotide sequences were compared with sequences in the GenBank database (4) with the BLASTn program (1) and the SEQUENCE_MATCH program using the Ribosomal Database Project (RDP) database (21). Nucleotide sequences were also checked for possible chimeric sequences with the CHECK_CHIMERA program at the RDP website. Putative chimeric sequences were also manually split into three different components and resubmitted to RDP to determine if the segments were from distinct phylogenetic groups.
Phylogenetic trees were constructed by the neighbor-joining method (30) using DNAMAN version 4.1 software (Lynnon Biosoft, Vaudreuil-Dorion, Quebec, Canada). Different nucleotide sequences were arbitrarily clustered into groups with similarities of >97% to reduce the size of the dendrograms. Reference nucleotide sequences used in tree construction were obtained from the GenBank database. Nearly complete 16S rDNA sequences (>1,500 bp) from this study as well as reference sequences were optimally aligned (13, 37) prior to tree construction.
Nucleotide sequence accession numbers.
The nucleotide sequences obtained in this study have been deposited in the GenBank database under accession no. AF280819 to AF280867.
RESULTS
Fingerprinting of reactor communities by DGGE.
Bacterial community structures of the seven bioreactors were initially screened by DGGE of the PCR-amplified variable V3 region of the 16S rRNA gene (Fig. 2). The first three bioreactors (TBR1, TBR2, and TBR3), operated at temperatures from 54 to 58°C and a hydraulic retention time (HRT) of 7 h, had community fingerprints similar to each other but unique compared to the other four reactors. The fourth bioreactor (TBR4), operating at a temperature of 50°C and an HRT of 15 h, had several bands that comigrated with those from TBR1 through TBR3 but still had a unique fingerprint compared to the other six samples. The last three bioreactors (MLE1, MLE2, and MLE3), each operating at temperatures of 28 to 32°C, an HRT of 4 days, and a mean solids retention time of 10 days, had community fingerprints similar to each other but unique compared to the other four reactors. The total number of discernible bands was as follows: TBR1 through TBR3, 15 bands; TBR4, 22 bands; and MLE1 through MLE3, 30 bands.
FIG. 2.
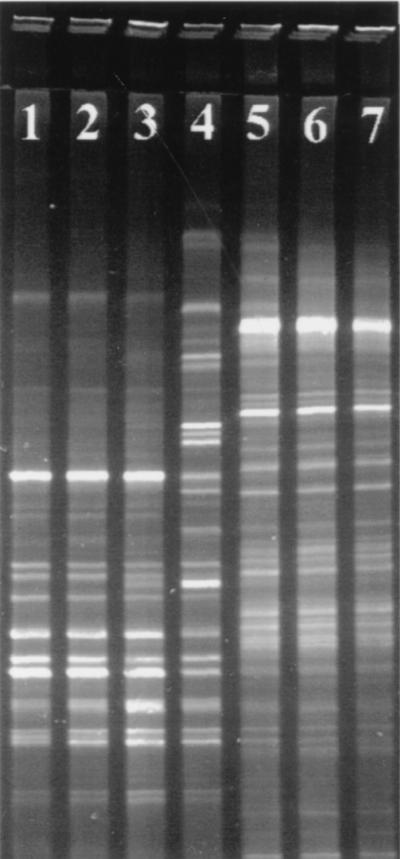
DGGE community fingerprints of the consortia supported by the seven-stage reactor system studied. Individual lanes contain 16S rDNA PCR products from total DNA extracts. Lane 1, TBR1; lane 2, TBR2; lane 3, TBR3; lane 4, TBR4; lane 5, MLE1; lane 6, MLE2; lane 7, MLE3.
Identification of community members by 16S rDNA libraries.
Bacterial diversity found in these bioreactors was further investigated by cloning PCR-amplified, nearly complete 16S rRNA genes. Clone libraries were constructed from each of the three unique bacterial communities that were revealed by PCR-DGGE, using TBR1, TBR4, and MLE1 as representative samples. A total of 144 clones (19 from TBR1, 80 from TBR4, and 45 from MLE1) were screened by PCR amplification of the V3 region of these inserts, followed by DGGE to identify clones with different melting characteristics. Using this approach, 9 different 16S rRNA genes were identified from TBR1, 10 from TBR4, and 31 from MLE1. Collector's curves showing the number of clones with different nucleotide sequences versus the total number of clones analyzed revealed plateau-shaped plots for the TBR1 and TBR4 clones (Fig. 3), although collector's curve plots of the MLE1 clones failed to plateau (Fig. 3). The plot for TBR1 followed the same pattern as that for TBR4 (data not shown).
FIG. 3.

Collector's curves of the unique E. coli clones with 16S rDNA inserts versus the total number of clones screened from TBR4 and MLE1. The collector's curve from TBR1 was similar to that from TBR4 (data not shown). ○, TBR4; ●, MLE1.
Clones with nearly complete 16S rDNA inserts corresponded to the majority of bands in the PCR-DGGE fingerprints for TBR1 through TBR3 (Fig. 4) and MLE1 through MLE3 (data not shown). However, there were some discrepancies, such as clone tbr1-14 (Fig. 4, lane 10), which failed to correspond to any specific band in the mixed-genomic PCR-DGGE. Conversely, the most intense band in the mixed-genomic PCR-DGGE from MLE1 through MLE3 (Fig. 2, lanes 5 to 7) had no corresponding 16S rDNA clone (data not shown). Furthermore, a comparison between PCR-DGGE band intensities revealed no obvious correlation with clone frequency (Fig. 5). Clones containing nearly complete 16S rDNA from TBR4, however, corresponded to a fraction of bands (∼70%) in the PCR-DGGE fingerprint. Therefore, additional cloning was performed on PCR amplicons of the variable V3 region of the 16S rRNA gene. Another 46 clones were screened, including 4 clones that corresponded to previously unmatched bands in the PCR-DGGE for TBR4 (data not shown).
FIG. 4.

Comparison of DGGE fingerprints of the TBR1 mixed community to E. coli clones containing complete 16S rRNA genes. Numbers in parentheses represent the percentage of the particular TBR1 clone out of the total number of clones screened. Lanes 1 and 11, TBR1 community; lane 2, clone tbr1-10; lane 3, clone tbr1-8; lane 4, clone tbr1-1; lane 5, clone tbr1-9; lane 6, clone tbr1-2; lane 7, clone tbr1-13; lane 8, clone tbr1-3; lane 9, clone tbr1-4; lane 10, clone tbr1-14.
FIG. 5.

Comparison between PCR-DGGE band intensities and nearly complete 16S rDNA clone frequencies from TBR1. Numbers along the abscissa denote PCR-DGGE bands without a corresponding 16S rDNA clone. Phylotypes detected by both PCR-DGGE and cloning are denoted by their clone designation.
Nucleotide sequence analysis.
Nucleotide sequences were determined for 50 nearly complete 16S rDNA clones and 4 partial 16S rDNA clones. No chimeric sequences were found among the clones from TBR1 and TBR4, but four chimeric sequences were found among the clones from MLE1 and were discarded from further analysis. With the BLASTn and/or SEQUENCE_MATCH algorithms, the majority of the nearly complete 16S rDNA nucleotide sequences had >90% similarity to reference strains found in the GenBank and RDP databases (Table 1). One of the TBR1 clones was tentatively identified as one of the fermentation process organisms (data not shown) and discarded from further analysis for confidentiality reasons. Partial TBR4 nucleotide sequences were related to sequences from the γ-proteobacteria subdivision (three clones) and Verrucomicrobium division (one clone).
TABLE 1.
Sequence length and closest phylogenetic affiliation of the clones analyzed in this study
| Clone no. | Sequence length (bases) | Phylogenetic relationship
|
||
|---|---|---|---|---|
| Species | Accession no. | % Similarity | ||
| tbr1-1 | 1,526 | Clostridium hastiforme | X80841 | 91.6 |
| tbr1-2 | 1,514 | Thermanaerovibrio acidaminovorans | AF071414 | 97.7 |
| tbr1-3 | 1,528 | β-Proteobacterium HMD 444 | AB015328 | 98.8 |
| tbr1-4 | 1,524 | β-Proteobacterium HMD 444 | AB015328 | 98.4 |
| tbr1-8 | 1,587 | Thermoanaerobacterium thermosulfurigenes | L09171 | 97.4 |
| tbr1-9 | 1,524 | Clostridium ultanese | Z69293 | 90.6 |
| tbr1-10 | 1,512 | Clostridium indolis | AF028351 | 88.4 |
| tbr1-14 | 1,540 | β-Proteobacterium HMD 444 | AB015328 | 93.4 |
| tbr4-2 | 1,528 | β-Proteobacterium HMD 444 | AB015328 | 98.3 |
| tbr4-5 | 1,528 | β-Proteobacterium HMD 444 | AB015328 | 98.9 |
| tbr4-7 | 1,512 | Thermanaerovibrio acidaminovorans | AF071414 | 97.7 |
| tbr4-10 | 1,527 | β-Proteobacterium HMD 444 | AB015328 | 98.1 |
| tbr4-15 | 1,513 | Clostridium termitidis | X71854 | 89.6 |
| tbr4-23 | 1,535 | β-Proteobacterium HMD 444 | AB015328 | 92.9 |
| tbr4-24 | 1,526 | β-Proteobacterium HMD 444 | AB015328 | 98.6 |
| tbr4-27 | 1,544 | β-Proteobacterium HMD 444 | AB015328 | 92.2 |
| tbr4-67 | 1,526 | β-Proteobacterium HMD 444 | AB015328 | 98.6 |
| tbr4-78 | 1,587 | Thermoanaerobacterium thermosulfurigenes | L09171 | 97.4 |
| tbr4-84 | 196 | Unidentified γ-proteobacterium | AB010854 | 95.4 |
| tbr4-92 | 193 | Unidentified rumen bacterium | AF018466 | 89.1 |
| tbr4-118 | 197 | Pseudomonas species | AJ007005 | 97.0 |
| tbr4-119 | 198 | Verrucomicrobium species | X99392 | 93.8 |
| mle1-2 | 1,519 | Bacteroides distasonis | M86695 | 91.1 |
| mle1-3 | 1,527 | β-Proteobacterium HMD 444 | AB015328 | 98.9 |
| mle1-4 | 1,484 | Mycoplana ramosa | D13944 | 91.9 |
| mle1-5 | 1,515 | Thermanaerovibrio acidaminovorans | AF071414 | 97.5 |
| mle1-6 | 1,519 | Hydrogenophaga palleronii | AF078769 | 97.3 |
| mle1-7 | 1,531 | Pseudomonas lemoignei | X92555 | 90.0 |
| mle1-8 | 1,571 | Planctomyces maris | AJ231184 | 77.1 |
| mle1-9 | 1,506 | Acidaminococcus fermentans | X78017 | 82.5 |
| mle1-12 | 1,505 | Spirulina species | X75044 | 84.2 |
| mle1-13 | 1,482 | Rhodospirillum salinarum | D14432 | 89.3 |
| mle1-14 | 1,530 | β-Proteobacterium HMD 444 | AB015328 | 98.8 |
| mle1-16 | 1,539 | Bacillus methanolicus | X64465 | 81.8 |
| mle1-19 | 1,521 | Leptothrix cholodnii | X97070 | 96.2 |
| mle1-20 | 1,458 | Rhodobacter veldkampii | D16421 | 96.2 |
| mle1-22 | 1,505 | Nannocystis exedens | AJ233947 | 96.8 |
| mle1-25 | 1,546 | Clone iii3-7 | Z95731 | 97.7 |
| mle1-27 | 1,545 | Clone OPB55 | AF026993 | 81.8 |
| mle1-29 | 1,549 | Polyangium species | M94280 | 96.8 |
| mle1-31 | 1,541 | Desulfobacterium macestii | AJ237604 | 98.7 |
| mle1-32 | 1,528 | β-Proteobacterium HMD 444 | AB015328 | 99.8 |
| mle1-33 | 1,535 | Uncultured bacterium H2O | AF072920 | 93.8 |
| mle1-41 | 1,517 | Pirellula species | X81938 | 88.2 |
| mle1-42 | 1,513 | Clone vadinCA02 | U81706 | 96.3 |
| mle1-43 | 1,529 | β-Proteobacterium HMD 444 | AB015328 | 98.8 |
| mle1-44 | 1,477 | Mesorhizobium tianshanense | AF041447 | 97.3 |
| mle1-45 | 1,541 | Xanthomonas campestris | AF123092 | 94.9 |
| mle1-48 | 1,476 | Uncultured bacterium SJA-15 | AJ009453 | 83.2 |
Dendrograms were generated to help visualize the phylogenetic relationships between the nucleotide sequences determined from TBR1 and TBR4 clones (Fig. 6) and MLE1 clones (Fig. 7) and those of previously established bacterial lineages. Clones from the two thermophilic reactors grouped with the β subdivision of the Proteobacteria division as well as the low-G+C gram-positive and Synergistes divisions. The MLE1 clones contained representatives from the following bacterial divisions: Cytophaga-Flavobacterium-Bacteroides, Synergistes, Planctomycetes, low-G+C gram-positives, Holophaga-Acidobacterium, and Proteobacteria (α-proteobacteria, β-proteobacteria, δ-proteobacteria, and γ-proteobacteria subdivisions). Numerous MLE1 clones that had relatively low similarity to reference sequences (<85%) also were not closely associated with any known bacterial division shown in Fig. 7.
FIG. 6.

Neighbor-joining tree showing the phylogenetic relationship of TBR1 and TBR4 clones aligned with reference strains from the domain Bacteria based on 16S rDNA sequences. Bootstrap values are shown for nodes that had >50% support in a bootstrap analysis of 10,000 replicates. Clones studied herein are presented in boldface. Clones with >97% similarity were clustered and are listed on the same tree branch. The scale bar indicates an estimated change of 5%. CFB, Cytophaga-Flavobacterium-Bacteroides division.
FIG. 7.

Neighbor-joining tree showing the phylogenetic relationship of MLE1 clones aligned with reference strains from the domain Bacteria based on 16S rDNA sequences. Bootstrap values are shown for nodes that had >50% support in a bootstrap analysis of 10,000 replicates. Clones studied herein are presented in boldface. Clones with >97% similarity were clustered and are listed on the same tree branch. The scale bar indicates an estimated change of 5%. Arrows identify clones that do not associate well with any known bacterial division. CFB, Cytophaga-Flavobacterium-Bacteroides division.
DISCUSSION
Cultivation-independent analysis of bacterial community structure in seven full-scale bioreactors operated at both thermophilic and mesophilic temperatures revealed findings similar to those found in previous bench-scale studies investigating biological wastewater treatment as impacted by elevated temperatures. PCR-DGGE results suggested by a simple band-counting approach (30 versus 15 to 20 bands) that the bacterial community supported by the mesophilic reactors (MLE1 through MLE3) supported a greater number of bacterial populations than the thermophilic reactors (TBR1 through TBR4). That is, assuming each DGGE band is representative of a specific bacterial population, then the number of distinctive bands is proportional to total community richness. This result was corroborated by analogous data by comparing the number of nearly complete 16S rDNA clones obtained from each of these three distinct communities. Collector's curves showed that the plateau level from plots of clones found in the mesophilic reactors (>31 unique phylotypes) was much greater than that of either of the two thermophilic reactors studied (9 to 10 unique phylotypes). This reduction in the number of bacterial populations at higher temperatures is consistent with our previous laboratory studies (16, 19). These studies also demonstrated that the thermophilic microorganisms growing in these bioreactors were less capable of simultaneously utilizing multiple substrates (19), maintaining membrane integrity under substrate-depleted conditions (16), and achieving efficient chemical oxygen demand removal (LaPara et al., submitted).
Nucleotide sequence data (Table 1) further suggested that the compositions of the mesophilic and thermophilic communities were of different phylogenetic distributions. Nearly complete 16S rDNA clones from the thermophilic reactors all grouped with the β-proteobacteria and anaerobic members of the low-G+C gram-positive bacteria and Synergistes divisions (Fig. 6). Conversely, clones from MLE1 were more broadly distributed phylogenetically, grouping into at least six different divisions (including four Proteobacteria subdivisions). The largest fraction of the MLE1 clones were Proteobacteria (57%), of which 60% were from the β subdivision; these distributions are similar to previous studies of other mesophilic wastewater treatment reactors (5, 33).
Critical analysis of the clones suggests that these results may overestimate the richness of physiologically active microorganisms. In the thermophilic reactors, several phylotypes were detected that clustered with obligate anaerobes in the low-G+C gram-positive and Synergistes divisions (Fig. 6). The presence of anaerobic environments within these four reactors seems unlikely because of the aggressive aeration employed and the lack of microbial floccule particles (20) that could offer an anaerobic microenvironment. Although speculative, the presence of inactive anaerobes in these reactors seems plausible if these anaerobic phylotypes originally grew in the equalization tank (Fig. 1), which is not aerated, and then flowed into the aerated reactors along with the wastewater. These cells need not be active to be detected; it requires only that their DNA remain intact to be extracted and then amplified by PCR (36). If these phylotypes were indeed anaerobic and physiologically inactive, then the richness of the active bacterial community in thermophilic reactors would be about half of that suggested by the nearly complete 16S rDNA cloning.
Likewise, several 16S rDNA clones from MLE1 were highly related to some of the TBR1 and TBR4 clones (mle1-3, mle1-5, mle1-14, mle1-32, and mle1-43). Assuming that these phylotypes were physiologically adapted to thermophilic temperatures, it is unlikely that they were also functionally dominant in the mesophilic reactors. Nonetheless, a comparison of the plateau values from the collector's curves of the MLE1 and TBR4 clones suggests at least a threefold decrease in species richness from mesophilic to thermophilic reactor temperatures, respectively. A similar study observed a twofold reduction in richness with anaerobic bioreactors operated at thermophilic temperatures compared to those at mesophilic temperatures (32).
The present study is unique in that two different PCR-based methods of community analysis were used. Each should provide analogous data, but each with its particular advantages and disadvantages. PCR-DGGE is a convenient tool for analyzing community shifts but involves only a small region (∼200 bp) of the 16S rRNA gene. Cloning of PCR-amplified, nearly complete 16S rDNA provides more definitive phylogenetic data because, simply put, it involves a larger portion of the 16S rRNA gene. The cloning approach, however, is considerably more cumbersome and time consuming. Our goal for this study was to use PCR-DGGE to serve as a screening tool to optimize the implementation of 16S rDNA cloning and nucleotide sequencing. However, our results from these two PCR-based methods reveal inconsistencies that require further discussion.
The two PCR-based techniques provided quite similar data as far as the different phylotypes that were detected in TBR1 and MLE1. For example, in TBR1 only three PCR-DGGE bands had no corresponding clone, and only one clone (tbr1-14) had no corresponding PCR-DGGE band (Fig. 4). In two instances, single clones appeared to correspond to two distinguishable PCR-DGGE bands (Fig. 4, lanes 7 and 9), indicating that simple counts of band numbers may slightly overestimate total community richness. Conversely, counting PCR-DGGE bands could underestimate species richness if PCR amplicons of different sequences comigrated. The correlation between the phylotypes detected by PCR-DGGE and cloning was not as good with TBR4; cloning and determination of the nucleotide sequence of the PCR-amplified V3 region of 16S rRNA genes revealed that these populations were phylogenetically distinct (δ-proteobacteria subdivision and Verrucomicrobium division) compared to the nearly complete 16S rDNA clones obtained from TBR1 or TBR4. The discrepancies in the phylotypes revealed by these two PCR-based techniques are potentially caused by differences in the quality of match between primers and template (i.e., the number and location of mismatches) within members of the domain Bacteria.
While both PCR primer sets jointly identified several phylotypes in each reactor studied, the relative distribution of these phylotypes (i.e., DGGE band intensity versus clone frequency [Fig. 5]) was sufficiently inconsistent to suggest that at least one of these PCR-based techniques used to analyze 16S rRNA genes is not appropriate to determine overall community biodiversity—a function of both community richness and evenness. Numerous experimental artifacts can be introduced at each of the analytical steps employed by the approach, including sample storage (28), DNA extraction (39), PCR (12, 14, 15, 26, 35), DGGE (7, 17, 38), and cloning (26). Although reasonable attempts were made to avoid these biases, discrepancies still arose between the two PCR-based analyses used. There was a generally poor correlation between individual band intensity revealed by PCR-DGGE and the corresponding fraction of total clones screened for the same phylotype (Fig. 5). This poor correlation was possibly caused by quantitative biases that occur with mixed-genomic template PCR (15) with one or both primer sets. A recent study (6) has concluded that the primers used to amplify the V3 region of 16S rRNA gene produce a quantitative relationship between gene copy number and PCR-DGGE band intensity; however, other factors, such as the number of rRNA genes per genome (24), genomes per cell, and size of the genome (12), still must be considered prior to correlating results to absolute numbers of cells.
In conclusion, the seven full-scale bioreactors used to treat a pharmaceutical wastewater supported at least three distinct microbial communities. Four of these reactors, operated at thermophilic temperatures, supported fewer distinct bacterial populations than the remaining three mesophilic reactors. The PCR-based techniques used for cultivation-independent analysis of these mixed microbial communities were inconsistent in showing the relative distribution of phylotypes, suggesting that total community biodiversity (a measure of both richness and evenness) could not be assayed by one or both approaches. Future attempts to analyze the total biodiversity of mixed microbial communities should therefore complement these PCR-based techniques, which routinely reveal unique phylotypes (5, 33) but may not do so in a quantitative manner, with more quantitative techniques such as in situ hybridization (2, 3) or quantitative slot blot hybridization (8, 9) to measure species evenness.
ACKNOWLEDGMENT
This work was supported financially by Tippecanoe Laboratories, Eli Lilly and Company.
REFERENCES
- 1.Altschul S F, Madden T L, Schäffer A A, Zhang J, Zhang Z, Miller W, Lipman D J. Gapped BLAST and PSI-BLAST: a new generation of protein database search programs. Nucleic Acids Res. 1997;25:3389–3402. doi: 10.1093/nar/25.17.3389. [DOI] [PMC free article] [PubMed] [Google Scholar]
- 2.Amann R, Snaidr J, Wagner M, Ludwig W, Schleifer K-H. In situ visualization of high genetic diversity in a natural microbial community. J Bacteriol. 1996;178:3496–3500. doi: 10.1128/jb.178.12.3496-3500.1996. [DOI] [PMC free article] [PubMed] [Google Scholar]
- 3.Amann R I, Ludwig W, Schleifer K-H. Phylogenetic identification and in situ detection of individual microbial cells without cultivation. Microbiol Rev. 1995;59:143–169. doi: 10.1128/mr.59.1.143-169.1995. [DOI] [PMC free article] [PubMed] [Google Scholar]
- 4.Benson D A, Boguski M S, Lipman D J, Ostell J, Ouellette B F F, Rapp B A, Wheeler D L. GenBank. Nucleic Acids Res. 1999;27:12–17. doi: 10.1093/nar/27.1.12. [DOI] [PMC free article] [PubMed] [Google Scholar]
- 5.Bond P L, Hugenholtz P, Keller J, Blackall L L. Bacterial community structure of phosphate-removing and non-phosphate-removing activated sludges from sequencing batch reactors. Appl Environ Microbiol. 1995;61:1910–1916. doi: 10.1128/aem.61.5.1910-1916.1995. [DOI] [PMC free article] [PubMed] [Google Scholar]
- 6.Brüggemann J, Stephen J R, Chang Y-J, Macnaughton S J, Kowalchuk G A, Kline E, White D C. Competitive PCR-DGGE analysis of bacterial mixtures: an internal standard and an appraisal of template enumeration accuracy. J Microbiol Methods. 2000;40:111–123. doi: 10.1016/s0167-7012(99)00126-8. [DOI] [PubMed] [Google Scholar]
- 7.Buchholz-Cleven B E E, Rattunde B, Straub K L. Screening for genetic diversity of isolates of anaerobic Fe(II)-oxidizing bacteria using DGGE and whole-cell hybridization. Syst Appl Microbiol. 1997;20:301–309. [Google Scholar]
- 8.Buckley D H, Graber J R, Schmidt T M. Phylogenetic analysis of nonthermophilic members of the kingdom Crenarchaeota and their diversity and abundance in soils. Appl Environ Microbiol. 1998;64:4333–4339. doi: 10.1128/aem.64.11.4333-4339.1998. [DOI] [PMC free article] [PubMed] [Google Scholar]
- 9.de los Reyes F L, Ritter W, Raskin L. Group-specific small-subunit rRNA hybridization probes to characterize filamentous foaming in activated sludge systems. Appl Environ Microbiol. 1997;63:1107–1117. doi: 10.1128/aem.63.3.1107-1117.1997. [DOI] [PMC free article] [PubMed] [Google Scholar]
- 10.Eckenfelder W W, Musterman J L. Activated sludge treatment of industrial wastewater. Lancaster, Pa: Technomic; 1995. [Google Scholar]
- 11.Edwards U, Rogall T, Blöcker H, Emde M, Böttger E C. Isolation and direct complete nucleotide determination of entire genes. Characterization of a gene coding for 16S ribosomal RNA. Nucleic Acids Res. 1989;17:7843–7851. doi: 10.1093/nar/17.19.7843. [DOI] [PMC free article] [PubMed] [Google Scholar]
- 12.Farrelly V, Rainey F A, Stackebrandt E. Effect of genome size and rrn gene copy number on PCR amplification of 16S rRNA genes from a mixture of bacterial species. Appl Environ Microbiol. 1995;61:2798–2801. doi: 10.1128/aem.61.7.2798-2801.1995. [DOI] [PMC free article] [PubMed] [Google Scholar]
- 13.Feng D F, Doolittle R F. Progressive sequence alignment as a prerequisite to correct phylogenetic trees. J Mol Evol. 1987;25:351–360. doi: 10.1007/BF02603120. [DOI] [PubMed] [Google Scholar]
- 14.Ferris M J, Ward D M. Seasonal distributions of dominant 16S rRNA-defined populations in a hot spring microbial mat examined by denaturing gradient gel electrophoresis. Appl Environ Microbiol. 1997;63:1375–1381. doi: 10.1128/aem.63.4.1375-1381.1997. [DOI] [PMC free article] [PubMed] [Google Scholar]
- 15.Hansen M C, Tolkernielsen T, Givskov M, Molin S. Biased 16S rDNA PCR amplification caused by interference from DNA flanking the template region. FEMS Microbiol Ecol. 1998;26:141–149. [Google Scholar]
- 16.Konopka A, Zakharova T, LaPara T M. Bacterial function and community structure in reactors treating biopolymers and surfactants at mesophilic and thermophilic temperatures. J Ind Microbiol Biotechnol. 1999;23:127–132. doi: 10.1038/sj.jim.2900695. [DOI] [PubMed] [Google Scholar]
- 17.Kowalchuk G A, Stephen J R, De Boer W, Prosser J I, Embley T M, Woldendorp J W. Analysis of ammonia-oxidizing bacteria of the β subdivision of the class Proteobacteria in coastal sand dunes by denaturing gradient gel electrophoresis and sequencing of PCR-amplified 16S ribosomal DNA fragments. Appl Environ Microbiol. 1997;63:1489–1497. doi: 10.1128/aem.63.4.1489-1497.1997. [DOI] [PMC free article] [PubMed] [Google Scholar]
- 18.Lane D J. 16S/23S rRNA sequencing. In: Stackebrandt E, Goodfellow M, editors. Nucleic acid techniques in bacterial systematics. West Sussex, United Kingdom: John Wiley & Sons, Ltd.; 1991. pp. 115–175. [Google Scholar]
- 19.LaPara T M, Konopka A, Nakatsu C H, Alleman J E. Effects of elevated temperature on bacterial community structure and function in bioreactors treating a synthetic wastewater. J Ind Microbiol Biotechnol. 2000;24:140–145. [Google Scholar]
- 20.LaPara T M, Pantea L M, Alleman J E. Industrial Wastes Technical Conference 1998. Alexandria, Va: Water Environment Federation; 1998. Analysis of a full-scale thermophilic aerobic biological treatment facility; pp. 451–458. [Google Scholar]
- 21.Maidak B L, Cole J R, Parker C T, Jr, Garrity G M, Larsen N, Li B, Lilburn T G, McCaughey M J, Olsen G J, Overbeek R, Pramanik S, Schmidt T M, Tiedje J M, Woese C R. A new version of the RDP (Ribosomal Database Project) Nucleic Acids Res. 1999;27:171–173. doi: 10.1093/nar/27.1.171. [DOI] [PMC free article] [PubMed] [Google Scholar]
- 22.Manz W, Wagner M, Amann R, Schleifer K-H. In situ characterization of the microbial consortia active in two wastewater treatment plants. Water Res. 1994;28:1715–1723. [Google Scholar]
- 23.Muyzer G, De Waal E C, Uitterlinden A G. Profiling of complex microbial populations by denaturing gradient gel electrophoresis analysis of polymerase chain reaction-amplified genes coding for 16S rRNA. Appl Environ Microbiol. 1993;59:695–700. doi: 10.1128/aem.59.3.695-700.1993. [DOI] [PMC free article] [PubMed] [Google Scholar]
- 24.Nübel U, Engelen B, Felske A, Snaidr J, Wieshuber A, Amann R I, Ludwig W, Backhaus H. Sequence heterogeneities of genes encoding 16S rRNAs in Paenibacillus polymyxa detected by temperature gradient gel electrophoresis. J Bacteriol. 1996;178:5636–5643. doi: 10.1128/jb.178.19.5636-5643.1996. [DOI] [PMC free article] [PubMed] [Google Scholar]
- 25.Olsen G J, Lane D J, Giovannoni S J, Pace N R, Stahl D A. Microbial ecology and evolution: a ribosomal RNA approach. Annu Rev Microbiol. 1986;40:337–365. doi: 10.1146/annurev.mi.40.100186.002005. [DOI] [PubMed] [Google Scholar]
- 26.Rainey F A, Ward N, Sly L I, Stackebrandt E. Dependence on the taxon composition of clone libraries for PCR amplified, naturally occurring 16S rDNA, on the primer pair and the cloning system. Experientia. 1994;50:796–797. [Google Scholar]
- 27.Reysenbach A-L, Giver L J, Wickham G S, Pace N R. Differential amplification of rRNA genes by polymerase chain reaction. Appl Environ Microbiol. 1992;58:3417–3418. doi: 10.1128/aem.58.10.3417-3418.1992. [DOI] [PMC free article] [PubMed] [Google Scholar]
- 28.Rochelle P A, Cragg B A, Fry J C, Parkes R J, Weightman A J. Effect of sample handling on estimation of bacterial diversity in marine sediments by 16S rRNA gene sequence analysis. FEMS Microbiol Ecol. 1994;15:215–226. [Google Scholar]
- 29.Rozich A F, Colvin R J. Design and operational considerations for thermophilic aerobic reactors treating high strength wastes and sludges. In: Alleman J E, editor. Proceedings of the 52nd Purdue Industrial Waste Conference. Ann Arbor, Mich: Ann Arbor Press; 1997. pp. 1–6. [Google Scholar]
- 30.Saitou N, Nei M. The neighbor-joining method: a new method for reconstructing phylogenetic trees. Mol Biol Evol. 1987;4:406–425. doi: 10.1093/oxfordjournals.molbev.a040454. [DOI] [PubMed] [Google Scholar]
- 31.Sambrook J, Fritsch E F, Maniatis T. Molecular cloning: a laboratory manual. 2nd ed. Cold Spring Harbor, N.Y: Cold Spring Harbor Laboratory; 1989. [Google Scholar]
- 32.Sekiguchi Y, Kamagata Y, Syutsubo K, Ohashi A, Harada H, Nakamura K. Phylogenetic diversity of mesophilic and thermophilic granular sludges determined by 16S rRNA gene analysis. Microbiology. 1998;144:2655–2665. doi: 10.1099/00221287-144-9-2655. [DOI] [PubMed] [Google Scholar]
- 33.Snaidr J, Amann R, Huber I, Ludwig W, Schleifer K-H. Phylogenetic analysis and in situ identification of bacteria in activated sludge. Appl Environ Microbiol. 1997;63:2884–2896. doi: 10.1128/aem.63.7.2884-2896.1997. [DOI] [PMC free article] [PubMed] [Google Scholar]
- 34.Stover E L. Industrial Wastes Technical Conference 1999. Water Environment Federation, Alexandria, Va. (CD-ROM.) 1999. Aerobic autoheated thermophilic treatment process for high strength industrial waste residuals. [Google Scholar]
- 35.Suzuki M T, Giovannoni S J. Bias caused by template annealing in the amplification of mixtures of 16S rRNA genes by PCR. Appl Environ Microbiol. 1996;62:625–630. doi: 10.1128/aem.62.2.625-630.1996. [DOI] [PMC free article] [PubMed] [Google Scholar]
- 36.Teske A, Wawer C, Muyzer G, Ramsing N B. Distribution of sulfate-reducing bacteria in a stratified fjord (Mariager Fjord, Denmark) as evaluated by most probable-number counts and denaturing gradient gel electrophoresis of PCR-amplified ribosomal DNA fragments. Appl Environ Microbiol. 1996;62:1405–1415. doi: 10.1128/aem.62.4.1405-1415.1996. [DOI] [PMC free article] [PubMed] [Google Scholar]
- 37.Thompson J D, Higgins D G, Gibson T J. CLUSTAL W: improving the sensitivity of progressive multiple sequence alignment through sequence weighting, position-specific gap penalties and weight matrix choice. Nucleic Acids Res. 1994;22:4673–4680. doi: 10.1093/nar/22.22.4673. [DOI] [PMC free article] [PubMed] [Google Scholar]
- 38.Vallaeys T, Topp E, Muyzer G, Macheret V, Laguerre G, Soulas G. Evaluation of denaturing gradient gel electrophoresis in the detection of 16S rDNA sequence variation in rhizobia and methanotrophs. FEMS Microbiol Ecol. 1997;24:279–285. [Google Scholar]
- 39.von Witzengerode F, Göbel U B, Stackebrandt E. Determination of microbial diversity in environmental samples: pitfalls of PCR-based rRNA analysis. FEMS Microbiol Rev. 1997;21:213–229. doi: 10.1111/j.1574-6976.1997.tb00351.x. [DOI] [PubMed] [Google Scholar]