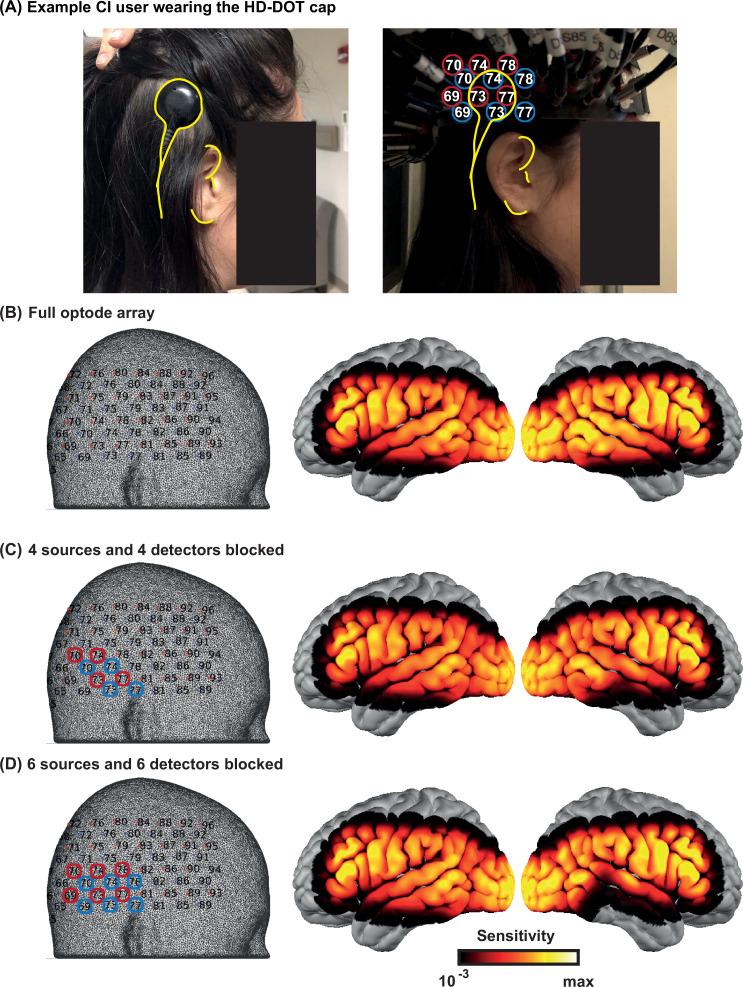
Appendix 2—figure 1. Effects of the cochlear implant (CI) transducer on high-density diffuse optical tomography (HD-DOT) sensitivity.
(A) A right ear CI user wearing the HD-DOT cap. The yellow contours around the CI transducer with respect to the ear fiducials illustrate the source numbers (encircled in red) and detector numbers (encircled in blue) around the transducer. (B) The left panel shows the HD-DOT source-detector grid, overlaid on the mesh used in the study for image reconstruction. The right panel shows the sensitivity of the HD-DOT cap around the cortex including all optodes. (C) The left panel shows four sources (in red) and four detectors (in blue) excluded from the sensitivity calculation. The right panel shows the sensitivity of the HD-DOT cap excluding those sources and detectors. (D) The left panel shows six sources (in red) and six detectors (in blue) excluded from the sensitivity calculation. The right panel shows the sensitivity of the HD-DOT cap excluding those sources and detectors. Note that the exclusion of sources and detectors in (C) and (D) only resulted in sensitivity drop off in the inferior and middle temporal gyri.

