

ABSTRACT
Upregulation of inhibitory receptors, such as lymphocyte activation gene-3 (LAG-3), may limit the antitumor activity of therapeutic antibodies targeting the programmed cell death protein-1 (PD-1) pathway. We describe the binding properties of ezabenlimab, an anti-human PD-1 antibody, and BI 754111, an anti-human LAG-3 antibody, and assess their activity alone and in combination. Ezabenlimab bound with high affinity to human PD-1 (KD = 6 nM) and blocked the interaction of PD-1 with PD-L1 and PD-L2. Ezabenlimab dose-dependently increased interferon-γ secretion in human T cells expressing PD-1 in co-culture with PD-L1-expressing dendritic cells. Administration of ezabenlimab to human PD-1 knock-in mice dose-dependently inhibited growth of MC38 tumors. To reduce immunogenicity, ezabenlimab was reformatted from a human IgG4 to a chimeric variant with a mouse IgG1 backbone (BI 905725) for further in vivo studies. Combining BI 905725 with anti-mouse LAG-3 antibodies improved antitumor activity versus BI 905725 monotherapy in the MC38 tumor model. We generated BI 754111, which bound with high affinity to human LAG-3 and prevented LAG-3 interaction with its ligand, major histocompatibility complex class II. In an in vitro model of antigen-experienced memory T cells expressing PD-1 and LAG-3, interferon-γ secretion increased by an average 1.8-fold versus isotype control (p = 0.027) with BI 754111 monotherapy, 6.9-fold (p < 0.0001) with ezabenlimab monotherapy and 13.2-fold (p < 0.0001) with BI 754111 plus ezabenlimab. Overall, ezabenlimab and BI 754111 bound to their respective targets with high affinity and prevented ligand binding. Combining ezabenlimab with BI 754111 enhanced in vitro activity versus monotherapy, supporting clinical investigation of this combination (NCT03156114; NCT03433898).
KEYWORDS: PD-1, LAG-3, ezabenlimab, BI 754091, BI 754111
Introduction
Programmed cell death protein-1 (PD-1) and its ligands, PD-L1 and PD-L2, are key factors in controlling immune responses.1,2 Engagement of PD-1 by its ligands negatively regulates the T-cell immune response, preventing damage to healthy tissue. However, tumors can leverage the PD-1 signaling pathway to evade immune-mediated destruction.3 Tumor-infiltrating lymphocytes from patients with cancer often express high levels of PD-1, while tumor cells and other cells in the tumor tissue can upregulate PD-L1 expression.4 Blocking the interaction between PD-1 and its ligands activates T-cell function and promotes tumor cell death.3,5–8 Antibodies targeting PD-1 or PD-L1 have revolutionized the treatment of a variety of cancer types; however, not all patients respond to these therapies.9 Therefore, current research is focused on identifying patient selection biomarkers and understanding resistance mechanisms. Alterations within the interferon-γ (IFN-γ) signaling pathway and the antigen presentation machinery of tumor cells, as well as upregulation of other inhibitory co-receptors, such as lymphocyte activation gene-3 (LAG-3), have been identified as potential escape mechanisms.10–13
Chronic antigen exposure leads to a progressive inactivation of T cells through a process termed “exhaustion”. Exhausted T cells often co-express negative regulatory receptors such as PD-1 and LAG-3. Data from patients and syngeneic tumor mouse models have shown that tumor-derived T cells frequently co-express LAG-3 and PD-1.14,15 LAG-3 is a type I transmembrane protein, mainly expressed on the cell surface of activated T cells and on subsets of natural killer and dendritic cells (DCs).16 LAG-3 is closely related to CD4, a co-receptor for T-helper cell activation. Both molecules have four extracellular immunoglobulin (Ig)-like domains and require binding to their shared ligand, major histocompatibility complex class II (MHC-II), for their functional activity. Upon binding to MHC-II, LAG-3 induces an intracellular signal, which negatively regulates T-cell responses.16 Combined PD-1 and LAG-3 blockade using antagonistic monoclonal antibodies increased re-activation of T cells in vitro and improved tumor growth inhibition (TGI) in mouse models versus PD-1 inhibition alone.15,17
Here, we characterized the properties and activities of two humanized antibodies: ezabenlimab, antagonizing human PD-1 (hPD-1), and BI 754111, antagonizing human LAG-3 (hLAG-3). Ezabenlimab blocked the interaction of PD-1 with PD-L1 and PD-L2, resulting in increased T-cell activation in vitro. Ezabenlimab administration led to a dose-dependent eradication of subcutaneous MC38 tumors in hPD-1 knock-in mice. Combination of an ezabenlimab variant (on a mouse backbone to reduce the potential generation of anti-drug antibodies) with a tool anti-mouse LAG-3 antibody showed enhanced antitumor activity in this model. BI 754111 blocked the interaction with human MHC-II, leading to increased cytokine secretion in vitro, which was further increased in combination with ezabenlimab. The enhanced activity observed when combining these antibodies suggests that combined PD-1/LAG-3 inhibition may improve responses versus PD-1 inhibition alone in the clinic.
Materials and methods
Key resources
Anti-PD-1 and anti-LAG-3 antibodies used are summarized in Supplementary Table 1. Fluorochrome-labeled primary antibodies for flow cytometry were purchased from Biolegend and BD Biosciences; secondary antibodies from Jackson ImmunoResearch, Sigma, Dianova and Acris. Chinese Hamster Ovary (CHO) cell lines expressing human or mouse PD-1, or human, mouse or cynomolgus LAG-3 were generated at Boehringer Ingelheim. 3A9 cell lines expressing mouse LAG-3 (mLAG-3)18 or hLAG-3 were received from St. Jude Children’s Research Hospital. Cell culture was performed at 37°C with 95% relative humidity and 5% CO2. Flow cytometry acquisition was performed on Becton Dickinson flow cytometers (LSR-II, Canto-I, Canto-II) with FACS DIVA 8 software and analyzed with FACS DIVA 8 or FlowJo (Becton Dickinson). EC50,90 and IC90 values were calculated based on flow cytometry median fluorescent intensity (MFI), except where noted differently, using a four-parameter variable slope curve fitting (GraphPad Prism 6.01, GraphPad Software Inc).
Generation of ezabenlimab and BI 754111
Mice were immunized with the extracellular domain of hPD-1 or hLAG-3 protein. Serum was harvested and screened to identify animals with sufficient titers of anti-PD-1 or anti-LAG-3 immunoglobulin. Splenocytes from the selected mice were harvested and fused with mouse myeloma cells to generate hybridomas. Selected hybridomas for each of the targets were isolated and cloned; from these, we identified two murine hybridoma cell lines: 1) 77E11, which produced mouse monoclonal antibodies exhibiting low nM binding affinities to hPD-1 and blocked the binding of PD-L1 to PD-1; 2) 496G6, which produced mouse monoclonal antibodies exhibiting low nM binding affinities to hLAG-3 and blocked the binding of MHC-II to LAG-3.
For humanization, the murine complementary determining regions (CDRs) were grafted onto the closest matching human germline genes. Fab libraries with specific mutations were prepared to assess framework residues and to remove potential CDR sequence liabilities. The humanized and optimized Fabs were tested for their ability to retain the binding profile of the parental murine antibody to hPD-1 or hLAG-3, and block the interaction of PD-L1/PD-1 or MHC-II/LAG-3, respectively. Selected humanized variable regions were then formatted with a human IgG4 (Ser228Pro; to avoid Fab arm exchange) constant region.19 Ezabenlimab and BI 754111 were the products of this process. BI 905725 is a variant of ezabenlimab, but formatted with a mouse IgG1 isotype constant region with a D265A alteration to reduce Fc-effector function.20
Surface plasmon resonance (SPR) binding studies
SPR was performed using a ProteOnTM XPR36 (BioRad). After activating the GLM sensor chip (Biorad) with a 1:1 mixture EDC/s-NHS (Biorad), Protein A/G (ThermoFisher) was immobilized (60 μg/mL in 10 mM sodium acetate pH 4.5) and the surface was deactivated with 1 M ethanolamine. Antibodies were coupled over the surface to result in ~1500 RU capture for ezabenlimab and ~280 RU capture for BI 754111. Two-fold dilutions of each analyte were prepared in PBS-T-EDTA (Biorad): hPD-1 (6.25–100 nM) and hLAG-3 (0.625–10 nM). Analytes were flowed over the captured antibodies at a flowrate of 30 μL/min for 600 sec association/1200 sec dissociation for PD-1 and 300 sec association/1800 sec dissociation for LAG-3. The sensorgrams were corrected for analyte interactions with the sensor surface (interspot) and buffer (0 nM analyte). Affinity values were determined by 1:1 Langmuir using the ProteOn ManagerTM software.
KD value determination via flow cytometry and Scatchard analysis
hPD-1-expressing CHO cells were plated in a 96-well round-bottom plate. Primary antibodies (ezabenlimab, BI 905725 or respective isotype controls) were added in multiple concentrations, and the plate was incubated for 1 h at 4°C. Corresponding secondary FITC-labeled antibody was added in fivefold excess (compared with the highest primary antibody concentration) without wash, and the plate was incubated for 30 min at 4°C. Cells were washed and analyzed by flow cytometry. For analysis, moles of FITC molecules per well were calculated based on detected FITC molecules per cell. The moles of bound antibody per well [B] were calculated by dividing the resulting value by the fluorescence-to-protein ratio (F/P ratio) of the secondary antibody. Moles of free antibody per well [F] were calculated by subtracting [B] from the initial concentration of antibody that was added into the well. In the titration curve, the MFI of the different wells were plotted against the logarithms of the respective initial antibody concentrations. Three or more points in the linear range of the sigmoidal titration curve were chosen. Of these, [B] (x-axis) versus [B/F] values (y-axis) were plotted as a Scatchard plot. The slope of a fitted line in the Scatchard plot and its intercept with the y-axis were calculated with integrated formulas in Microsoft Excel. KD was calculated with the following formula: −1/slope = KD (moles/L).
Flow cytometry binding assays
CHO binding assays
Binding properties of ezabenlimab and BI 754111 were determined using CHO cells expressing human or mouse PD-1, or human, cynomolgus or mouse LAG-3, respectively. CHO cells were washed in buffer (PBS + 0.5% BSA + 0.02% NaN3), re-suspended in buffer and 2 × 10⁵ (for ezabenlimab) or 1.5 × 10⁵ (for BI 754111) cells per well were plated into a 96-well round bottom plate. After centrifugation, cell pellets were re-suspended in serially diluted ezabenlimab or BI 754111 and incubated on ice for 30 or 45 min, respectively. Cells were washed with buffer and incubated with 2.5 µg/mL of secondary antibody for 20 or 30 min, respectively, on ice, protected from light. After washing, cells were re-suspended in buffer and analyzed by flow cytometry.
Binding to activated immune cells
To determine binding of ezabenlimab and BI 754111 to activated immune cells, cryopreserved human or cynomolgus monkey peripheral blood mononuclear cells (PBMCs), and cryopreserved or freshly harvested rat spleen cells were used. To activate PBMCs for PD-1 expression, human or cynomolgus PBMCs were stimulated with plate-coated anti-human CD3 (eBioscience) or anti-monkey CD3 (Cell Sciences) antibodies, respectively, and 1 µg/mL soluble anti-human CD28 (eBioscience). Cells were cultured for at least 24 hours. To activate human or cynomolgus PBMCs, and rat spleen cells for LAG-3 expression, 1.5–2 mL of 5 × 10⁶ cells/mL were cultured in 24-well plates in T cell medium (RPMI 1640, 10% heat inactivated FBS [Hyclone] and 1x Penicillin/Streptomycin) with 10 ng/mL interleukin-2 (IL-2) and 1 µg/mL PHA-M for 3 d.
For ezabenlimab, stimulated PBMCs were collected, washed, and 1.8 × 10⁵ cells/well were placed in a 96-well polypropylene V-bottom plate, to which 1:5 serially diluted ezabenlimab was added (starting concentration of 200 nM). Following 15 min incubation at RT, additional cell surface marker antibodies for population identification were added. Following 15 min incubation at RT, wells were washed in buffer, secondary antibody (diluted 1:100) against ezabenlimab was added, and plates were incubated for 30 min on ice protected from light. Cells were washed in buffer and fixed for 10 min with 1% formaldehyde in DPBS at RT protected from light. Binding of tested antibodies to CD4 and CD8 T cells was recorded as MFI.
For BI 754111, stimulated cells (PBMCs or rat splenocytes) were collected, washed, and incubated in T cell blocking buffer (PBS pH7.4 + 0.5% BSA [Invitrogen] + 0.01% NaN3 + 1% goat serum [DAKO]) at 1 × 10⁶ cells/mL for 15 min on ice. Cells were plated in a 96-well plate, serially diluted BI 754111 was added (starting concentration of 333 or 133 nM), and the plate was incubated on ice for 30 min. After washing, antibodies against cell surface markers and 2.5 µg/mL secondary antibody against BI 754111 were added. Cells were incubated for 15 min at 4°C protected from light, washed and analyzed by flow cytometry. Binding of LAG-3 monoclonal antibodies was analyzed as percent LAG-3-positive cells for CD25-positive CD4 and CD8 T cells.
Characterizing anti-mLAG-3 tool antibodies C9B7W and EX 80658
mLAG-3-expressing 3A9 cells (mouse CD4-positive T cell line) were washed in buffer. 1.5 × 10⁵ cells/well were plated in a 96-well plate, and cells were resuspended in a serial dilution of antibodies. After incubation, cells were washed and respective secondary antibodies added at 2.5 µg/mL. Following incubation, cells were washed and analyzed by flow cytometry.
Determination of ligand blocking properties
Ezabenlimab and the interaction between hPD-1 and its ligands
CHO cells expressing human or cynomolgus PD-1 were incubated for 1 h at 6 × 10⁴ cells/well with serially diluted ezabenlimab or controls, and 0.22 µg/mL biotin-labeled hPD-L1-Fc chimera or 0.33 µg/mL biotin-labeled hPD-L2-Fc chimera (R&D Systems, biotinylated at Boehringer Ingelheim). Cells were washed and DELFIA Eu-labeled streptavidin was added for a 1-h incubation period. Cells were washed and DELFIA Enhancement solution was added prior to 30 min incubation. Fluorescence was measured using Wallac VICTOR Multilabel Counter (Perkin Elmer, 1420). Data were normalized to percent inhibition where 0% inhibition equaled the fluorescence value of cells incubated with the ligand without antibodies, and 100% inhibition equaled the signal obtained with cells without labeled ligands or antibodies. Results were excluded if the 95% confidence interval factor (upper/lower) was >5.
BI 754111 and the interaction between hLAG-3 and MHC-II
Recombinant hLAG-3 protein (recombinant LAG-3 Fc chimera; R&D Systems) was plated at 4 µg/mL with serially diluted BI 754111 or controls and incubated for 15 min at RT. Raji cells (human B cell lymphoblast cell line isolated from Burkitt’s lymphoma expressing MHC-I [HLA-I] and MHC-II [HLA-DR, -DQ and -DP])21 were added, incubated for 30 min at 4°C, washed, and incubated with 2.5 µg/mL secondary antibody to detect bound recombinant LAG-3 Fc chimera. After 30–60 min at 4°C, cells were washed and analyzed by flow cytometry. Data were normalized to percent inhibition as described above.
Blocking the interaction between mLAG-3 and murine MHC-II (anti-mLAG-3 tool antibody)
3A9-mLAG-3 cells were incubated at 1.5 × 10⁵ cells/well with anti-mLAG3 antibody C9B7W (eBioscience) or controls, and PE-labeled OVA323-339 MHC-II-IAb tetramers (MBL International, USA). After 60 min at 4°C, cells were washed and analyzed by flow cytometry.
In vitro functional assays
Jurkat T-cell activation assay (for ezabenlimab)
Dynabeads (Invitrogen) were coated with 0.8 µg/mL mouse anti-hCD3 (clone UCHT1, BD Biosciences), 10 µg/mL mouse anti-hCD28 (clone 28.2, BD Biosciences), and 10 µg/mL hPD-L1 mIgG1 Fc chimera (generated at Boehringer Ingelheim) or mIgG1 (Sigma), and stored at 4°C. Jurkat cells expressing hPD-1 and containing an NFAT-activation reporter gene (luciferase; generated by Boehringer Ingelheim) were incubated at 1.5 × 10⁵ cells/well with serially diluted ezabenlimab or control at a final volume of 90 µL in 96-well plates. After 10 min incubation at 37°C, 10 µL Dynabeads/well were added, cells were mixed and cultured for 6 hours at 37°C. 100 µL of Steady-Glo® Luciferase Reagent was added to the wells per manufacturer’s instructions and measured on a Victor X4 luminometer (Perkin Elmer). For EC90 calculations, 0% activation was defined as the luminescence value of cells incubated with the CD3/CD28/PD-L1 beads and no antibody. One hundred percent activation was defined as the signal obtained with cells incubated with CD3/CD28/mIgG1 control beads and no antibody. Antibody activity was calculated for the antibody concentration of 166 nM in the presence of CD3/CD28/PD-L1 beads, with 100% defined as the signal obtained with CD3/CD28/mIgG1 beads.
3A9 T-cell activation assay (for BI 754111)
LK35.2 cells (mouse B/T cell hybridoma cell line expressing IAk) were pulsed with hen egg lysozyme (HEL)48–62 peptide at 75 nM for 30 min at 37°C. In parallel, 3A9-hLAG-3 cells, a mouse CD4-positive T cell line that specifically recognizes that HEL-peptide presented on IAk and expresses hLAG-3, were pre-incubated with serially diluted BI 754111 or controls for 15 min at 37°C. A co-culture in a ratio of 2:1 (3A9-hLAG-3: LK35.2) was then set up. Following 24 hours of culture, cell-free supernatant was harvested and mouse IL-2 concentrations were measured with a commercial ELISA per manufacturer’s instructions. For EC50 calculations, 0% stimulation was defined as the IL-2 level of cells incubated with assay medium alone, whereas 100% stimulation was defined as the IL-2 level of cells incubated with the highest concentration of the reference tool LAG-3 antibody.
Primary T cell recall assay (ezabenlimab and BI 754111; Supplementary Fig. S1)
For expansion of tetanus-toxoid-specific T cells, PBMCs from healthy donors, who had recently been vaccinated against tetanus, were cultured with Tetguard™ (Boehringer Ingelheim) at 1:1200 in T cell medium. On d 6, cells were centrifuged and resuspended in T cell media plus 5 ng/mL IL-2 and 5 ng/mL IL-7 to a concentration of 2 × 10⁶ cell/mL, which was maintained during culture until d 14. Cells were then re-stimulated by co-culture with tetanus toxoid-loaded monocyte-derived DCs (see below) at a ratio of 1:20 in T-cell media with human IL-2 and IL-7 (R&D Systems).
Preparation of monocyte-derived DCs was conducted in parallel from d 8 to 16: on d 8, monocytes were isolated from autologous PBMCs using the EasySep human monocyte enrichment kit according to manufacturer’s instructions (STEMCELL technologies) and cultured at 2 × 10⁶ cells/mL in DC culture medium (RPMI with 10% FBS, 1 x Pen/Strep, 1 x Na-Pyruvate, 10 mM HEPES, 1 x NEAA and 55 µM β-ME, 50 ng/mL GM-CSF, 50 ng/mL IL-4) in 6-well plates. On d 13, approximately half of the DCs per donor were cultured with 50 µg/mL tetanus toxoid (Reagent Protein) in DC maturation medium (DC culture medium with 50 ng/mL IL-4, 50 ng/mL GM-CSF, 20 ng/mL TNF-α, 20 ng/mL IL-1β, 100 ng/mL IL-6 [all R&D Systems] and 1 µg/mL PGE2 [Sigma-Aldrich]) for 1 d, and then used for the d 14 re-stimulation of the T cells. To generate stimulators for the antibody test, the remaining DCs were matured and loaded with tetanus toxoid on d 15 (as on d 13). This protocol for the generation of antigen-reactive T cells and antigen-presenting DC reproducibly leads to the expression of the relevant receptors PD-1 and LAG-3 on T cells, as well as their ligands PD-L1, PD-L2 and HLA-DR on the DC, as confirmed by flow-cytometry during assay development and recurrent checks.
Finally, on d 16, re-stimulated T cells (5 x 10⁴ cells/well) were co-cultured with tetanus toxoid-loaded mature DCs (2.5 x 10³ cells/well) in the presence of test antibodies. Supernatants were harvested after 4 d of co-culture and IFN-γ was determined with a commercial ELISA (Meso Scale Discovery) according to manufacturer’s instructions. EC50 was calculated with GraphPad Prism; efficacy (fold increase of IFN-γ secretion over isotype control at either 100 nM or 200 nM) was calculated with Microsoft Excel.
In vivo efficacy studies
All animal studies were approved by the internal ethics and local government committees (GZ: 902734/2017/22). Female C57BL/6NTac-PDCD1tm(PDCD1)Arte (hPD-1 knock-in) mice were functionally characterized by Oxford University INNOVATION, Oxford, UK, bred at Taconic, Denmark and obtained under a license. hPD-1 knock-in mice are fully immune competent and harbor a modified PD-1 with human sequences replacing murine counterparts in the extracellular domain. This enabled testing of ezabenlimab and its variant, BI 905725. As BI 754111 does not bind mLAG-3, it was substituted by the anti-mouse LAG-3 antibody clone C9B7W (rat IgG1; BioXCell) or its variant on mouse IgG1 D265A isotype backbone (EX 80658, generated at Boehringer Ingelheim). MC38 cells (obtained under a license from NCI, Bethesda) in PBS and 5% FCS were mixed 1:1 with Matrigel® matrix (without growth factors, Corning) at 1 × 10⁶ cells/mL. A 100 µL tumor cell suspension was subcutaneously injected at the right flank of the mice and tumors reached a median size of 50–90 mm3 by the start of treatment on d 6. On d 6 post tumor cell injection, test compounds were administrated intraperitoneally, and antibodies were diluted in 1x PBS to receive different doses for administration. Antibodies were injected in different schedules as single dose, twice a week (q3or4d) or every 3 weeks (q21d). Tumor diameters were measured with a caliper three times per week. Tumor volumes (in mm3) were calculated according to the formula “tumor volume = length * diameter2 * π/6.” Animals were euthanized when the tumors reached 1,500 mm3. Mice were inspected daily for abnormalities, and body weight was measured three times per week. Animals with a body weight loss >18% were euthanized for ethical reasons. Tumor growth inhibition (TGI) was calculated as follows: TGI = 100 x {1-[(treated final day – treated day1)/(control final day – control day1)]} at the last time point where 70% of animals of a group were alive. Response (R) was defined as the relative tumor size being ≤1 compared to the measurement at the start of treatment at a given measurement time point (end of study).
Statistical analysis of in vivo data
TGI was analyzed using a one-tailed nonparametric Mann-Whitney-Wilcoxon U-test, based on the hypothesis that an effect would only be measurable in one direction (i.e. expectation of tumor inhibition but not enhanced growth). P values were adjusted using the Bonferroni-Holm correction. P values ≤ 0.05 were considered significant.
Data availability
All data relevant to the study are included in the article or as Supplementary Information. Any further information regarding resources and reagents may be directly requested to the corresponding author and will be available upon reasonable request.
Results
Characterization and binding properties of ezabenlimab and inhibition of ligand binding
The affinity of ezabenlimab (KD) to hPD-1 was determined as 6 nM by SPR, and cross-reactivity to cynomolgus PD-1 was seen (KD 32 nM). Dose-dependent binding of ezabenlimab to hPD-1 was confirmed using CHO cells stably expressing hPD-1. Ezabenlimab was not cross-reactive to mouse PD-1 expressed on CHO cells (Supplementary Table 2). Ezabenlimab bound with almost identical EC50 values to hPD-1 expressed on activated CD3-positive/CD4-positive or CD3-positive/CD8-positive T cells. Although SPR values were slightly lower for binding to cynomolgus versus human PD-1, binding data on activated cynomolgus T cells were similar to that for human T cells. Ezabenlimab was not cross-reactive to rat PD-1 (Supplementary Table 2).
Ezabenlimab blocked the interaction of hPD-1 (expressed on CHO cells) with its ligands, hPD-L1-Fc and hPD-L2-Fc, with IC90 values of 4.14 ± 1.2 nM and 3.98 ± 0.5 nM, respectively. Blocking properties were similar for the interaction with cynomolgus PD-1 expressed on CHO cells, with IC90 values of 5.61 ± 1.4 nM for hPD-L1-Fc and 7.54 ± 1.7 nM for hPD-L2-Fc (Supplementary Table 2).
In vitro functional activity of ezabenlimab
Ezabenlimab blocked the inhibitory interaction between PD-1 and PD-L1, resulting in a dose-dependent increase in luciferase activity in the reporter gene Jurkat T-cell activation assay (EC90 of 3.71 nM; Figure 1). Analysis of the activity of ezabenlimab using primary human antigen-experienced CD3-positive T cells showed a dose-dependent increase in IFN-γ secretion (average 7.9-fold versus isotype; Supplementary Fig. S1), with an average EC50 of 0.9 nM.
Figure 1.

Blockade of inhibitory PD-1/PD-L1 signaling by ezabenlimab leads to T-cell activation. Beads coated with PD-L1 protein and agonistic CD3 and CD28 antibodies were used to stimulate and simultaneously block activation of Jurkat cells expressing human PD-1. Dose titration with ezabenlimab blocked the inhibitory interaction leading to NFAT-mediated luciferase activity. Left panel (a) shows graphical description of the assay. Right panel (b) shows the assay results from one study (EC90 was calculated from three studies). Luciferase activity was calculated: 0% activation represents the luminescence value of cells incubated in the presence of anti-CD3/anti-CD28/PD-L1 beads without antibodies, and 100% activation represents the signal obtained with maximum luciferase levels in the presence of anti-CD3/anti-CD28/mouse IgG1 loaded control beads without antibodies present. In red, ezabenlimab mediated a dose-dependent increase in luciferase activity. In gray, titration of control IgG4 antibody did not affect luciferase activity.
In vivo activity of ezabenlimab
In a hPD-1 knock-in mouse model, ezabenlimab treatment led to tumor growth delay at dose levels of 0.3 and 1 mg/kg and tumor regressions at dose levels ≥3 mg/kg versus isotype control (Figure 2).
Figure 2.
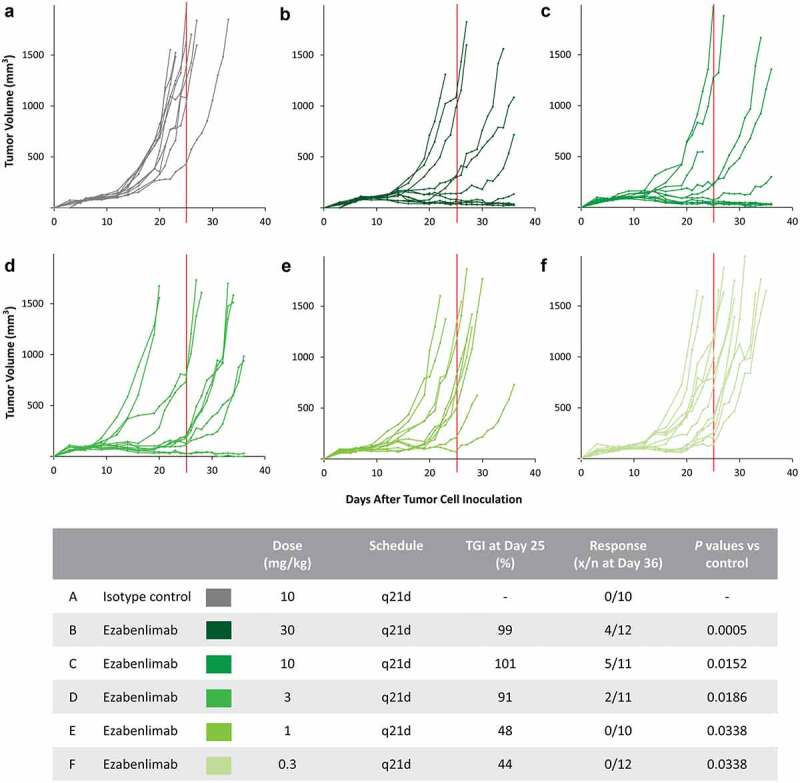
Ezabenlimab treatment leads to tumor regression in the MC38 mouse tumor model. MC38 colon adenocarcinoma were subcutaneously grown in hPD-1 knock-in mice. Isotype control (a) or ezabenlimab (b–f) were administered by intraperitoneal injection once every 3 weeks (starting on d 6 after tumor cell injection). Tumor diameters were measured three times per week. TGI was calculated on d 25 (as indicated by the vertical red line) and the responding tumors were counted on d 36. Response was defined by a tumor size that was the same or smaller than the measurement at the start of treatment. Graphs show individual tumor volumes over time per treatment group and the table provides a summary of TGI and response for each dosage schedule.TGI, tumor growth inhibition; q21d, every 21 days.
Findings from a second in vivo analysis comparing single-dose and twice-weekly administration of 10 mg/kg ezabenlimab showed comparable anti-tumor activity and suggested that a single treatment in this model had similar antitumor activity to twice-weekly dosing (Supplementary Fig. S2).
As ezabenlimab is formatted as a human IgG4 backbone, potential anti-drug-antibodies could potentially have confounded the observed effects. Thus, for further in vivo studies, we produced a variant of ezabenlimab with a mouse IgG1-D265A backbone: BI 905725. Binding affinities of BI 905725 versus ezabenlimab on CHO cells expressing hPD-1 were determined; median KD values were 204.7 nM for BI 905725 and 38.6 nM for ezabenlimab (Supplementary Table 3). We considered these affinities to be sufficiently similar for a subsequent in vivo study.
In a subsequent in vivo comparison, ezabenlimab treatment resulted in TGI of 101% on d 22 versus human isotype control (p = 0.0002), and two of ten tumors responded (Supplementary Fig. S3). This was comparable with the previous study (Figure 2). BI 905725 treatment resulted in TGI of 98% versus mouse isotype control (p = 0.0037), and four of ten tumors responded. Overall, the antitumor activity of ezabenlimab and BI 905725 was similar, with both treatments resulting in tumor growth delays and a similar fraction of responding tumors.
Characterization of mLAG-3 tool antibodies
To test the combination of BI 905725 and anti-LAG-3 antibodies, we first characterized anti-mouse LAG-3 antibodies. We confirmed that C9B7W (commercially available rat IgG1 anti-mouse LAG-3 antibody) binds to mLAG-3 expressed on 3A9 cells (Figure 3(a)). To assess if C9B7W blocked the interaction of mLAG-3 with murine MHC-II, we used an OVA323-339-MHC-II-IAb tetramer to focus on binding of MHC-II to mLAG-3 without additional antigen-specific binding by the T cell receptor (as the T cell receptor of 3A9 cells does not recognize OVA323-339 on IAb, but HEL48-61 on IAk). OVA323-339-MHC-II-IAb tetramer readily bound to 3A9 cells, but treatment with C9B7W abolished that binding (Figure 3(b)).
Figure 3.

Murine LAG-3 (mLAG-3) tool antibodies potently block the interaction of mLAG-3 and murine MHC-II. (a) 3A9 mouse T cell line expressing mLAG-3 (3A9-mLAG-3) was incubated with 20 µg/mL isotype control or 20 µg/mL C9B7W rat IgG1 anti-mLAG-3 antibody. Bound antibodies were detected by PE-labeled secondary antibody and the signal was detected by flow cytometry. The graph illustrates that a specific signal was seen only when cells were incubated with C9B7W confirming that it binds to mLAG-3 in this particular test. (b) 3A9-mLAG-3 expressing cells were incubated with 20 µg/mL isotype control or 20 µg/mL C9B7W in the presence of PE-labeled OVA323-339 MHC-II-IAb tetramer for 60 min, washed and fluorescent signals were detected by flow cytometry. Bound tetramers were observed only in the isotype treated control (left graph); presence of C9B7W blocked the interaction of these mouse Class II tetramers to mLAG-3 (right graph). (c) C9B7W (rat IgG1) and EX 80658 (C9B7W variant on mouse IgG1 D265A backbone) were tested for their binding properties to mouse LAG-3 expressed on a 3A9 mouse T cell line. Bound primary antibody was detected using either anti-mouse or anti-rat fluorescently labeled secondary antibody. After washing, the remaining signal was detected by flow cytometry and EC50 values were calculated. Left graph shows dose-dependent binding of antibodies to mLAG-3 as indicated by increasing MFI. The table provides an overview of the calculated EC50 values including the 95% CI for the two antibodies. CI, confidence interval; MHC-II, major histocompatibility complex class II; MFI, median fluorescent intensity.
To reduce the possible negative impact on efficacy due to the formation of anti-drug antibodies, a mouse IgG1 variant of C9B7W was generated (EX 80658). The parental rat IgG1 C9B7W and EX 80658 bound to mLAG-3 with similar EC50 values (Figure 3(c)) and were used in the subsequent in vivo studies.
Combined in vivo activity of anti-PD-1 and anti-LAG-3 treatment
Neither C9B7W nor EX 80658 monotherapy had a strong antitumor effect compared with isotype-treated animals (MC38 tumor model using hPD-1 knock-in mice; p = 0.7394 and p = 0.7394). The tumors treated with either of these anti-mLAG-3 antibodies had similar growth properties (Figure 4).
Figure 4.

In vivo combination of BI 905725 with anti-mLAG-3 treatment is more efficacious than BI 905725 therapy only. MC38 colon adenocarcinoma were subcutaneously grown in hPD-1 knock-in mice. Starting on d 6, animals were treated by intraperitoneal injection with isotype control (a), C9B7W (rat IgG1 anti-mLAG-3) (b), EX 80658 (mouse IgG1 D265A anti-mLAG-3) (c), BI 905725 (mouse IgG1 D265A anti-hPD-1) (d) or the combination of BI 905725 with either C9B7W (e) or EX 80658 (f). All antibodies were administered at a dose of 10 mg/kg twice weekly. Tumor diameters were measured three times per week. Responding tumors were counted on d 47. Graphs show individual tumor volumes over time per treatment group and the table provides a summary of response per treated group. Response was defined by a tumor size that was the same or smaller than the measurement at the start of treatment. TGI values were determined on d 21 because control tumors are required for calculation; long-term efficacy results are best described in this study by response and the individual tumor growth curves. hPD-1, human programmed cell death protein-1; mLAG-3, mouse lymphocyte activation gene-3, q3or4d, every 3 or 4 d.
BI 905725 monotherapy led to a response in four of ten tumors and the six remaining tumors showed a delay in tumor growth compared to isotype-treated animals (TGI of 104; p = 0.0001). Addition of C9B7W to BI 905725 led to a response in four of ten tumors, but the remaining six tumors showed a further delay in tumor growth versus PD-1 monotherapy (TGI of 89; p = 0.0002). The number of responding tumors doubled (eight of ten) when BI 905725 was combined with EX 80658 (TGI of 106; p = .0001; Figure 4). Especially, the combination study with EX 80658 supports the hypothesis that combining anti-LAG-3 and anti-PD-1 treatment leads to enhanced in vivo antitumor activity versus anti-PD-1 monotherapy.
Characterization and binding properties of BI 754111 and inhibition of ligand binding
We developed an anti-hLAG-3 antagonistic antibody, BI 754111. Binding properties of BI 754111 are summarized in Supplementary Table 4. The affinity of BI 754111 (KD) to hLAG-3 was determined as 88.6 and 112 pM using two different preparations of the antibody in the same SPR experiment. BI 754111 was cross-reactive to cynomolgus LAG-3 (KD values of 21.6 and 33 pM). Dose-dependent binding of BI 754111 to cell surface-expressed LAG-3 was confirmed using CHO cells stably expressing either hLAG-3 or cynomolgus LAG-3. BI 754111 bound to hLAG-3 (EC90 0.97 nM) and to cynomolgus LAG-3 (EC90 4.08 nM), suggesting similar binding properties to LAG-3 in both species. BI 754111 was not cross-reactive with mLAG-3 expressed on the surface of CHO cells.
Similar EC50 values for binding of BI 754111 to hLAG-3 expressed on activated CD3-positive/CD4-positive or on activated CD3-positive/CD8-positive T cells were observed (0.012 ± 0.006 and 0.003 ± 0.001 nM, respectively). The binding data on activated cynomolgus T cells were similar to human T cells (0.033 ± 0.010 and 0.017 ± 0.005 nM, respectively).
BI 754111 potently blocked binding of soluble hLAG-3 to MHC-II-expressing Raji cells (IC90 of 2.1 nM; Figure 5). Raji cells express HLA-DR, -DQ and -DP MHC-II, and hLAG-3 was shown to bind to all three molecules.22 Thus, our data demonstrating complete blockade of LAG-3 binding to Raji cells by BI 754111 suggest that the antibody is able to interfere with LAG-3 binding to all types of expressed MHC-II molecules.
Figure 5.

BI 754111 potently blocks binding of soluble hLAG-3 to MHC class II expressing Raji cells. Recombinant human LAG-3 Fc chimera was incubated with serially diluted BI 754111 or isotype control. Raji cells expressing MHC class II were added. After incubation and washing, bound human LAG-3 was detected using fluorescently labeled anti-human IgG antibody using flow cytometry. For dose response curves and IC90 calculation, data were normalized to 0% inhibition (defined as the fluorescence value of cells incubated with the soluble hLAG-3 and no antibodies present) and 100% inhibition (defined as the signal obtained with cells without soluble hLAG-3 or antibodies). The graph shows BI 754111 dose-dependent inhibition of binding of soluble LAG-3 to Raji cells expressing MHC class II (one example from four donors). hLAG-3, human lymphocyte activation gene-3; Ig, immunoglobulin; MHC, major histocompatibility complex.
In vitro functional activity of BI 754111 monotherapy and in combination with ezabenlimab
Assessment of the capability of BI 754111 to increase IL-2 secretion of the mouse cell line 3A9-hLAG-3 in the presence of HEL48-62-pulsed MHC-II IAk expressing LK35.2 cells showed an EC50 value of 0.31 nM for BI 754111 (Figure 6(a)).
Figure 6.

Blockade of inhibitory LAG-3/MHC class II signaling by BI 754111 leads to T-cell activation. (a) Detached LK35.2 cells were pre-incubated with HEL48-62 peptide. In parallel, a 3A9 mouse T cell line expressing human LAG-3 was incubated with serially diluted BI 754111 or isotype control. A co-culture of 3A9-hLAG-3: LK35.2 cells (ratio of 2:1) was set up and incubated for 24 hours. Thereafter the supernatant was harvested and mouse IL-2 concentrations were analyzed by ELISA. EC50 was calculated by data transformation; 0% activation was defined as IL-2 secretion of cells incubated with assay medium only and 100% activation was defined as IL-2 secretion of cells incubated with the highest concentration of the reference tool anti-human LAG-3 antibody. (b) PBMCs from healthy human donors who had recently been vaccinated against tetanus were cultivated in the presence of the antigen and T cells were expanded for 13 d. In parallel, monocyte derived DCs were generated and loaded with tetanus antigen. T cell culture and antigen-loaded DCs were co-cultured for one day and on the next day freshly antigen-loaded DCs were added a second time together with antibodies. After 4 d of treatment, supernatants were analyzed for IFN-γ secretion by ELISA (see the scheme in Supplementary Fig. S1). Left graph shows results from one donor: a dose-dependent increase of IFN-γ secretion following treatment with ezabenlimab (blue curve), BI 754111 (orange curve) or ezabenlimab in combination with BI 754111 (green curve). Right graph shows the data from four donors treated with ezabenlimab, BI 754111 or their combination. APC, antigen-presenting cell; DCs, dendritic cells; IFN, interferon; IL, interleukin; MHC-II, major histocompatibility complex class II; LAG-3, lymphocyte activation gene-3; PBMCs, peripheral blood mononuclear cells; SD, standard deviation.
In a second functional assay, the ability of BI 754111 and ezabenlimab as monotherapies or in combination to increase the secretion of IFN-γ was assessed using the tetanus toxoid antigen-specific T cell assay. BI 754111 monotherapy showed a dose-dependent increase of IFN-γ (average 1.8-fold increase versus isotype control; Figure 6(b)). Ezabenlimab monotherapy led to a dose-dependent increase of IFN-γ secretion until a plateau was reached, with an average 6.9-fold maximum increase compared with isotype control and combination of BI 754111 (titration) with ezabenlimab (fixed 200 nM) led to a further increase of IFN-γ secretion (average 13.2-fold increase). All three treatment effects were statistically significant versus isotype, and the combination was statistically significantly higher than either monotherapy (p < 0.05).
Overall, BI 754111 functionally blocks the interaction of LAG-3 with MHC-II and combining BI 754111 with ezabenlimab leads to greater in vitro activity compared with monotherapy with either antibody.
Secondary pharmacodynamic and pharmacokinetic studies
BI 754111 and ezabenlimab were tested for their properties to cause antibody-dependent cellular toxicity (ADCC) or complement-dependent cytotoxicity (CDC) and both were devoid of any ADCC and CDC (data not shown). Ezabenlimab and BI 754111 showed dose-dependent exposure in pharmacokinetic studies using cynomolgus monkeys and the results of all safety and toxicological studies supported first-in-human clinical studies (data not shown).
Discussion
In this study, we present two novel humanized monoclonal antibodies in clinical development: ezabenlimab, targeting PD-1, and BI 754111, targeting LAG-3. Ezabenlimab, a humanized PD-1-targeting monoclonal antibody, blocked the interaction of human PD-1 with its ligands, PD-L1 and PD-L2. Ezabenlimab was cross-reactive with cynomolgus but not mouse PD-1. Ezabenlimab dose-dependently increased IFN-γ secretion, a marker of T-cell activity, in vitro, and demonstrated dose-dependent antitumor activity in a hPD-1 knock-in mouse model. As ezabenlimab is a humanized antibody with a human IgG4 constant region, additional in vivo studies were performed using a mouse IgG1 variant of ezabenlimab (BI 905725). The in vivo antitumor activities of ezabenlimab and BI 905725 were similar.
Upregulation of other inhibitory receptors, such as LAG-3, has been hypothesized to limit the antitumor activity of PD-1/PD-L1 inhibitors by attenuating T-cell activation and preventing tumor cell destruction.23 Therefore, combined targeting of PD-1 and LAG-3 is anticipated to improve antitumor responses versus PD-1 monotherapy. Preclinically, in vivo combination of anti-mouse PD-1 with anti-mouse LAG-3 resulted in superior antitumor activity versus anti-mouse PD-1 treatment alone.15 These studies have predominantly used the rat IgG1 anti-mLAG-3 C9B7W clone. While C9B7W has previously been described to functionally block mLAG-3, it did not appear to prevent the binding of mLAG-3 to MHC-II.24 We showed that C9B7W dose-dependently blocked binding of fluorescently labeled OVA-mMHC-II tetramers to mLAG-3, suggesting C9B7W is a valid tool to study MHC II-blocking anti-LAG-3 antibodies. The difference in the experimental outcome might be related to different assay conditions. For example, we used OVA-loaded MHC-II tetramers whereas others used unloaded MHC-II agents. EX 80658, a variant of the C9B7W variable regions with a mouse IgG1 D265A backbone, showed similar binding properties to mLAG-3 as the parental C9B7W antibody.
We used a MC38 mouse tumor model to assess antitumor activity of combined anti-PD-1 and anti-LAG-3 treatment. Minimal antitumor effects were observed with anti-LAG-3 monotherapy (C9B7W or EX 80658) while mouse anti-hPD-1 monotherapy (BI 905725) resulted in effective tumor responses. Combined anti-LAG-3 and anti-PD-1 treatment enhanced antitumor activity versus anti-PD-1 therapy alone: addition of C9B7W to BI 905725 further delayed tumor growth compared to BI 905725 monotherapy, while addition of EX 80658 to BI 905725 doubled the number of responding tumors versus BI 905725 monotherapy. Reasons for the difference in antitumor activity between addition of C9B7W and EX 80658 to BI 905725 are unclear but could include differing FcR interactions (rat or mouse Fc) or potential differences in exposure between these antibodies. The observed combination effect matches other studies in mouse models: assessment of a rat:mouse chimera mimic of MK-4280 (an anti-hLAG-3 antibody that cross-reacts with mLAG-3) in syngeneic mouse tumor models showed modest antitumor activity as monotherapy, but combination with an anti-mouse PD-1-blocking antibody increased tumor growth inhibition,25 which is in line with the initial data by Woo et al., 2012.15 Similarly, preclinical data with the anti-LAG-3 antibodies, REGN3767 and TSR-033, showed that dual targeting of LAG-3 and PD-1 synergistically improved antitumor activity and T-cell activation.26,27
We developed the anti-hLAG-3 antagonistic antibody, BI 754111, which binds strongly to human and cynomolgus LAG-3, but not mouse or rat LAG-3. BI 754111 blocked the interaction of hLAG-3 with its ligand hMHC-II. Other ligands for LAG-3 – galectin-3 and LSECtin, and in mice also fibrinogen-like protein 1 (FGL-1) – which are believed to play roles in T-cell regulation have been described.28–30 We have not examined the effect of BI 754111 on the interaction between LAG-3 and galectin-3 and LSECtin. By contrast, while we have confirmed a binding interaction between mouse LAG-3 and mouse FGL-1, our studies could not demonstrate binding of human LAG-3 and human FGL-1 (data not shown) so we do not consider the activity of BI 754111 relevant to this interaction.
In vitro, BI 754111 monotherapy showed a dose-dependent, but minimal, increase in IFN-γ secretion. However, the addition of BI 754111 to a fixed dose of ezabenlimab dose-dependently increased IFN-γ secretion. This suggests that anti-PD-1-mediated T-cell activation can be enhanced by addition of BI 754111 and is consistent with data reported for other anti-LAG-3 antibodies.26,27
In conclusion, we have identified and characterized two humanized monoclonal antibodies: ezabenlimab, which targets PD-1, and BI 754111, which targets LAG-3. Both antibodies bound to their targets with high affinity and prevented ligand binding. Ezabenlimab enabled increased IFN-γ release in vitro and demonstrated antitumor activity in vivo; both observations are consistent with the properties of PD-1-blocking and neutralizing antibodies. Combination of anti-PD-1 and anti-LAG-3 antibodies in vivo was associated with enhanced antitumor activity versus PD-1 inhibition alone. As both ezabenlimab and BI 754111 bind to cynomolgus PD-1 and LAG-3, respectively, cynomolgus monkeys were deemed an appropriate animal model for non-clinical safety and toxicological assessment. Both antibodies showed dose-dependent exposure in pharmacokinetic studies and favorable safety and toxicological assessment (data not shown). Overall, our data supported first-in-human clinical studies for both antibodies (NCT03156114; NCT03433898). Preliminary data from these studies have been reported. The combination of BI 754111 and ezabenlimab was well tolerated and antitumor activity was observed in patients with microsatellite stable metastatic colorectal cancer.31 The combination also showed antitumor activity in patients with gastric/gastroesophageal junction or esophageal cancer; however, addition of LAG-3 inhibition did not improve response beyond that expected with anti-PD-1 alone.32 Two other anti-LAG-3 antibodies have also reported preliminary results from the clinical setting. The anti-LAG-3 antibody, LAG525, was assessed as monotherapy or in combination with spartalizumab (an anti-PD-1 antibody) in patients with advanced cancers. There were no antitumor responses in the LAG525 monotherapy cohort but activity was observed for LAG525 plus spartalizumab.33 Relatlimab, another anti-LAG-3 antibody, showed antitumor activity when administered in combination with nivolumab to patients with melanoma who had previously received anti-PD-1/PD-L1 therapy.34 Recent Phase 3 data from the RELATIVITY-047 trial show that relatlimab plus nivolumab significantly improved progression-free survival versus nivolumab alone in patients with untreated metastatic or unresectable melanoma.35 Collectively, preclinical and clinical results suggest that targeting the LAG-3 pathway in combination with PD-1 inhibition may be a key strategy to enhance the immune response and help improve outcomes for cancer patients.
Supplementary Material
Acknowledgments
We gratefully acknowledge the contributions of the entire Boehringer Ingelheim PD-1 and LAG-3 research and development team. In particular, we thank Argyro Fourtouna, Ulrike Nagl, Sonja Porits, Sarah Schweighofer, Irene Schweiger, Martina Sykora for their excellent and dedicated contributions to the experiments described in this paper. We thank Oxford University INNOVATION, Oxford, UK, for the hPD-1 knock-in mouse and Dr. Dario Vignali and St. Jude’s hospital for the modified 3A9 cell lines.
Medical writing support for the development of this manuscript, under the direction of the authors, was provided by Caroline Allinson, of Ashfield MedComms, an Ashfield Health company, and funded by Boehringer Ingelheim.
Funding Statement
The study was funded by Boehringer Ingelheim GmbH.
Disclosure statement
No potential conflict of interest was reported by the authors.
Supplementary material
Supplemental data for this article can be accessed online at https://doi.org/10.1080/2162402X.2022.2080328
Authors’ Disclosures
All authors are or were employees of Boehringer Ingelheim at the time this study was performed.
Authors’ Contributions
All authors contributed to the acquisition, analysis, or interpretation of data. IW and SM drafted the manuscript and all other authors revised it critically for important intellectual content. All authors approved the final version of the manuscript and agree to be accountable for all aspects of the work.
References
- 1.Nishimura H, Nose M, Hiai H, Minato N, Honjo T.. Development of lupus-like autoimmune diseases by disruption of the PD-1 gene encoding an ITIM motif-carrying immunoreceptor. Immunity. 1999;11(2):141–13. doi: 10.1016/s1074-7613(00)80089-8. [DOI] [PubMed] [Google Scholar]
- 2.Freeman GJ, Long AJ, Iwai Y, Bourque K, Chernova T, Nishimura H, Fitz LJ, Malenkovich N, Okazaki T, Byrne MC, et al. Engagement of the PD-1 immunoinhibitory receptor by a novel B7 family member leads to negative regulation of lymphocyte activation. J Exp Med. 2000;192(7):1027–1034. doi: 10.1084/jem.192.7.1027. [DOI] [PMC free article] [PubMed] [Google Scholar]
- 3.Wei SC, Duffy CR, Allison JP. Fundamental mechanisms of immune checkpoint blockade therapy. Cancer Discov. 2018;8(9):1069–1086. doi: 10.1158/2159-8290.Cd-18-0367. [DOI] [PubMed] [Google Scholar]
- 4.McDermott DF, Atkins MB. PD −1 as a potential target in cancer therapy. Cancer Med. 2013;2(5):662–673. doi: 10.1002/cam4.106. [DOI] [PMC free article] [PubMed] [Google Scholar]
- 5.Iwai Y, Ishida M, Tanaka Y, Okazaki T, Honjo T, Minato N. Involvement of PD-L1 on tumor cells in the escape from host immune system and tumor immunotherapy by PD-L1 blockade. Proc Natl Acad Sci U S A. 2002;99(19):12293–12297. doi: 10.1073/pnas.192461099. [DOI] [PMC free article] [PubMed] [Google Scholar]
- 6.Iwai Y. PD-1 blockade inhibits hematogenous spread of poorly immunogenic tumor cells by enhanced recruitment of effector T cells. Int Immunol. 2005;17(2):133–144. doi: 10.1093/intimm/dxh194. [DOI] [PubMed] [Google Scholar]
- 7.Strome SE, Dong H, Tamura H, Voss SG, Flies DB, Tamada K, Salomao D, Cheville J, Hirano F, Lin W, et al. B7-H1 blockade augments adoptive T-cell immunotherapy for squamous cell carcinoma. Cancer Res. 2003;63(19):6501–6505. [PubMed] [Google Scholar]
- 8.Hirano F, Kaneko K, Tamura H, Dong H, Wang S, Ichikawa M, Rietz C, Flies DB, Lau JS, Zhu G, et al. Blockade of B7-H1 and PD-1 by monoclonal antibodies potentiates cancer therapeutic immunity. Cancer Res. 2005;65(3):1089–1096. [PubMed] [Google Scholar]
- 9.Ribas A, Wolchok JD. Cancer immunotherapy using checkpoint blockade. Science. 2018;359(6382):1350–1355. doi: 10.1126/science.aar4060. [DOI] [PMC free article] [PubMed] [Google Scholar]
- 10.Sade-Feldman M, Jiao YJ, Chen JH, Rooney MS, Barzily-Rokni M, Eliane J-P, Bjorgaard SL, Hammond MR, Vitzthum H, Blackmon SM, et al. Resistance to checkpoint blockade therapy through inactivation of antigen presentation. Nature Commun. 2017;8(1):1136. doi: 10.1038/s41467-017-01062-w. [DOI] [PMC free article] [PubMed] [Google Scholar]
- 11.Shin DS, Zaretsky JM, Escuin-Ordinas H, Garcia-Diaz A, Hu-Lieskovan S, Kalbasi A, Grasso CS, Hugo W, Sandoval S, Torrejon DY, et al. Primary resistance to PD-1 blockade mediated by JAK1/2 mutations. Cancer Discov. 2017;7(2):188–201. doi: 10.1158/2159-8290.CD-16-1223%JCancerDiscovery. [DOI] [PMC free article] [PubMed] [Google Scholar]
- 12.Zaretsky JM, Garcia-Diaz A, Shin DS, Escuin-Ordinas H, Hugo W, Hu-Lieskovan S, Torrejon DY, Abril-Rodriguez G, Sandoval S, Barthly L, et al. Mutations associated with acquired resistance to PD-1 blockade in melanoma. New Engl J Med. 2016;375(9):819–829. doi: 10.1056/nejmoa1604958. [DOI] [PMC free article] [PubMed] [Google Scholar]
- 13.Qin S, Xu L, Yi M, Yu S, Wu K, Luo S. Novel immune checkpoint targets: moving beyond PD-1 and CTLA-4. Mol Cancer. 2019;18(1):155. doi: 10.1186/s12943-019-1091-2. [DOI] [PMC free article] [PubMed] [Google Scholar]
- 14.Matsuzaki J, Gnjatic S, Mhawech-Fauceglia P, Beck A, Miller A, Tsuji T, Eppolito C, Qian F, Lele S, Shrikant P, et al. Tumor-infiltrating NY-ESO-1–specific CD8 + T cells are negatively regulated by LAG-3 and PD-1 in human ovarian cancer. Proc Natl Acad Sci USA. 2010;107(17):7875–7880. doi: 10.1073/pnas.1003345107. [DOI] [PMC free article] [PubMed] [Google Scholar]
- 15.Woo SR, Turnis ME, Goldberg MV, Bankoti J, Selby M, Nirschl CJ, Bettini ML, Gravano DM, Vogel P, Liu CL, et al. Immune inhibitory molecules LAG-3 and PD-1 synergistically regulate T-cell function to promote tumoral immune escape. Cancer Res. 2012;72(4):917–927. doi: 10.1158/0008-5472.Can-11-1620. [DOI] [PMC free article] [PubMed] [Google Scholar]
- 16.Maruhashi T, Sugiura D, Okazaki IM, Okazaki T. LAG-3: from molecular functions to clinical applications. J Immunother Cancer. 2020;8(2):e001014. doi: 10.1136/jitc-2020-001014. [DOI] [PMC free article] [PubMed] [Google Scholar]
- 17.Gestermann N, Saugy D, Martignier C, Tillé L, Fuertes Marraco SA, Zettl M, Tirapu I, Speiser DE, Verdeil G. LAG-3 and PD-1+LAG-3 inhibition promote anti-tumor immune responses in human autologous melanoma/T cell co-cultures. Oncoimmunology. 2020;9(1):1736792. doi: 10.1080/2162402x.2020.1736792. [DOI] [PMC free article] [PubMed] [Google Scholar]
- 18.Workman CJ, Dugger KJ, Vignali DA. Cutting edge: molecular analysis of the negative regulatory function of lymphocyte activation gene-3. J Immunol. 2002;169(10):5392–5395. doi: 10.4049/jimmunol.169.10.5392. [DOI] [PubMed] [Google Scholar]
- 19.Silva JP, Vetterlein O, Jose J, Peters S, Kirby H. The S228P mutation prevents in vivo and in vitro IgG4 Fab-arm exchange as demonstrated using a combination of novel quantitative immunoassays and physiological matrix preparation. J Biol Chem. 2015;290(9):5462–5469. doi: 10.1074/jbc.M114.600973. [DOI] [PMC free article] [PubMed] [Google Scholar]
- 20.Wang F, Tsai JC, Davis JH, Chau B, Dong J, West SM, Hogan JM, Wheeler ML, Bee C, Morishige W, et al. Design and characterization of mouse IgG1 and IgG2a bispecific antibodies for use in syngeneic models. MAbs. 2020;12(1):1685350. doi: 10.1080/19420862.2019.1685350. [DOI] [PMC free article] [PubMed] [Google Scholar]
- 21.Dohlsten M, Hedlund G, Segren S, Lando PA, Herrmann T, Kelly AP, Kalland T. Human major histocompatibility complex class II-negative colon carcinoma cells present staphylococcal superantigens to cytotoxic T lymphocytes: evidence for a novel enterotoxin receptor. Eur J Immunol. 1991;21(5):1229–1233. doi: 10.1002/eji.1830210520. [DOI] [PubMed] [Google Scholar]
- 22.Niehrs A, Garcia-Beltran WF, Norman PJ, Watson GM, Holzemer A, Chapel A, Richert L, Pommerening-Roser A, Korner C, Ozawa M, et al. A subset of HLA-DP molecules serve as ligands for the natural cytotoxicity receptor NKp44. Nat Immunol. 2019;20(9):1129–1137. doi: 10.1038/s41590-019-0448-4. [DOI] [PMC free article] [PubMed] [Google Scholar]
- 23.Huang RY, Francois A, McGray AR, Miliotto A, Odunsi K. Compensatory upregulation of PD-1, LAG-3, and CTLA-4 limits the efficacy of single-agent checkpoint blockade in metastatic ovarian cancer. Oncoimmunology. 2017;6(1):e1249561. doi: 10.1080/2162402x.2016.1249561. [DOI] [PMC free article] [PubMed] [Google Scholar]
- 24.Workman CJ, Rice DS, Dugger KJ, Kurschner C, Vignali DA. Phenotypic analysis of the murine CD4-related glycoprotein, CD223 (LAG-3). Eur J Immunol. 2002;32(8):2255–2263. doi: 10.1002/1521-4141(200208)32:8<2255::AID-IMMU2255>3.0.CO;2-A. [DOI] [PubMed] [Google Scholar]
- 25.Haines BB, Javaid S, Cui L, Hirsch H, Cemerski S, McClanahan T, Sathe M, Zhang S, Rosenzweig M, et al. Blockade of LAG-3 amplifies immune activation signatures and augments curative antitumor responses to anti-PD-1 therapy in immune competent mouse models of cancer. Cancer Res. 2017;77:Abstr4714. doi: 10.1158/1538-7445.AM2017-4714. [DOI] [Google Scholar]
- 26.Burova E, Hermann A, Dai J, Ullman E, Halasz G, Potocky T, Hong S, Liu M, Allbritton O, Woodruff A, et al. Preclinical development of the anti-LAG-3 antibody REGN3767: characterization and activity in combination with the anti-PD-1 antibody cemiplimab in human PD-1xLAG-3 –Knockin Mice. Mol Cancer Ther. 2019;18(11):2051–2062. doi: 10.1158/1535-7163.MCT-18-1376. [DOI] [PubMed] [Google Scholar]
- 27.Ghosh S, Sharma G, Travers J, Kumar S, Choi J, Jun HT, Kehry M, Ramaswamy S, Jenkins D. TSR-033, a novel therapeutic antibody targeting LAG-3, enhances T-cell function and the activity of PD-1 blockade In Vitro and In Vivo. Mol Cancer Ther. 2019;18(3):632–641. doi: 10.1158/1535-7163.Mct-18-0836. [DOI] [PubMed] [Google Scholar]
- 28.Kouo T, Huang L, Pucsek AB, Cao M, Solt S, Armstrong T, Jaffee E. Galectin-3 shapes antitumor immune responses by suppressing CD8 + T cells via LAG-3 and inhibiting expansion of plasmacytoid dendritic cells. Cancer Immunol Res. 2015;3(4):412–423. doi: 10.1158/2326-6066.Cir-14-0150. [DOI] [PMC free article] [PubMed] [Google Scholar]
- 29.Xu F, Liu J, Liu D, Liu B, Wang M, Hu Z, Du X, Tang L, He F. LSECtin expressed on melanoma cells promotes tumor progression by inhibiting antitumor T-cell responses. Cancer Res. 2014;74(13):3418–3428. doi: 10.1158/0008-5472.Can-13-2690. [DOI] [PubMed] [Google Scholar]
- 30.Wang J, Sanmamed MF, Datar I, Su TT, Ji L, Sun J, Chen L, Chen Y, Zhu G, Yin W, et al. Fibrinogen-like protein 1 is a major immune inhibitory ligand of LAG-3. Cell. 2019;176(1–2):334–347.e312. doi: 10.1016/j.cell.2018.11.010. [DOI] [PMC free article] [PubMed] [Google Scholar]
- 31.Bendell J, Ulahannan SV, Chu Q, Patel M, George B, Landsberg R, Elgadi M, Duffy C, Graeser R, et al. A phase I, dose finding study of BI 754111, an anti-LAG-3 antibody, in combination with BI 754091, an anti-PD-1 antibody, in patients with advanced solid tumors: preliminary results from the microsatellite stable (MSS) metastatic colorectal cancer (mCRC) cohort. Mol Cancer Ther. 2019;18:AbstrC027. doi: 10.1158/1535-7163.TARG-19-C027. [DOI] [Google Scholar]
- 32.Yamaguchi K, Kang Y-K, D-Y O, Kondo S, Rha S, Kuboki Y, Morimoto M, Hara H, Lin -C-C, Tachibana Y, et al. Phase I study of BI 754091 plus BI 754111 in Asian patients with gastric/gastroesophageal junction or esophageal cancer. J Clin Oncol. 2021;39(3_suppl):Abstr212. doi: 10.1200/JCO.2021.39.3_suppl.212. [DOI] [Google Scholar]
- 33.Hong DS, Patrick S, Aitana C, John S, María ODO, Carvajal RD, Amy P, Chrisann K, Taito E, et al. Phase I/II study of LAG525 ± spartalizumab (PDR001) in patients (pts) with advanced malignancies. J Clin Oncol. 2018;36(15_suppl):3012. doi: 10.1200/JCO.2018.36.15_suppl.3012. [DOI] [Google Scholar]
- 34.Ascierto PA, Melero I, Bhatia S, Bono P, Sanborn RE, Lipson EJ, Callahan MK, Gajewski T, Gomez-Roca CA, Hodi FS, et al. Initial efficacy of anti-lymphocyte activation gene-3 (anti–LAG-3; BMS-986016) in combination with nivolumab (nivo) in pts with melanoma (MEL) previously treated with anti–PD-1/PD-L1 therapy. J Clin Oncol. 2017;35(15_suppl):Abstr9520. doi: 10.1200/JCO.2017.35.15_suppl.9520. [DOI] [Google Scholar]
- 35.Lipson EJ, Tawbi HAH, Schadendorf D, Ascierto PA, Matamala LA, Gutiérrez EC, Rutkowski P, Gogas H, Lao CD, Janoski de Menezes J, et al. Relatlimab (RELA) plus nivolumab (NIVO) versus NIVO in first-line advanced melanoma: primary phase III results from RELATIVITY-047 (CA224-047). J Clin Oncol. 2021;39(Suppl 15_suppl):Abstr9503. doi: 10.1200/JCO.2021.39.15_suppl.9503. [DOI] [Google Scholar]
Associated Data
This section collects any data citations, data availability statements, or supplementary materials included in this article.
Supplementary Materials
Data Availability Statement
All data relevant to the study are included in the article or as Supplementary Information. Any further information regarding resources and reagents may be directly requested to the corresponding author and will be available upon reasonable request.