

ABSTRACT
The maintenance of a strong IL21 production in memory CD4 T cells, especially in HIV-1-specific cells, represents a major correlate of natural immune protection against the virus. However, the molecular mechanisms underlying IL21 production during HIV-1 infection, which is only elevated among the naturally protected elite controllers (EC), are still unknown. We recently found out that lipophagy is a critical immune mediator that control an antiviral metabolic state following CD8A T cell receptor engagement, playing an important role in the natural control of HIV-1 infection. This led us to investigate whether the beneficial role of a strong macroautophagy/autophagy, could also be used to ensure effective IL21 production as well. Herein, we confirm that after both polyclonal and HIV-1-specific activation, memory CD4 T cells (Mem) from EC display enhanced activity of the autophagy-mediated proteolysis compared to ART. Our results indicate that the enhanced autophagy activity in EC was controlled by the energy-sensing PRKAA1 (protein kinase AMP-activated catalytic subunit alpha 1). We further confirmed the critical role of the autophagy-mediated proteolysis in the strong IL21 production in EC by using BECN1 gene silencing as well as protease, PRKAA1, and lysosomal inhibitors. Finally, we established that high autophagy-mediated proteolysis in EC fuels their cellular rates of mitochondrial respiration due to glutaminolysis. Our data confirm the critical role of autophagy in dictating the metabolic input, which is required not only to ensure protective cytotoxic CD8A T cell responses, but also to provide strong IL21 production among antiviral CD4 T cells.
Abbreviations: AKG: alpha-ketoglutarate; ART: patients under antiretroviral therapy; ATG7: autophagy related 7; BaF: bafilomycin A1; BECN1: beclin 1; Chloro.: chloroquine; EC: elite controllers; EIF4EBP1: eukaryotic translation initiation factor 4E binding protein 1; FOXO3: forkhead box O3; GLS: glutaminase; GLUD1: glutamate dehydrogenase 1; HIVneg: HIV-1-uninfected control donors; IFNG/IFN-γ: interferon gamma; IL21: interleukin 21; MTOR: mechanistic target of rapamycin kinase; PBMC: peripheral blood mononuclear cells; PRKAA1: protein kinase AMP-activated catalytic subunit alpha 1; SQSTM1: sequestosome 1; TCA: tricarboxylic acid cycle; ULK1: unc-51 like autophagy activating kinase
KEYWORDS: Antiretroviral therapy, autophagy-mediated proteolysis, elite controllers, glutaminolysis, HIV-1, IL21, PRKAA1
Introduction
Despite the fact that antiretroviral therapy has substantially improved the life expectancy of HIV-1-infected patients, they are still associated with a number of health complications, metabolic disorders, drug resistances, and the inability to fully restore anti-HIV-1 immunity [1–3]. Therefore, a cure for HIV-1 is still highly required and has become a global research priority. Among all of the strategies that have been developed for this purpose, the most feasible ones are referred to as functional cures. These strategies consist of finding a way to coexist with the virus in the long run. The functional cures share a common goal of inducing antiretroviral therapy-free remission of HIV-1 pathogenesis and disease progression. The most critical component, which is required to ensure the success of these functional cures, is the restoration of a strong anti-HIV-1 immunity in patients [4]. Indeed, a strong anti-HIV-1 immunity is key to avoid or delay any viral rebound after medical interruption, which is needed to pave the way to a natural, long-lasting immune-based control of HIV-1 replication.
Elite controllers (EC) are a unique group of chronically HIV-1-infected patients who display a full drug-free control of HIV-1 infection for years [5,6]. The fact that EC also maintain a strong anti-HIV-1 immune response despite persistent HIV-1 infection provided the evidence that a functional cure could eventually be achieved. However, we first have to identify the genetic, molecular, and metabolic mechanisms that are responsible for providing such protective immunity in EC [7–9]. For instance, in contrast to patients under therapy (ART), EC maintain an effective peripheral CD4 T-follicular cell function with untouched IL21 (interleukin 21) production [10–12] along with highly functional cell responses [7,13]. In addition, we have previously demonstrated that memory CD4 T cells (Mem) from EC were more resistant to FAS-mediated apoptosis and were able to persist longer in culture after multiple rounds of T cell receptor triggering when compared to ART [14]. We further showed that higher Mem survival in EC was a direct consequence of enhanced suppression of the pro-apoptotic activity of the transcription factor FOXO3/FOXO3a.
However, besides Mem survival, the mechanisms responsible for the superior immunity found in Mem from EC, especially in their IL21-producing and HIV-1-specific CD4 T cells, are unknown.
In the present study, we confirmed that following polyclonal and HIV-1 Gag-specific cell activations, Mem from EC displayed increased expression of IL21. Our data showed that activated Mem from EC, including specific HIV-1 clones, displayed enhanced macroautophagy/autophagy activity when compared to Mem from ART. Autophagy is a housekeeping stress-induced lysosomal degradation pathway, which regulates cellular homeostasis by clearing damaged proteins or organelles. Autophagy can also recycle macromolecules and metabolites for energy production under specific conditions [15–17]. For instance, autophagy, which is induced in CD4 T cells in response to T-cell receptor engagement [18], is a key catabolic process that regulates energy metabolism, cell proliferation, cytokine production, and Mem maintenance during effector T-cell activation [19–21]. Although previous observations have proposed that autophagy may contribute to limiting HIV-1 pathogenesis in EC by targeting viral components for degradation [22], we raised the question of whether it could also provide their Mem with energetic support and superior immunity. Using specific gene silencing of BECN1 (beclin 1), a major regulator of autophagic activity, we confirmed the critical role of this catabolic process in IL21-producing Mem. We further found that both lysosomal and protease activities were required for optimal IL21 expression during HIV-1 infection. Mechanistically speaking, we found that the energy-sensing PRKAA1 (protein kinase AMP-activated catalytic subunit alpha 1) activity regulated autophagy-mediated proteolysis in Mem from EC, rather than the MTOR (mechanistic target of rapamycin kinase). Finally, we concluded our study by confirming that the enhanced autophagy-mediated proteolysis impacted the cellular energetic balance directly through protein breakdown and glutaminolysis.
Overall, our study unveiled a new molecular and metabolic advantage in EC, which must be considered in the design of next generation functional cures for the treatment of HIV-1-infected patients, whose control of viral replication is solely mediated by their medication.
Results
Activated Mem from EC display enhanced PRKAA1-dependent autophagy when compared to ART
In contrast to ART, we have recently shown that HIV-1-specific cytotoxic CD8A T cells from EC display a unique metabolic advantage involving the autophagy-dependent lytic activity [23]. Our data further demonstrated that this was possible because of memory CD4 T cell help via their IL21 production. Since the mechanisms governing the maintenance of strong IL21 production during HIV-1 infection are still unknown, we sought to investigate whether HIV-1-specific Mem from EC could similarly display enhanced autophagy when compared to ART.
As a reminder, autophagy is a conserved catabolic process involved in the regulation of homeostasis and energy metabolism in T cells [19,24]. It is basically a process that involves the capture, isolation, and lysosomal digestion of intracellular materials in autolysosomes or ALs [25]. Since autophagy is induced at early stages in CD4 T cells following their activation [18], we performed a 6 h-long polyclonal or HIV-1 Gag activation to evaluate autophagy in Mem for all study groups (EC, ART and HIVneg control donors). First, we thought it was necessary to characterize additional Mem features for all study groups at 6 h of cell activation (such as the levels of cell activation and survival) before assessing their autophagy. Our data confirmed that all HIV-1-specific CD4 T cells, which were characterized by IFNG/IFN-γ expression after Gag-specific stimulation (Figure S1A), had a CD45RAneg memory phenotype (Figure S1B). At 6 h of polyclonal or HIV-1-specific stimulations, we did not find any differences in the levels of both Mem activation (as determined by the percentages of IFNG+cells) and apoptosis (as determined by the percentages and absolute numbers of viable ANXA5neg cells) between all study groups (Figure S1C-E).
We then used several methods to ensure a controlled assessment of autophagy in viable Mem after cell activation and avoid any misinterpreted conclusions on collected data. In this context, we decided to assess in Mem from all study groups the expression levels of several autophagy-related genes by flow cytometry (gating strategy shown in Figure S2), the numbers of both autophagic vacuoles (AVs) and active autolysosomes (ALs) using ultrastructural microscopy analysis (micrographs shown in Figure S3A to discriminate between AV and AL structures), and the measurement of autophagy-mediated proteolysis with a radiometric assay. First, at 6 h of both polyclonal and HIV-1-specific activation, we found enhanced expression for several autophagy-related players (ATGs) in Mem from EC and HIVneg controls when compared to ART (as determined by both the percentage of BECN1+ULK1+ATG7+ and SQSTM1+ cells when bafilomycin A1 (BaF) was added in culture) (Figure 1A,B). Of note, the low expression levels of the ATGs were found similar between all groups when considering non-activated cells. Our microscopic analysis further showed that activated Mem from EC and HIVneg displayed higher numbers of both AVs and ALs per cell when compared to ART (Figures 1C, Figure S3B,C and Table S2). Similarly, the activity of autophagy-mediated proteolysis in Mem, which was induced with 6 h-long T cell activation, was confirmed to be higher in EC and HIVneg when compared to ART (Figure 1D). We also found that the activity of autophagy-mediated proteolysis in activated Mem from EC and HIVneg was prevented by blocking the autophagy-related lytic (BaF and Chloro.) and protease (E64d-PepA) activity (Figure 1D). Since the autophagy-mediated proteolysis represents a functional assessment of the autophagic activity in Mem and was tightly correlated with the expression of ATGs (Figure 1E), we decided to use this radiometric assay for the rest of our study every time we had to determine the status of autophagy in culture.
Figure 1.
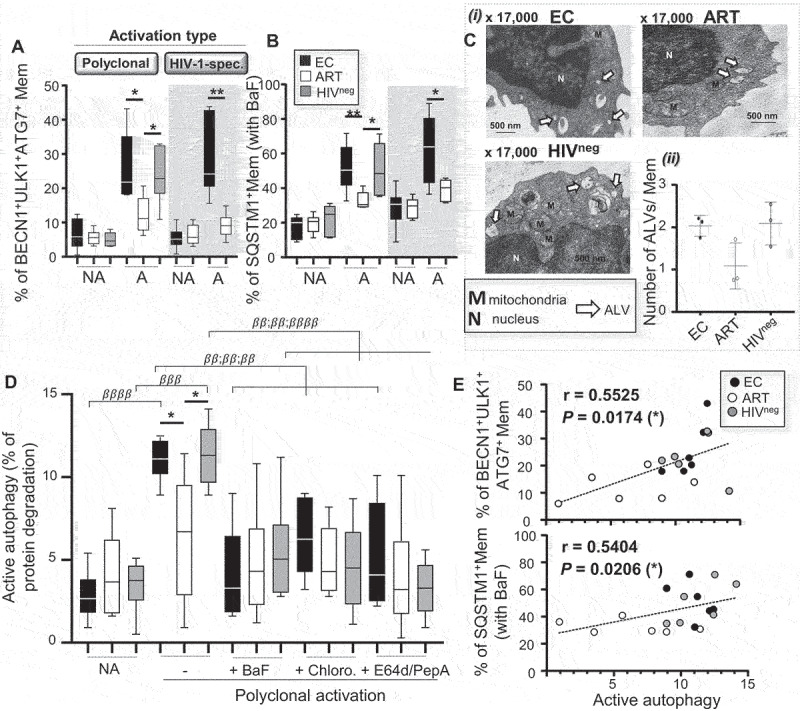
Enhanced autophagy-mediated proteolysis in Mem from EC after cell activation. Mem from EC, ART, and HIVneg were either polyclonally or HIV-1 Gag-specifically activated for 6 h. Of note, HIV-1-specific Mem were identified at 6 h post-activation by their positive staining for IFNG. (A) The percentages of Mem, which expressed autophagic players such as BECN1, ULK1 and ATG7, were then determined by flow cytometry. (B) We also assessed the percentages of SQSTM1+ Mem when lysosomal activity was blocked by BaF during culture. A, activated and NA, non-activated culture condition. (C) Ultrastructural analysis of purified Mem from EC, ART, and HIVneg after 6 h of polyclonal activation. i. Representative micrographs to appreciate the numbers of active autolysosomes (ALs) (X 17,000). ii. Quantitative analysis of the number of ALs per Mem for all study groups. (D) Autophagy-mediated proteolysis determined in purified Mem after polyclonal activation (PA) or not (NA), and in the presence or absence of BaF, Chloro., or E64d/PepA, by using a pulse-chase approach. (E) We assessed in polyclonally activated Mem from all study participants the correlation between the levels of proteolytic degradation of long-lived proteins with the percentages of BECN1+ ULK1+ ATG7+ or SQSTM1+ cells. N = 6 for all experiments, except for (C) and (E) with n = 3 and 18 respectively. The error bars indicate standard deviations from the means. β, symbol used for paired t-test (comparison between treated Mem and untreated control). *, symbol used for Mann-Whitney test (comparison between study groups).
Finally, we aimed to identify the upstream cell mechanisms that drove the enhanced autophagy-mediated proteolysis in Mem from EC when compared to ART that follows T cell activation (Figure 1D; NA versus A). Autophagy is known to be regulated by two major energy-sensors, MTOR and PRKAA1 [26]. In this context, we were interested to first investigate the impact of MTOR activity, since it is considered as the main negative regulator of autophagy [26,27]. In addition to similar levels of MTOR activity for all study groups after Mem activation (as determined by the percentage of active p-S4228 MTOR+ cells and its downstream target p-Thr36/45 EIF4EBP1+ cells) (Figure S4A-D) [18], we found that the addition of MTOR inhibitors (torin-1 and rapamycin) in culture had no impact on the levels of autophagy-mediated proteolysis (Figure S4E,F). Similar and low levels of PRKAA1 activity (as determined by the relative protein expression levels of active p-Thr172 PRKAA1 and calculated as follows: p-Thr172 PRKAA1:total PRKAA1 in %) were found in non-activated Mem for all study groups (Figure 2A). In contrast, we found higher increases in relative PRKAA1 activity with activated Mem from EC and HIVneg when compared to ART (Figure 2A) [28]. Furthermore, the adding of the PRKAA1 inhibitor compound C in culture with activated Mem confirms the role of the kinase in regulating their autophagy-mediated proteolysis after T cell receptor engagement (Figure 2B).
Figure 2.
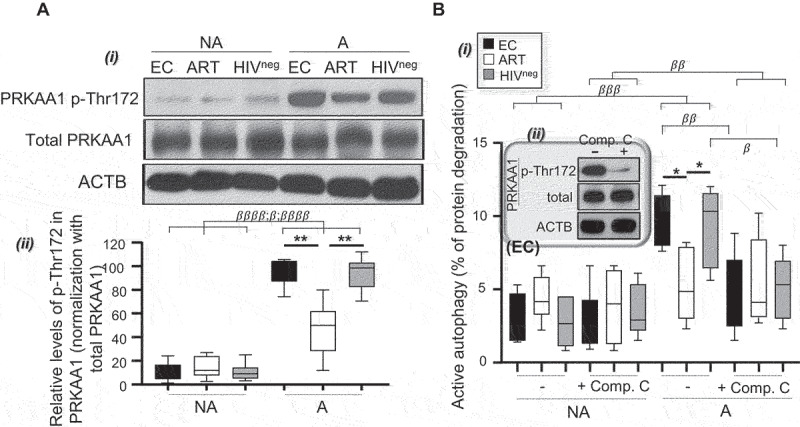
Enhanced PRKAA1-dependent autophagy-mediated proteolysis in Mem from EC after cell activation. Mem from EC, ART, and HIVneg were polyclonally activated for 6 h. (A) Levels of total and p-Thr172 PRKAA1 were determined on non-activated (NA) and polyclonally activated (PA) Mem by western blotting. i. Representative blots for all study groups. ii. Densitometric quantification of 6 independent experiments was performed using ImageQuant software (mean ± SD). Results shown represent the relative levels of p-Thr172 in PRKAA1 and were determined as follows: values for p-Thr172 PRKAA1/values in % of total PRKAA1. (B) i. Autophagy-dependent proteolysis determined in purified Mem form EC, ART and HIVneg with or without PRKAA1 inhibition (using compound C [comp. C]), and after 6 h of polyclonal activation (PA) or not (NA). ii. Confirmation of AMPK inhibition by compound C was determined by western blotting using polyclonally activated Mem from EC (representative blots of 3 independent confirmations). N = 6 for all experiments. The error bars indicate standard deviations from the means. β, symbol used for paired t-test (comparison between treated Mem and untreated control). *, symbol used for Mann-Whitney test (comparison between study groups).
Overall, our data confirmed a superior autophagy-mediated proteolysis activity in activated Mem, including in HIV-1-specific cells, from EC when compared to ART. Mechanistically speaking, the results also showed that the activity of autophagy-mediated proteolysis during natural protection of HIV-1 infection was regulated through a PRKAA1-dependent control.
Strong autophagy-mediated proteolysis is needed to ensure effective IL21 Mem production during HIV-1 infection
Studies based on the comparison between EC and ART led to the identification of several key correlates of natural immune protection against HIV-1 [9]. Among them, the superior IL21 production in EC is a well-acknowledged Mem-related advantage, since it provides critical help to CD8A T cell, natural killer, and B-cell-mediated antiviral responses during chronic HIV-1 infection [11,12,23,29].
To investigate whether autophagy-mediated proteolysis was responsible for superior IL21 production in Mem during HIV-1 infection, we specifically inhibited BECN1 expression using small interfering silencing RNAs (siRNA) before cell activation. Briefly, purified Mem from all study groups were either electroporated or transfected with siRNAs specific for BECN1 or with negative control siRNA for 2 h. Then, cells were washed twice and cultured with their autologous CD4-depleted PBMC. At 24 h post-transfection, we confirmed by flow cytometry around 80% protein decrease of BECN1 expression in both EC and HIVneg (Figure 3A). Of note, BECN1 silencing in EC and HIVneg led to reductions of its protein expression to levels comparable to ART. Silencing BECN1 had no impact on Mem survival as determined by the percentage of apoptotic ANXA5+ Mem at 24 h post cell transfection (Figure S5A). As expected, we found that pre-silencing BECN1 expression in EC and HIVneg led to potent blockade of autophagy-mediated proteolysis after 6 h of Mem activation (Figure 3B and Figure S5B). In addition to specific BECN1 gene pre-silencing, we also treated our cultures with chemical inhibitors to block the autophagy-related lytic (BaF and Chloro.), protease (E64d-PepA) and PRKAA1 (compound C) activities before assessing IL21 expression levels. Of note, we confirmed the efficacy of all chemical inhibitors in blocking the autophagy-mediated proteolysis in 6 h-long polyclonally activated Mem from EC. Neither BECN1 gene silencing nor the treatment with chemical inhibitors affected the percentage of IFNG+ Mem at 6 h of cell activation for all study groups (Figure S6A,B). In contrast, we found that blocking autophagy-mediated proteolysis with BECN1 silencing or chemical inhibitors in EC and HIVneg led to potent decreases of the percentage of IL21+ Mem to levels that were comparable to ART (Figure 3C,D and Figure S5C).
Figure 3.

Autophagy-mediated proteolysis is required for optimal IL21 production in Mem from EC. Autophagy-mediated proteolysis and IL21 production were both determined in activated Mem under specific BECN1 gene silencing (siRNA IDs: 137,198), or PRKAA1 (compound C), lysosomal (BaF or Chloro.), and protease (E64d-PepA) inactivation. (A) Levels of BECN1 were determined on Mem after 24 h of cell transfection with negative or BECN1 siRNAs by flow cytometry. i. Representative histograms of BECN1 expression in transfected Mem from EC. ii. Percentages of BECN1+ cells in Mem with or without specific BECN1 silencing for all study groups. % of BECN1 decrease was also indicated in bold for the EC’ and HIVneg’s groups. (B) Autophagy-mediated proteolysis assessed in polyclonally activated Mem with or without specific BECN1 gene silencing or chemical inhibitors. Levels of IL21 production in Mem that have then been either (C) i. polyclonally or (D) HIV-1-specifically activated for 6 h with or without specific BECN1 gene silencing or chemical inhibitors. (C) ii. Representative histograms of IL21 expression in polyclonally-activated Mem from EC with or without autophagy blockade. iii. Confirmation of PRKAA1 inhibition by compound C was determined by western blotting using polyclonally activated Mem from EC (representative blots of 3 independent confirmations). N = 6. The error bars indicate standard deviations from the means. β, symbol used for paired t-test (comparison between treated Mem and untreated control). *, symbol used for Mann-Whitney test (comparison between study groups).
Overall, our results demonstrate a critical role of autophagy-mediated proteolysis in the superior IL21 production found in Mem from EC, including in HIV-1-specific cells.
Autophagy activity in Mem from EC favors the release of free glutamine rather than fatty acids, therefore promoting glutaminolysis
Mounting an antiviral immune response against pathogens is always an energetically demanding process. In this regard, under specific circumstances such as T cell activation, autophagy can be essential for the maintenance of mitochondrial energetic function by providing metabolic substrates through lysosomal degradation [19,24].
We have recently shown that HIV-1-specific cytotoxic CD8A T cells from EC displayed a unique metabolic advantage involving the autophagy-dependent lytic activity [23]. In fact, we have determined that enhanced autophagy in CD8A T cells from EC was directed toward the degradation of intracellular lipid content and the release of free fatty acids, referred to as lipophagy, to fuel mitochondrial energy production. Although our current data on Mem indicated that EC used autophagy to degrade protein content and release free amino acids to support their strong IL21 production (Figure 3C,D), we could not exclude a potential use of lipophagy as well. Therefore, we first assessed the levels of Mem lipophagy with a recently developed ImageStream-based assay, which relies on the quantification of increased lipid content within lysosomes when cultures are conducted with BaF (Figure 4A,B) [23]. First and foremost, we validated our assay by using Huh7.5 hepatic cells, which have been starved or not for 2 h. In this regard, we confirmed higher lipophagic activity, as determined by the ΔBDS value and mean LipidTox puncta per cells, in starved Huh7.5 cells when compared to those cultured in complete DMEM (Figure 4C,D). Our data further showed no differences between EC and ART, both for Mem that have been activated or not. Similarly, we found no differences for the mean LipidTox puncta per Mem between EC and ART after cell activation (Figure 4E). Of note, although mean LipidTox puncta were similar between all study groups, higher lipophagic activity determined with ΔBDS value was found in HIVneg when compared to EC (Figure 4C,E). Overall, our data confirm that higher autophagy in Mem from EC after T cell activation is not associated with increased lipophagic activity when compared to ART.
Figure 4.

Similar lipophagy levels in activated Mem. (A-C) Assessment of lipophagy activity for all study groups by using our recently developed ImageStream-based lipophagy assay. Of note, we included lipophagy induction in starved Huh7.5 hepatic cells as the experimental control. (A) Representative images of single Lyso-ID+ LipidTox+ Huh7.5 cells (with or without cell starvation) and Mem for all groups that have been polyclonally activated or not for 6 h. All culture conditions were conducted in the presence or absence of BaF (“cumulative” and “steady-state” conditions, respectively). BF, bright field. (B) Magnified images showing increased lysosomal content of endogenous lipids in BaF-treated cells, which is an indicator of lipophagy activity when compared to cells without BaF. (C) Quantification of lipophagy activity determined in Lyso-ID+ LipidTox+ Huh7.5 cells and Mem in EC, ART, and HIVneg. Lipophagy activity was determined by the formula: ΔBDS = (% of BDShigh cells with BaF) – (% of BDShigh cells without BaF). (D, E) Imaging-based assay to assess lipophagy activity. (D) Mean LipidTox puncta per Huh7.5 cells in cumulative state (after normalization with the related steady-state condition). (E) At 6 h of polyclonal activation, lipophagy activity was assessed in Mem from EC, ART and HIVneg. Results shown are the mean LipidTox puncta per activated Mem in cumulative state (after normalization with the related steady-state condition). N = 6, except for n = 2 for Huh7.5 controls. The error bars indicate standard deviations from the means. β, symbol used for paired t-test (comparison between treated Mem and untreated control). *, symbol used for Mann-Whitney test (comparison between study groups).
Next, we hypothesized that enhanced PRKAA1 and autophagic activities found in Mem from EC after 6 h-long T cell receptor stimulation could rather be used to degrade protein content and provide free glutamine. Indeed, a large body of literature vouch for the critical role of glutaminolysis, which is a two-step catabolic process starting with the conversion of free glutamine into glutamate, to meet CD4 T cell bioenergetic demands during cell activation [30,31]. In this context, we first assessed the intracellular concentrations of total glutamine, which was converted into its downstream metabolite glutamate, by using a bioluminescence-based assay. Mem from EC have been activated or not for 6 h in the presence or absence of autophagy-mediated proteolysis (using BaF and E64d-PepA) or PRKAA1 (using compound C) blockade before assessing the intracellular concentrations of total glutamine. As expected, our data confirmed increases of total intracellular glutamine levels in EC after Mem activation, which were prevented when both of autophagy-mediated proteolysis and PRKAA1 were blocked in culture (Figure 5A).
Figure 5.
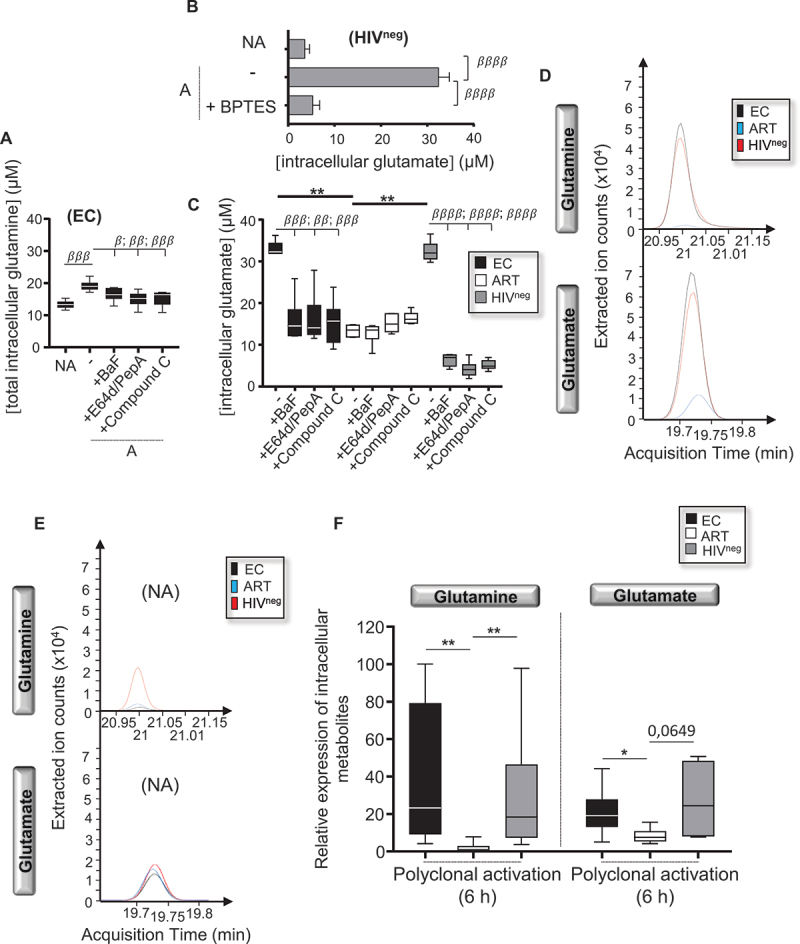
Mem from EC rather use autophagy-mediated proteolysis to support the release of free glutamine. (A-D) Intracellular levels of (A) total converted glutamine and (B,C) glutamate only in Mem at 6 h of cell activation. (A) Levels of total converted glutamine within Mem from EC, which have been or not polyclonally activated with or without PRKAA1-dependent autophagy-mediated proteolysis blockade (BaF, E64d-PepA, or compound C). (B) Validation of the glutamate bioluminescence-based measurement by using Mem from HIVneg that have been treated with BPTES to block any glutamate conversion during their cell activation. (C) Levels of glutamate in polyclonally activated Mem for all study groups with or without PRKAA1-dependent autophagy-mediated proteolysis blockade (BaF, E64d-PepA, or compound C). (D) Chromatograms of extracted ion counts representing area under the curve quantification of glutamate and glutamine in polyclonally activated Mem in all study groups. (E) Chromatograms of extracted ion counts representing area under the curve quantification of glutamate and glutamine in non-activated (NA) Mem in all study groups. (F) Relative expression of intracellular glutamine and glutamate in activated Mem in all study groups. Of note, polyclonally activated Mem from EC and HIVneg counts required 10x dilution to avoid saturating signals. N = 6. β, symbol used for paired t-test (comparison between treated Mem and untreated control). *, symbol used for Mann-Whitney test (comparison between study groups).
Then, we activated purified Mem for 6 h and for all study groups with or without PRKAA1-dependent autophagy blockade, before assessing in all study groups the intracellular levels of glutamate. First and foremost, we validated the assay on Mem from HIVneg control donors by confirming the increase of intracellular glutamate during T cell activation, which was unsurprisingly prevented when BPTES was added in culture (Figure 5B). Of note, BPTES prevents glutamate formation from free glutamine by selectively blocking the enzymatic activity of GLS (glutaminase). At 6 h post-cell activation, our data showed that Mem from EC and HIVneg displayed increased levels of intracellular glutamate when compared to ART (Figure 5C). We also found that, blocking autophagy-related lytic (BaF), protease (E64d-PepA) and PRKAA1 (compound C) activities in Mem from EC and HIVneg during cell activation all led to significant reduction of their glutamate production to levels comparable in ART (Figure 5C). Finally, we validated higher presence of both intracellular glutamine and glutamate only in activated Mem from EC and HIVneg when compared to those of ART (Figure 5D-F).
In summary, our findings show that activated Mem from EC and HIVneg, when compared to ART, better support glutaminolysis in an autophagy-dependent manner.
Autophagy-dependent glutaminolysis in EC represents a new metabolic advantage required for strong IL21 production
Our next step was to investigate whether the enhanced autophagy-dependent glutaminolysis found in Mem from EC was associated with higher rates of energy production. To do so, we polyclonally activated Mem from EC for 6 h with or without blockade of PRKAA1-dependent and autophagy-mediated proteolysis (BaF, E64d-PepA, and compound C) or of glutaminolysis (BPTES and R162), before evaluating their mitochondrial respiration with the Agilent flux analyzer. Of note, the R162 inhibitor prevents the enzymatic conversion of glutamate into α-ketoglutarate, which is the second step of the glutaminolysis. Following the manufacturer’s instruction, the respiratory kinetics that resulted from the sequential addition of pharmacological agents to the respiring Mem allowed us to calculate both their mitochondrial spare respiratory capacity (SRC) and ATP-linked respiration. As expected, we found significant decrease of the whole mitochondrial SRC and ATP-linked respiration in EC when PRKAA1-dependent and autophagy-dependent proteolysis, and glutaminolysis were all blocked in culture (Figure 6A-C). In contrast, the levels of mitochondrial respiration in non-activated Mem from EC were much lower and were not impacted by any of our chemical inhibitors (Figure S7). This indicated that only the elevated levels of mitochondrial respiration found in EC under activated conditions were suppressed by the inhibitors. We further confirmed that both specific gene silencing of PRKAA1 and GLS led to similar decreases of mitochondrial respiration in polyclonally activated Mem from EC (Figure S8A-C).
Figure 6.

Blocking autophagy-mediated proteolysis or glutaminolysis in EC inhibits their cellular rates of mitochondrial β-oxidation. We polyclonally activated Mem from EC in the presence or absence of PRKAA1-dependent autophagy-mediated proteolysis (BaF, E64d-PepA, and compound C) or glutaminolysis (BPTES, and R162) blockade before assessing their mitochondrial respiration. (A) Representative respiratory kinetics of Mem from EC at 6 h post-polyclonal activation when cells have been treated with or without chemical inhibitors. OCR, oxygen consumption rate. (B) SRC and (C) ATP-linked respiration were determined for all culture conditions. N = 6. The error bars indicate standard deviations from the means. β, symbol used for paired t-test (comparison between treated Mem and untreated control).
Finally, to confirm the positive impact of glutamine catabolism on the strong IL21 production during HIV-1 infection, we activated Mem from EC, ART, and HIVneg either polyclonally or HIV-1 Gag-specifically for 6 h in the presence or absence of glutaminolysis blockade (BPTES and R162) before assessing their IL21 production by flow cytometry. Our data showed that, unlike ART who displayed reduced IL21 production regardless of glutaminolysis blockade, the strong IL21 expression in EC and HIVneg was significantly reduced when BPTES and R162 were added in culture (Figure 7A,B). Once again, we confirmed in EC that specific gene silencing of PRKAA1 and GLS both resulted in decreased IL21 production in activated Mem (Figure S8D).
Figure 7.

Glutaminolysis is required to provide optimal IL21 production in Mem from EC. We polyclonally or HIV-1-specifically activated Mem from all study groups for 6 h in the presence or absence of glutaminolysis blockade (BPTES, and R162). Levels of IL21 production at 6 h of (A) polyclonal and (B) HIV-1 Gag-specific activation. Representative histograms of IL21 expression in EC were also shown on the right side for all culture conditions (polyclonal activation). N = 6. The error bars indicate standard deviations from the means. β, symbol used for paired t-test (comparison between treated Mem and untreated control). *, symbol used for Mann-Whitney test (comparison between study groups).
Overall, our data show that strong IL21 production among Mem from EC, including in HIV-1-specific cells, is potentially driven by increased PRKAA1- and autophagy-dependent glutaminolysis (Figure 8).
Figure 8.

Schematic summary of the overall autophagy-mediated proteolysis metabolic advantage dictating the strong IL21 production in HIV-1-specific Mem from EC, which confers an effective HIV-1-specific CD8A T cells response. AKG, alpha-ketoglutarate; ALs, autolysosomes; AV, autophagic vacuoles; GLUD1, glutamate dehydrogenase 1; GLS, glutaminase; TCA, tricarboxylic acid cycle; OxPhos, oxidative phosphorylation; FAO, fatty acid beta-oxidation; CPT1A, carnitine palmitoyltransferase 1A).
Stimulating PRKAA1 activity in Mem from ART rescues their autophagy-mediated mitochondrial respiration and IL21 production
Since our data on EC showed that the PRKAA1-dependent activity is critical for ensuring a strong Mem-related and autophagy-mediated proteolysis (Figures 2A,B and 8), we decided to investigate whether treating Mem from ART with the PRKAA1 activator AICAR is effective in rescuing their low autophagy proteolytic activity and intracellular glutamine/glutamate levels. Therefore, we first polyclonally activated Mem from ART, EC, and HIVneg for 6 h with or without AICAR in the presence or absence of protease inhibitors co-treatment, and then assessed their autophagy-mediated proteolysis. Our data showed that AICAR treatment of Mem from ART led to a significant enhancement of their autophagy activity in the range of EC, which was prevented when cells were co-cultured with the protease inhibitors E64d-PepA (Figure 9A). Of note, AICAR alone did not impact the autophagy activity in Mem from EC and HIVneg. We confirmed that AICAR treatment of Mem from ART also led to significant increases of both total glutamine and glutamate intracellular levels during their T cell activation, in a PRKAA1 and autophagy-dependent manner, not only with the bioluminescence assay, but also with the GC/MS approach (Figure 9B,C).
Figure 9.

Triggering the PRKAA1 with AICAR enhances autophagy-mediated proteolysis and glutamine/glutamate availability in ART. (A) Autophagy-mediated proteolysis assessed in polyclonally activated Mem for all study groups with or without the PRKAA1 activator AICAR. We also co-cultured Mem with AICAR and protease inhibitors E64d-PepA. (B) Levels of total glutamine/glutamate were determined within Mem from ART, which have been or not polyclonally activated with or without AICAR and AICAR + E64d-PepA (co-)treatments. (C) Chromatograms of extracted ion counts representing area under the curve quantification of glutamate and glutamine in polyclonally activated or not Mem, with/without AICAR or AICAR + E64d-PepA in ART patients. Of note, polyclonally activated Mem treated with AICAR only counts required 10x dilution to avoid saturating signals. N = 6. The error bars indicate standard deviations from the means. β, symbol used for paired t-test (comparison between treated Mem and untreated control). *, symbol used for Mann-Whitney test (comparison between study groups).
Our next step was to assess whether AICAR treatment of ART’s Mem culture further led to increased mitochondrial respiration in a proteolysis-dependent manner. To do so, we polyclonally activated Mem from ART with or without AICAR in the presence or absence of protease inhibitors (E64d-PepA), before evaluating their mitochondrial respiration with the Agilent metabolic flux cell analyzer. We found significant enhancement of the whole mitochondrial SRC and ATP-linked respiration in ART when AICAR was added in culture (Figure 10A-C). We also confirmed the role of the proteolysis on the AICAR-induced enhancement of mitochondrial respiration, since co-adding E6d-PepA in culture significantly decreased the benefit caused by AICAR.
Figure 10.

Triggering the PRKAA1-dependent autophagy-mediated proteolysis with AICAR in ART improves their cellular rates of mitochondrial β-oxidation and Mem-related IL21 production. (A-C) We polyclonally activated Mem from ART in the presence or absence of PRKAA1-dependent autophagy-mediated proteolysis (AICAR with or without BaF, and E64d-PepA) induction, before assessing their mitochondrial respiration. (A) Representative respiratory kinetics of Mem from ART at 6 h post-polyclonal activation when cells have been treated with or without PRKAA1-dependent autophagy-mediated proteolysis. OCR, oxygen consumption rate. (B) SRC and (C) ATP-linked respiration were determined for all culture conditions. (D) At 6 h of polyclonal and HIV-1-specific activation, we also monitored the intracellular levels of IL21 with or without AICAR and E64d-PepA treatments. N = 6. The error bars indicate standard deviations from the means. β, symbol used for paired t-test (comparison between treated Mem and untreated control). *, symbol used for Mann-Whitney test (comparison between study groups).
Finally, to confirm the positive impact of AICAR treatment on IL21 production in ART, we activated Mem from ART, EC, and HIVneg either polyclonally or HIV-1 Gag-specifically for 6 h in the presence or absence of AICAR and E64d-PepA before assessing their IL21 production by flow cytometry. Of note, we did not find any differences for IFNG expression in activated Mem regardless of study groups and treatments (Figure S9A). In contrast, our results confirmed that AICAR treatment in ART was effective in rescuing IL21 production in the range of EC and involved the autophagy proteolytic activity in the process (Figure 10D). As expected, AICAR alone had no impact on IL21 production with EC and HIVneg.
In summary, our last sets of experiments vouch for our ability to rescue both energetic input and related IL21 production in ART to levels comparable to those of EC, when the PRKAA1 activity is chemically induced during culture.
Discussion
How do EC do what they do? This is the million-dollar question. In fact, understanding the mechanisms associated with natural control of HIV-1 infection is the first step toward improving the current treatment and/or achieving antiretroviral therapy termination [8,9,32]. EC are therefore important for the identification of long-term antiviral protective mechanisms that could then potentially be reproduced for treatment strategies. In this regard, previous observations confirm that CD4 T cells, especially Mem, from EC display not only better immune function such as IL21 production, but also higher cell survival, when compared to ART.
Thanks to EC, we have previously shown that effective Mem persistence to multiple rounds of T cell activation and cell resistance to a 24 h-long FAS-induced apoptosis was permitted due to a better control of the FOXO3 pro-apoptotic activity [14]. In contrast, at 6 h post-activation, we did not find any differences in apoptosis levels among Mem between EC and ART, regardless of the activation type (Figure S1D,E). However, it also is acknowledged that the progressive loss of Mem during chronic HIV-1 infection is not attributed to apoptosis alone, but may also involve other death-related mechanisms such as pyroptosis. Pyroptosis is a highly inflammatory mode of regulated cell death, which involves the activation of CASP1 (caspase 1) and is known to be significantly decreased, but not fully suppressed, following ART when compared to HIVneg control donors [33]. Although it has been recently shown no significant differences between CD4 T cells from EC and ART for CASP1 activity, it would be interesting to investigate the levels of pyroptosis in activated Mem, especially in HIV-1-specific cells, from EC and ART and, in the case of lower levels in EC, to assess if autophagy is involved in the process.
In this study, we decided to emphasize on the molecular mechanisms responsible for the strong Mem-related IL21 production during HIV-1 infection, which is only found in EC and not fully restored by current treatments [11,12,29,34]. In fact, a large body of literature confirm that IL21 is a potent immune mediator against HIV-1 endowed with pleotropic effects on antiviral immunity. We, and others, have shown that IL21 enhances the cytotoxic activity of HIV-1-specific CD8A T cell by inducing their lipid catabolism and mitochondrial respiration [23,35–38]. Aside from potentiating HIV-1-specific CD8A T cell immunity and metabolism, IL21 can also enhance virus-specific antibody responses [11], and natural killer cell survival [39] in infected patients. By using specific FOXO3 gene silencing, we found no impact of FOXO3 protein decrease, regardless of study group, on both Mem survival and IL21 production at 6 h of polyclonal or HIV-1-specific activation (Figure S10). Instead, when considering the strong IL21 production in EC, our data revealed not a FOXO3-dependent, but rather autophagy- and metabolism-dependent mechanism responsible for it. In fact, our results showed that HIV-1-specific Mem from EC displayed higher expression levels of several autophagy-related proteins, high AVs and ALs numbers, and increased autophagy-mediated proteolysis activity when compared to ART (Figure 1A-E). We further confirmed that the strong IL21 production in EC was driven by the autophagy-mediated proteolysis and involved PRKAA1 control in the process (Figure 3). Altogether, our first set of data revealed a cell-intrinsic role for MTOR-independent and PRKAA1-dependent autophagy in ensuring strong Mem responses in EC (Figure 8).
Our study differs from the others, since autophagy has usually been investigated in HIV-1 infection as a type of selective lytic process that targets the virus, referred to as xenophagy [22,40,41]. In fact, the rationale for comparing EC to ART, which maintain undetectable viral loads for years, and conducting all of ART’s cultures with AZT is to focus on the host mechanisms and eliminate the side effects that could be caused by high viremia and viral protein production [9]. Several HIV-1 proteins, which are produced in ART-free patients, can inhibit by themselves the final stage of autophagy to prevent viral degradation [42]. Herein, we showed that highly IL21 expressing HIV-1-specific Mem in EC were driven by autophagy-mediated proteolysis, whose catabolic process of endogenous proteins has never been addressed in HIV-1 infection before in the context of host immune protection.
In this context, our next sets of experiments confirmed that autophagy-mediated proteolysis represents a new energetic process by which IL21-secreting Mem from EC, including those specific to HIV-1, support mitochondrial respiration and energy production through glutaminolysis (Figures 6 and 7). Although all Mem treatments with chemical inhibitors led to significant reductions of EC’s mitochondrial respiration, those found with glutaminolysis blockade (BPTES and R162) were less pronounced in comparison to the ones when PRKAA1-dependent and autophagy-mediated proteolysis was prevented in culture (BaF, E64d-PepA, and compound C) (Figure 6). These results indicate that, during T cell activation, Mem from EC may use lytic autophagy activity not only to provide free glutamine, but also other essential amino-acids such as serine, alanine and arginine to fuel their energetic mitochondrial input [43–47] (Figure 8). In addition to IL21 production, it would be interesting to investigate whether similar molecular and catabolic mechanisms could also be used by EC to ensure additional CD4 T cell-related correlates of immune protection against HIV-1. These include Mem cytotoxic activity, IL2 (interleukin 2) production, cell polyfunctionality (i.e. ability to produce multiple cytokines and cytotoxic molecules) and Gag antigen avidity [48–52].
Finally, our data provide the rationale for considering the PRKAA1 activity/autophagy-mediated proteolysis/glutaminolysis axis as a therapeutic target for boosting specific immune responses against HIV-1 among ART (Figure 8). Interestingly, our last sets of results collected on ART confirm our ability to enhance their autophagy-mediated proteolytic activity along with IL21 production with the PRKAA1 activator AICAR (Figures 9A and 10D). Aside from directly targeting PRKAA1 activity with AICAR, improvements of anti-HIV-1 Mem responses among ART could be achieved with cytokine-based immunotherapy combined with medically induced HIV-1 suppression. Indeed, it has been shown that the common gamma-chain cytokine signaling is required for optimal autophagy induction during CD4 T cell activation [18]. This cytokine family has several critical cytokines such as IL2 and IL21, known to potentiate HIV-1-specific CD4 T cell function [53,54]. Although IL2 has been proposed as a potential immune modulator to reverse HIV-specific CD4 T cell dysfunction in HIV-1-infected patients [53–55], this cytokine negatively impacts peripheral CD4 T-follicular cell function and anti-HIV-1 antibody production in EC [11]. Taking this into account, it may be plausible that the overall IL2-based immunotherapy in ART may be ineffective in enhancing IL21 production. It may be interesting to rather focus on IL21 itself for Mem enhancement in ART, since IL21 not only promotes CD4 T cell survival and effector function during HIV-1 infection [12,29,56], but also cell-intrinsic resistance to HIV-1 de novo infection [57]. In fact, our preliminary data seemed to confirm that the addition of recombinant IL21 in ART’s culture led to significant improvements of their Mem-related mitochondrial respiration (Figure S9B,C).
To conclude, we are only beginning to appreciate the extent to which cytoplasmic autophagy and mitochondria work together as a fundamental catabolic process by which T cells, including Mem, regulate their energetic metabolism, thereby controlling a proper and protective antigen-specific immune response. Emerging evidence, including ours, show that the regulation of T cell metabolism is context-dependent and can be autophagy-dependent under certain stressful conditions such as a persistent HIV-1 infection. In fact, our results confirm for the first time that EC, who maintain the strongest IL21 expressing and anti-HIV-1 Mem among all study groups of infected patients, display the highest use of mitochondrial respiration via glutaminolysis in those same cells.
Methods
Study groups and ethics statement
The experiments described in this study mainly rely on the comparison of Mem features between naturally HIV-1 protected EC and patients under antiretroviral therapy (ART). Of note, EC are unique patients displaying a long-term viral control and strong anti-HIV-1 immunity without any medical intervention. All virus-infected patients were participants of the Montreal HIV infection study that received approval from the McGill University Health Center Ethical Review Board (ethic reference number SL-00.069). All subjects provided an informed and written consent for participation. The inclusion criteria of untreated EC and ART are: middle-aged subjects (31–45 years old), presumed to have HIV-1 infection for a minimum of 3.4 years (3.4–9.8 years), no protective gene polymorphisms such as CCR5 Δ32, with CD4 counts over 400 cells/μl in blood and undetectable viral loads (< 50 copies/ml) for 2.8 years or more. We also selected 6 age-matched and HIV-1-uninfected subjects as controls of non-infection. All clinical information regarding EC and ART including their Mem counts are summarized in Table S1.
Media and products
RPMI-1640 (Wisent, 350–000-EL), DMEM (Wisent, 319–005-CL), FBS (Wisent, 080–450), penicillin-streptomycin antibiotics (Wisent, 450–201-EL), and PBS (Wisent, 311–010-CL) were obtained from Wisent Inc. All monoclonal antibody used for multi-parameter and Imaging flow cytometry such as anti-CD3W/CD3 (BD Biosciences, 557943), anti-CD4 (BD Biosciences, 560346) and anti-CD45RA (BD Biosciences, 561212) were purchased in BD Biosciences, except for those against ULK1 (Santa Cruz Biotechnology, sc-390904; PE) and ATG7 (Santa Cruz Biotechnology, sc-376,212; AF488), total MTOR (ThermoFisher, 12–9718-42) and p-S2448 MTOR (ThermoFisher, 215Q18), BECN1 (Abcam, ab246760), and SQSTM1 (MBL Life Sciences, M162-A48). Lysosomal protease inhibitors bafilomycin A1 (BaF; Sigma Aldrich, B1793) and chloroquine (Chloro.; Sigma Aldrich, C6628), E64d (Sigma Aldrich, E8640-250UG) and pepstatin A (PepA; Sigma Aldrich, P5318-5MG), PRKAA1 inhibitor (compound C; Sigma Aldrich, 171260–1 MG), GLS inhibitor (BPTES; Sigma Aldrich, SML0601-5 MG), GLUD1/glutamate dehydrogenase 1 inhibitor (R162; Sigma Aldrich, 5380980001), and recombinant IL21 (Sigma Aldrich, SRP3087) were all provided from Sigma Aldrich. The PRKAA1 activator AICAR (Sigma Aldrich, A9978-5 MG) also came from Sigma Aldrich. The primary antibodies against FOXO3 (Cell Signaling Technology, 12829S), total PRKAA1 (Cell Signaling Technology, 2532S) and p-Thr172 PRKAA1 (Cell Signaling Technology, 2531S), and ACTB/β-actin (Cell Signaling Technology, 4967S) used in western blots came from Cell Signaling Technology. The culture concentrations for bafilomycin A1, chloroquine, E64d-PepA, compound C, AICAR, BPTES, R162 and IL21 were 10 ng/mL, 10 ng/mL, 2 μg/mL, 10 μM, 50 μM, 30 μM, 30 μM and 10 ng/mL, respectively.
Purification of Mem
Mem were purified using the untouched memory CD4 isolation kit (EasySep human memory CD4+ T cell Enrichment Kit; StemCell Technologies, 19157) allowing for more than 94.6% purification without any cell stimulation and apoptosis [58].
Activation methods
PBMC and purified Mem for all study groups were either polyclonally or HIV-1 Gag-specifically activated for 6 h with GolgiPlug (BD Biosciences, 555029) and GolgiStop (BD Biosciences, 554724) and in the presence or absence of chemical inhibitors. For the polyclonal activation, we treated cells with 0.5 μg/mL of anti-CD3W (BioLegend, 317326) and of 1 μg/mL anti-CD28 Abs (BD Biosciences, 555726). To elicit the HIV-1-specific activations, we used 5 μg/mL of HIV-1 p55 (Austral Biologicals, HI1A-730-5) and p24 Gag antigens (Austral Biologicals, HI1A-720-5) with 1 μg/mL of anti-CD28 Abs on PBMC [58]. Of note, all cultures from ART were conducted with 10 μM of AZT (Sigma Aldrich, A2169-25 MG) to prevent any de novo viral production (confirmed by the sensitive Abcam HIV-1 p24 ELISA (Abcam, ab218268) in culture supernatants).
Specific gene silencing using siRNA
We first purified 107 Mem from all tested groups and electroporated them using Nucleofector II technology according to the Amaxa Biosystems manufactor’s protocol. Specific siRNA for FOXO3 (ThermoFisher Scientific, siRNA ID: 115208), for BECN1 (ThermoFisher Scientific, siRNA IDs: 137198 [siRNA 1] and 137200 [siRNA 2]), for PRKAA1 (ThermoFisher Scientific, siRNA IDs: 143192 [siRNA 1] and 143193 [siRNA 2]), for GLS (ThermoFisher, siRNA IDs: 145342 [siRNA 1] and 145344 [siRNA 2]) and their negative control siRNA (ThermoFisher Scientific, 4390843) were all obtained from ThermoFisher Scientific. Of note, 5 μg of siRNA were transfected or not for 2 h without antibiotics. Purified Mem were washed three times thereafter, to remove dead necrotic cells, counted and incubated for 48 h (for FOXO3 silencing) or 24 h (for BECN1, PRKAA1 and GLS silencing) with autologous CD4-depleted PBMC (at ratio Mem/PBMC = 1⁄4 [58]). The efficacy of protein decrease and levels of cell apoptosis in Mem were determined by western blotting and flow cytometry for FOXO3, PRKAA1, GLS, and BECN1 respectively. Ultimately, we activated cells for an additional 6 h to assess both autophagy, mitochondrial respiration and effector function in transfected Mem.
Multi-parameter flow cytometry
Table 1 shows the multi-parameter antibody cocktails that we developed in our study. a. Intracellular staining. To assess the expression levels of autophagy-related genes, total MTOR, anti-IFNG/IFN-γ-AF647 (BD Biosciences, 563495) and IL21 cytokine (BD Biosciences, 560463), we subjected cells to intracellular staining assays as previously described [58]. Briefly, after surface staining with specific antibodies for Mem phenotyping, we fixed and then permeabilized cells with 0.25% saponin (Sigma Aldrich, 47036) before the intracellular staining per se. After three washes, stained cells were finally ready for flow cytometry analyses. The viability marker 7-aminoactinomycin D or 7-AAD (ThermoFisher Scientific, 00–6993-50) was used to exclude dead cells from analyses. Of note, to assess the cumulative expression of the autophagy-related SQSTM1 protein cargo during the 6 h-long cultures, lysosomal inhibitor BaF was added in our cultured cells. b. PhosFlow assays. PhosFlow assays were performed to assess the intracellular expression levels of MTOR p-S2448 and EIF4EBP1 p-Thr36/45 (ThermoFisher Scientific, 12–9107-42) in activated Mem. Briefly, cellular fixation was done using 4% PFA for 10 min at 36°C followed by surface staining for 10 min at 4°C. Afterward, the cellular permeabilization was done using 90% ice cold methanol for 30 min at 4°C followed by 30 min of intracellular staining in PBS + 2% FBS at room temperature. The viability marker 7-AAD was also used to exclude dead cells from analyses. c. Data analyses. BD LSRII Fortessa flow cytometer (BD) was used to collect the data which were analyzed using the DIVA software. 200,000–500,000 gated cells were analyzed for each sample.
Table 1.
Antibodies used
|
Multi-parameter antibodie coktails developed. |
|||||
|---|---|---|---|---|---|
|
a. For the autophagy assessment |
|||||
| Immunogen | clone ID | fluorophore | Catalog number | vendor | |
| Surface | CD3W | UCHT-1 | Alexa Fluor 700 | 557943 | BD Biosciences |
| CD4 | RPA-T8 | V450 | 560346 | BD Biosciences | |
| CD45RA | RPA-T4 | APC H7 | 561212 | BD Biosciences | |
| IC | ULK1 | F-4 | PE | sc-390904 | Santa Cruz Biotechnology |
| BECN1 | EPR 20473 | Alexa Fluor 647 | ab246760 | Abcam | |
| ATG7 | B-9 | Alexa 488 | sc-376212 | Santa Cruz Biotechnology | |
| Immunogen | clone ID | fluorophore | Catalog number | vendor | |
| Surface | CD3W | UCHT-1 | Alexa Fluor 700 | 557943 | BD Biosciences |
| CD4 | RPA-T8 | V450 | 560346 | BD Biosciences | |
| CD45RA | RPA-T4 | APC H7 | 561212 | BD Biosciences | |
| IC | SQSTM1 | 5F2 | Alexa Fluor 488 | M162-A48 | MBL Life Sciences |
| b. For MTOR assessment | |||||
| (i) | Immunogen | clone ID | fluorophore | Catalog number | vendor |
| Surface | CD3W | UCHT-1 | Alexa Fluor 700 | 557943 | BD Biosciences |
| CD4 | RPA-T8 | V450 | 560346 | BD Biosciences | |
| CD45RA | RPA-T4 | APC H7 | 561212 | BD Biosciences | |
| IC | MTOR p-S2448 | MRRBY | PE | 215Q18 | Invitrogen (ThermoFisher) |
| Total MTOR | EPR 20473 | unconjugated* | 12–9718-42 | Invitrogen (ThermoFisher) | |
| *Abs were conjugated to AlexaFluor 647dye using the Zenon mouse IgG1 labeling kit (ThermoFisher Scientific, Z25008) | |||||
| (ii) | Immunogen | clone ID | fluorophore | Catalog number | vendor |
| Surface | CD3W | UCHT-1 | Alexa Fluor 700 | 557943 | BD Biosciences |
| CD4 | RPA-T8 | V450 | 560346 | BD Biosciences | |
| CD45RA | RPA-T4 | APC H7 | 561212 | BD Biosciences | |
| IC | EIF4BP1 p-Thr36/45 | V3NTY24 | PE | 12–9107-42 | Invitrogen (ThermoFisher) |
| c. For the immune function assessment | |||||
| Immunogen | clone ID | fluorophore | Catalog number | vendor | |
| Surface | CD3W | UCHT-1 | Alexa Fluor 700 | 557943 | BD Biosciences |
| CD4 | RPA-T8 | V450 | 560346 | BD Biosciences | |
| CD45RA | RPA-T4 | APC H7 | 561212 | BD Biosciences | |
| IC | IFNG | 4S.B3 | Alexa Fluor 647 | 563495 | BD Biosciences |
| IL21 | 3A3-N2 | PE | 560463 | BD Biosciences | |
Electron microscopy
Electron microscopy analysis was done as previously reported [22], but with a few modifications. Briefly, we first polyclonally activated 106 purified Mem for 6 h and then fixed them overnight at 4°C with 2.5% glutaraldehyde (Mecalab, 1206) in 0.05 M cacodylate buffer (pH 7.4). Cells were thereafter rinsed, post-fixated in 1.3% osmium tetroxide (Mecalab, 1605) in collidine buffer (pH 7.4), dehydrated, and embedded in two successive baths of SPURR (TedPella, 18300–4221). Grids were rinsed in distilled water, stained with aqueous 2% uranyl acetate for 15 min and finally photographed with a Hitachi H-7100 electron microscope fitted with an AMT XR111 camera (Hitachi High-Tech America Inc.). A number of 24 cells per slide were observed (Table S2). We calculated the total numbers of autophagic vacuoles (AVs) and autolysosomes (ALs) per Mem by using different magnifications. We included representative micrographs showing the visual differences between AV and AL structures (Figure S3A). Of note, AVs were identified as a double-membrane-structure containing undigested cytoplasmic material, ALs were characterized by the autophagic vacuoles limited by a single membrane.
Autophagy-mediated proteolysis assays
Autophagy-dependent lytic degradation of long-lived proteins in 106 purified Mem was quantified as previously described [59]. The method is based on a pulse-chase approach, whereby cellular proteins are radiolabeled by [14C] valine (PerkinElmer, NEC291EU050UC). Briefly, 106 purified Mem were seeded and incubated for 18 h in complete RPMI with 0.2µCi/ml of L-[14C] valine in order to label intracellular proteins (Pulse media). Cells were then washed three times with PBS to eliminate any unincorporated radioactivity. The short-lived proteins are allowed to be degraded for 24 h in fresh RPMI (Chase media). After that, cells were polyclonally activated for 6 h in the presence or absence of chemical inhibitors, and then seeded in 10% of trichloroacetic acid (TCA) containing RPMI overnight. After centrifugation, precipitated cells were washed twice with cold 10% TCA RPMI and dissolved in 0.2 M NaOH for 2 h. Of note, the supernatants contained the acid-soluble radioactivity fraction. Radioactivity was finally quantified by liquid scintillation counting. The rate of autophagy-dependent degradation of long-lived proteins was calculated from the ratio of the acid-soluble radioactivity in the medium to the one in the acid-precipitable cell fraction.
Imaging flow cytometry
We have recently developed a high throughput and statistically robust technique that quantitates lipophagy in primary human T cells including starved hepatic Huh7.5 cells as experimental control [23]. The principle of this method consists in measuring the accumulation of lipid contents in ALs when cultures were performed with the lysosomal inhibitor BaF. This culture condition was referred as the “cumulative state” and compared to the BaF-free “steady-state” condition. At 6 h post-activation with or without BaF, cells were collected and co-stained with Lyso-ID green dye (Enzo Life Sciences, ENZ-51005) and the HCS LipidTox deep red neutral lipid dye (ThermoFisher Scientific, H34477) according to the manufacturer’s instructions. Anti-CD3W-APC H7 (BD Biosciences, 560176), anti-CD45RA-ECD (Beckman Coulter, IM2711U) and anti-CD4-PE (BD Biosciences, 555347) monoclonal antibodies were used for surface staining. Data analyses. Samples were acquired using the Image Stream X MKII flow cytometer and analyzed with IDEAS software (Amnis). 200,000–500,000 gated cell singlets were analyzed for each sample. Results were expressed as co-localization index BDS (for bright detail similarity) between the lysosomal dye Lyso-ID and the other fluorescently labeled marker of interest. We determined the lipophagy activity by the formula: (% of BDShigh Lyso-ID+ LipidTox+ cells with BaF) – (% of BDShigh Lyso-ID+ LipidTox+ cells without BaF).
Intracellular levels of total glutamine/glutamate
In order to measure the intracellular concentrations of total glutamine and glutamate, we used a bioluminescence-based assay Glutamine/Glutamate-Glo assay kit (Promega, J8021). Briefly, Mem from each of the study groups were polyclonally activated with or without inhibitors (BaF, E64d-PepA, compound C, and BPTES), or AICAR for 6 h in the presence of GolgiPlug/GolgiStop. Following the manufacturer protocol, cells were then washed with PBS and lysed with the inactivation solution (0.6 N HCl) followed by a neutralization solution (1 M Tris Base). An equivalent of 15.104 Mem per well were plated in clear bottom 96-well plate (in duplicate). GLS reagent was added in wells to measure the total converted glutamine levels, whereas adding GLS buffer only on wells to measure total glutamate only. Glutamate detection reagent was then added in all wells. The principal of the assay is based on the conversion of glutamine to glutamate by GLS. Afterward, glutamate dehydrogenase catalyzes the oxidation of glutamate with concomitant reduction of NAD+ to NADH. In the presence of NADH, Reductase enzymatically reduces a pro-luciferin Reductase Substrate to luciferin. Luciferin is detected in a luciferase reaction using Ultra-Glo™ Luciferase and ATP, and the amount of light produced is proportional to the amount of glutamate presented within the Mem lysate. The luminescent signal was measured by Cytation™ 5 Cell Imaging Multi-Mode Reader (Biotek). All values were normalized to control PBS only. To determine the intracellular levels for both total glutamine and glutamate, we followed the manusfacturer’s instruction.
Metabolomics: gas chromatography/mass spectrometry (GC/MS)
Glutamine and glutamate measurements were performed using GC/MS. (1 x 10⁶) Mem were gently centrifuged at 21,000 x g and spent media collected for Nova Bioprofil analysis. The cells were rinsed three times with ice-cold normal saline solution 0.9% (Sigma-Aldrich, S8776-100ML), after centrifugation, supernatant was removed and discarded. Metabolism was then quenched with 80% HPLC-grade methanol (−20°C). Samples were then sonicated to ensure lysis followed by centrifugation for 10 min at 1°C and 21,000 x g. The supernatants were transferred to fresh tubes containing 800 ng of 2H27-myristic acid (CDN isotopes Inc., D-1711) retention time locking and quality control internal standard. Samples were dried in a temperature-controlled vacuum centrifuge with sample temperature maintained at −4°C (Labconco). Dried extracts were solubilized in 15 μl of methoyxamine-HCl (Sigma-Aldrich, 226904) freshly prepared 10 mg/mL in pyridine (Sigma-Aldrich, 270970), incubated at room temperature for 1 h followed by derivatization with 35 μl N-tert-butyldimethylsilyl-N-methyltrifluoroacetamide (MTBSTFA; Sigma-Aldrich, 394882) at 70°C for 1 h.
Immediately after derivatization, samples were subjected to GC/MS analysis. A volume of 1 μL per sample was injected into an Agilent 5975 C GC/MS equipped with a DB-5 MS+DG (30 m x 250 µm x 0.25 µm) capillary column (Agilent J&W, 122–5532 G). Data were collected in both scan (50–1000 m/z) and in single ion monitoring (5 ms well time per ion) where the M-57 ion, [M+•-C4H9•]+, 432 and 431 for glutamate (retention time 19.711 min) and glutamine (retention time 20.987 min) respectively. Compound spectra and retention times were validated using authentic standards. The extracted ion chromatogram was used for area under the curve quantification using Mass Hunter Quant (Agilent Technologies). Polyclonally activated Mem (Except for ART samples) and those of ART samples co-treated with AICAR, required 1:9 dilution due to saturating signals. Other treatment samples were not diluted due to their comparatively low levels of glutamine and glutamate. Dilution of these samples would have resulted in signals below our detection limit. Results shown in Supplementary materials represent the relative levels of extraction ion counts of glutamine and glutamate. Relative ion counts % levels were determined by normalizing the highest ion counts value of glutamine (Activated Mem from EC) and glutamate (Activated + AICAR Mem from ART), and then calculated as follows: (ion counts value glutamine/glutamate/highest ion counts value glutamine/glutamate) x 100.
Evaluation of mitochondrial respiration
At 6 h post-polyclonal activation or not, and with or without chemical inhibitors (BaF, E64d-PepA, compound C, AICAR, BPTES and R162) or recombinant IL21, we assessed the overall mitochondrial respiration in purified Mem from EC and ART using a Seahorse XF96 metabolic analyzer and the XF Cell Mito Stress Test kit. Briefly, 4.105 activated Mem per culture condition were seeded on XF96 well plates (Agilent Technologies, 102601–100) in complemented Agilent RPMI with glucose 10 mM, glutamine 2 mM and pyruvate 1 mM (Agilent Technologies, 103576–100). Of note, the XF Cell Mito Stress test kit was used strictly according to manufacturer protocol. The oxygen consumption rates (OCR) were determined under basal conditions and in response to modulators of respiration that were injected during the assay to reveal key parameters of mitochondrial functions. The modulators included in this assay were oligomycin (Agilent Technologies, 103015–100), carbonyl cyanide 4-(trifluoromethoxy) phenylhydrazone (FCCP; Agilent Technologies, 103015–100), rotenone (Agilent Technologies, 103015–100) and antimycin A (Agilent Technologies, 103015–100; 1.5 µM, 2 µM and 0.5 µM, respectively). We determined the spare respiratory capacity (SRC) and ATP-linked respiration for each culture condition as follows: [(maximal OCR determined after FCCP treatment) – (basal OCR determined before oligomycin treatment)] and [(basal OCR) – (minimal OCR determined after Rotenone and Antimycin A treatment)], respectively. All values were finally normalized to the number of viable cell events per seeded well thanks to the CytoFLEX benchtop flow cytometer (Beckman Coulter).
Statistical analysis
In the study, we systematically used the non-parametric Mann-Whitney U test that assumes independent samples for all statistical analyses between those groups (* symbol). A sample size of 6 subjects per study group was sufficient to achieve a significant statistical power based on the observed changes. Statistical analyses between two different in vitro conditions were performed using two-sided Student’s paired t-test (β symbol). P values of less than 0.05 were considered significant. One symbol, 0.05 > P > 0.01; two symbols, 0.01 > P > 0.001; three symbols, 0.001 > P > 0.0001; and four symbols, P < 0.0001.
Supplementary Material
Acknowledgments
We are grateful to all subjects participating in this study, their physicians, and attending staff members from the Réseau SIDA/Maladies Infectieuses of the Fonds de la Recherche Québec-Santé (FRQ-S; Montreal, QC, Canada). We thank Danica Albert, Angie Massicotte, Natacha Cotta-Grand, and Mario Legault for technical and administrative assistance. We also thank Roxann Hétu-Arbour (M.Sc.) and Arnaldo Nakamura (M.Sc.) for technical support in Imaging flow cytometry and electron microscopy, respectively. We thank Dr. Ian Gaël Rodrigue-Gervais and his master’s student Claudia Gilbert for sharing some of their materials and technical assistance. We also thank the Armand-Frappier foundation for providing funds requested for the purchase of the Agilent Seahorse XF96 flux analyzer. In the contest of GC/MS approach, the Metabolomics Innovation Resource gratefully acknowledges support from the Terry Fox Research Institute, Quebec Breast Cancer Foundation, Fraser Family fund, the Rosalind and Morris Goodman Cancer Center and McGill University. The present study was conducted with research funds from the Fonds de Recherche du Québec-Santé (FRQ-S) and Natural Sciences and Engineering Research Council of Canada (RGPIN-2018-05272). Funders had no role in study design, data collection and interpretation, or the decision to submit the work for publication.
Funding Statement
This work was supported by the Fonds de Recherche du Québec - Santé [Appel d’offres Réseau SidaMI 2019-2020]; Canadian Network for Research and Innovation in Machining Technology, Natural Sciences and Engineering Research Council of Canada (CA) [RGPIN-2018-05272].
Disclosure statement
No potential conflict of interest was reported by the author(s).
Supplementary material
Supplemental data for this article can be accessed here
References
- [1].Boucher CA, Bobkova MR, Geretti AM, et al. State of the art in HIV drug resistance: science and technology knowledge gap. AIDS Rev. 2018;20(1):27–42. [PubMed] [Google Scholar]
- [2].Dube MP, Sattler FR.. Inflammation and complications of HIV disease. J Infect Dis. 2010;201(12):1783–1785. [DOI] [PubMed] [Google Scholar]
- [3].Warriner AH, Burkholder GA, Overton ET.. HIV-related metabolic comorbidities in the current ART era. Infect Dis Clin North Am. 2014;28(3):457–476. [DOI] [PubMed] [Google Scholar]
- [4].Davenport MP, Khoury DS, Cromer D, et al. Functional cure of HIV: the scale of the challenge. Nat Rev Immunol. 2019;19(1):45–54. [DOI] [PubMed] [Google Scholar]
- [5].Fonseca SG, Procopio FA, Goulet JP, et al. Unique features of memory T cells in HIV elite controllers: a systems biology perspective. Curr Opin HIV AIDS. 2011;6(3):188–196. [DOI] [PubMed] [Google Scholar]
- [6].Gonzalo-Gil E, Ikediobi U, Sutton RE. Mechanisms of virologic control and clinical characteristics of HIV+ Elite/Viremic controllers. Yale J Biol Med. 2017;90(2):245–259. [PMC free article] [PubMed] [Google Scholar]
- [7].Casado C, Galvez C, Pernas M, et al. Permanent control of HIV-1 pathogenesis in exceptional elite controllers: a model of spontaneous cure. Sci Rep. 2020;10(1):1902. [DOI] [PMC free article] [PubMed] [Google Scholar]
- [8].Lopez-Galindez C, Pernas M, Casado C, et al. Elite controllers and lessons learned for HIV-1 cure. Curr Opin Virol. 2019;38:31–36. [DOI] [PubMed] [Google Scholar]
- [9].Loucif H, Gouard S, Dagenais-Lussier X, et al. Deciphering natural control of HIV-1: a valuable strategy to achieve antiretroviral therapy termination. Cytokine Growth Factor Rev. 2018;40:90–98. [DOI] [PubMed] [Google Scholar]
- [10].Buranapraditkun S, Pissani F, Teigler JE, et al. Preservation of peripheral T follicular helper cell function in HIV controllers. J Virol. 2017;91(14). DOI: 10.1128/JVI.00497-17 [DOI] [PMC free article] [PubMed] [Google Scholar]
- [11].Cubas R, Van Grevenynghe J, Wills S, et al. Reversible reprogramming of circulating memory T follicular helper cell function during chronic HIV infection. J Immunol. 2015;195(12):5625–5636. [DOI] [PMC free article] [PubMed] [Google Scholar]
- [12].Iannello A, Boulassel MR, Samarani S, et al. Dynamics and consequences of IL-21 production in HIV-infected individuals: a longitudinal and cross-sectional study. J Immunol. 2010;184(1):114–126. [DOI] [PubMed] [Google Scholar]
- [13].Owen RE, Heitman JW, Hirschkorn DF, et al. N.C.f.H.A.V. Immunology, HIV+ elite controllers have low HIV-specific T-cell activation yet maintain strong, polyfunctional T-cell responses. AIDS. 2010;24(8):1095–1105. [DOI] [PMC free article] [PubMed] [Google Scholar]
- [14].Van Grevenynghe J, Procopio FA, He Z, et al. Transcription factor FOXO3a controls the persistence of memory CD4(+) T cells during HIV infection. Nat Med. 2008;14(3):266–274. [DOI] [PubMed] [Google Scholar]
- [15].Riffelmacher T, Richter FC, Simon AK. Autophagy dictates metabolism and differentiation of inflammatory immune cells. Autophagy. 2018;14(2):199–206. [DOI] [PMC free article] [PubMed] [Google Scholar]
- [16].Rocchi A, He C. Emerging roles of autophagy in metabolism and metabolic disorders. Front Biol (Beijing). 2015;10(2):154–164. [DOI] [PMC free article] [PubMed] [Google Scholar]
- [17].Ryter SW, Bhatia D, Choi ME. Autophagy: a lysosome-dependent process with implications in cellular redox homeostasis and human disease. Antioxid Redox Signal. 2019;30(1):138–159. [DOI] [PMC free article] [PubMed] [Google Scholar]
- [18].Botbol Y, Patel B, Macian F. Common gamma-chain cytokine signaling is required for macroautophagy induction during CD4+ T-cell activation. Autophagy. 2015;11(10):1864–1877. [DOI] [PMC free article] [PubMed] [Google Scholar]
- [19].Hubbard VM, Valdor R, Patel B, et al. Macroautophagy regulates energy metabolism during effector T cell activation. J Immunol. 2010;185(12):7349–7357. [DOI] [PMC free article] [PubMed] [Google Scholar]
- [20].Jacquin E, Apetoh L. Cell-intrinsic roles for autophagy in modulating CD4 T cell functions. Front Immunol. 2018;9:1023. [DOI] [PMC free article] [PubMed] [Google Scholar]
- [21].Murera D, Arbogast F, Arnold J, et al. CD4 T cell autophagy is integral to memory maintenance. Sci Rep. 2018;8(1):5951. [DOI] [PMC free article] [PubMed] [Google Scholar]
- [22].Nardacci R, Amendola A, Ciccosanti F, et al. Autophagy plays an important role in the containment of HIV-1 in nonprogressor-infected patients. Autophagy. 2014;10(7):1167–1178. [DOI] [PMC free article] [PubMed] [Google Scholar]
- [23].Loucif H, Dagenais-Lussier X, Beji C, et al. Lipophagy confers a key metabolic advantage that ensures protective CD8 T-cell responses against HIV-1. Autophagy. 2021;18:1–16. [DOI] [PMC free article] [PubMed] [Google Scholar]
- [24].Dowling SD, Macian F. Autophagy and T cell metabolism. Cancer Lett. 2018;419:20–26. [DOI] [PMC free article] [PubMed] [Google Scholar]
- [25].Parzych KR, Klionsky DJ. An overview of autophagy: morphology, mechanism, and regulation. Antioxid Redox Signal. 2014;20(3):460–473. [DOI] [PMC free article] [PubMed] [Google Scholar]
- [26].Kim J, Kundu M, Viollet B, et al. AMPK and mTOR regulate autophagy through direct phosphorylation of Ulk1. Nat Cell Biol. 2011;13(2):132–141. [DOI] [PMC free article] [PubMed] [Google Scholar]
- [27].Dunlop EA, Tee AR. mTOR and autophagy: a dynamic relationship governed by nutrients and energy. Semin Cell Dev Biol. 2014;36:121–129. [DOI] [PubMed] [Google Scholar]
- [28].Tamas P, Hawley SA, Clarke RG, et al. Regulation of the energy sensor AMP-activated protein kinase by antigen receptor and Ca2+ in T lymphocytes. J Exp Med. 2006;203(7):1665–1670. [DOI] [PMC free article] [PubMed] [Google Scholar]
- [29].Iannello A, Tremblay C, Routy JP, et al. Decreased levels of circulating IL-21 in HIV-infected AIDS patients: correlation with CD4+ T-cell counts. Viral Immunol. 2008;21(3):385–388. [DOI] [PubMed] [Google Scholar]
- [30].Araujo L, Khim P, Mkhikian H, et al. Glycolysis and glutaminolysis cooperatively control T cell function by limiting metabolite supply to N-glycosylation. Elife. 2017;6. DOI: 10.7554/eLife.21330 [DOI] [PMC free article] [PubMed] [Google Scholar]
- [31].Shyer JA, Flavell RA, Bailis W. Metabolic signaling in T cells. Cell Res. 2020;30(8):649–659. [DOI] [PMC free article] [PubMed] [Google Scholar]
- [32].Saag M, Deeks SG. How do HIV elite controllers do what they do? Clin Infect Dis. 2010;51(2):239–241. [DOI] [PubMed] [Google Scholar]
- [33].Zhang C, Song JW, Huang HH, et al. NLRP3 inflammasome induces CD4+ T cell loss in chronically HIV-1-infected patients. J Clin Invest. 2021;131(6). DOI: 10.1172/JCI138861 [DOI] [PMC free article] [PubMed] [Google Scholar]
- [34].Williams LD, Bansal A, Sabbaj S, et al. Interleukin-21-producing HIV-1-specific CD8 T cells are preferentially seen in elite controllers. J Virol. 2011;85(5):2316–2324. [DOI] [PMC free article] [PubMed] [Google Scholar]
- [35].Chevalier MF, Julg B, Pyo A, et al. HIV-1-specific interleukin-21+ CD4+ T cell responses contribute to durable viral control through the modulation of HIV-specific CD8+ T cell function. J Virol. 2011;85(2):733–741. [DOI] [PMC free article] [PubMed] [Google Scholar]
- [36].Mendez-Lagares G, Lu D, Merriam D, et al. IL-21 therapy controls immune activation and maintains antiviral CD8(+) T cell responses in acute simian immunodeficiency virus infection. AIDS Res Hum Retroviruses. 2017;33(S1):S81–S92. [DOI] [PMC free article] [PubMed] [Google Scholar]
- [37].Wu K, Zhang S, Zhang X, et al. IL-21 expands HIV-1-specific CD8(+) T memory stem cells to suppress HIV-1 replication in vitro. J Immunol Res. 2019;2019:1801560. [DOI] [PMC free article] [PubMed] [Google Scholar]
- [38].Yi JS, Du M, Zajac AJ. A vital role for interleukin-21 in the control of a chronic viral infection. Science. 2009;324(5934):1572–1576. [DOI] [PMC free article] [PubMed] [Google Scholar]
- [39].Iannello A, Boulassel MR, Samarani S, et al. IL-21 enhances NK cell functions and survival in healthy and HIV-infected patients with minimal stimulation of viral replication. J Leukoc Biol. 2010;87(5):857–867. [DOI] [PubMed] [Google Scholar]
- [40].Nardacci R, Ciccosanti F, Marsella C, et al. Role of autophagy in HIV infection and pathogenesis. J Intern Med. 2017;281(5):422–432. [DOI] [PubMed] [Google Scholar]
- [41].Sagnier S, Daussy CF, Borel S, et al. Autophagy restricts HIV-1 infection by selectively degrading Tat in CD4+ T lymphocytes. J Virol. 2015;89(1):615–625. [DOI] [PMC free article] [PubMed] [Google Scholar]
- [42].Dinkins C, Pilli M, Kehrl JH. Roles of autophagy in HIV infection. Immunol Cell Biol. 2015;93(1):11–17. [DOI] [PubMed] [Google Scholar]
- [43].Geiger R, Rieckmann JC, Wolf T, et al. L-arginine modulates T cell metabolism and enhances survival and anti-tumor activity. Cell. 2016;167(3):829–842 e13. [DOI] [PMC free article] [PubMed] [Google Scholar]
- [44].Johnson MO, Wolf MM, Madden MZ, et al. Distinct regulation of Th17 and Th1 cell differentiation by glutaminase-dependent metabolism. Cell. 2018;175(7):1780–1795 e19. [DOI] [PMC free article] [PubMed] [Google Scholar]
- [45].Ma EH, Bantug G, Griss T, et al. Serine Is an Essential Metabolite for Effector T Cell Expansion. Cell Metab. 2017;25(2):345–357. [DOI] [PubMed] [Google Scholar]
- [46].Ron-Harel N, Ghergurovich JM, Notarangelo G, et al. T cell activation depends on extracellular alanine. Cell Rep. 2019;28(12):3011–3021 e4. [DOI] [PMC free article] [PubMed] [Google Scholar]
- [47].Ron-Harel N, Santos D, Ghergurovich JM, et al. Mitochondrial biogenesis and proteome remodeling promote one-carbon metabolism for T cell activation. Cell Metab. 2016;24(1):104–117. [DOI] [PMC free article] [PubMed] [Google Scholar]
- [48].Benati D, Galperin M, Lambotte O, et al. Public T cell receptors confer high-avidity CD4 responses to HIV controllers. J Clin Invest. 2016;126(6):2093–2108. [DOI] [PMC free article] [PubMed] [Google Scholar]
- [49].Kannanganat S, Kapogiannis BG, Ibegbu C, et al. Human immunodeficiency virus type 1 controllers but not noncontrollers maintain CD4 T cells coexpressing three cytokines. J Virol. 2007;81(21):12071–12076. [DOI] [PMC free article] [PubMed] [Google Scholar]
- [50].Phetsouphanh C, Aldridge D, Marchi E, et al. Maintenance of functional CD57+ Cytolytic CD4+ T cells in HIV+ Elite controllers. Front Immunol. 2019;10:1844. [DOI] [PMC free article] [PubMed] [Google Scholar]
- [51].Potter SJ, Lacabaratz C, Lambotte O, et al. Preserved central memory and activated effector memory CD4+ T-cell subsets in human immunodeficiency virus controllers: an ANRS EP36 study. J Virol. 2007;81(24):13904–13915. [DOI] [PMC free article] [PubMed] [Google Scholar]
- [52].Vingert B, Perez-Patrigeon S, Jeannin P, et al., A.E.H.C.S. Group . HIV controller CD4+ T cells respond to minimal amounts of Gag antigen due to high TCR avidity. PLoS Pathog. 2010;6(2):e1000780. [DOI] [PMC free article] [PubMed] [Google Scholar]
- [53].Gougeon ML, Chiodi F. Impact of gamma-chain cytokines on T cell homeostasis in HIV-1 infection: therapeutic implications. J Intern Med. 2010;267(5):502–514. [DOI] [PubMed] [Google Scholar]
- [54].Gu XX, Yue FY, Kovacs CM, et al. The role of cytokines which signal through the common gamma chain cytokine receptor in the reversal of HIV specific CD4(+) and CD8(+) T cell anergy. PLoS One. 2007;2(3):e300. [DOI] [PMC free article] [PubMed] [Google Scholar]
- [55].Nakayama-Hosoya K, Ishida T, Youngblood B, et al. Epigenetic repression of interleukin 2 expression in senescent CD4+ T cells during chronic HIV type 1 infection. J Infect Dis. 2015;211(1):28–39. [DOI] [PubMed] [Google Scholar]
- [56].Strengell M, Sareneva T, Foster D, et al. IL-21 up-regulates the expression of genes associated with innate immunity and Th1 response. J Immunol. 2002;169(7):3600–3605. [DOI] [PubMed] [Google Scholar]
- [57].Adoro S, Cubillos-Ruiz JR, Chen X, et al. IL-21 induces antiviral microRNA-29 in CD4 T cells to limit HIV-1 infection. Nat Commun. 2015;6:7562. [DOI] [PMC free article] [PubMed] [Google Scholar]
- [58].Dagenais-Lussier X, Loucif H, Cadorel H, et al., G. Montreal Primary Infection Study . USP18 is a significant driver of memory CD4 T-cell reduced viability caused by type I IFN signaling during primary HIV-1 infection. PLoS Pathog. 2019;15(10):e1008060. [DOI] [PMC free article] [PubMed] [Google Scholar]
- [59].Roberts EA, Deretic V. Autophagic proteolysis of long-lived proteins in nonliver cells. Methods Mol Biol. 2008;445:111–117. [DOI] [PubMed] [Google Scholar]
Associated Data
This section collects any data citations, data availability statements, or supplementary materials included in this article.