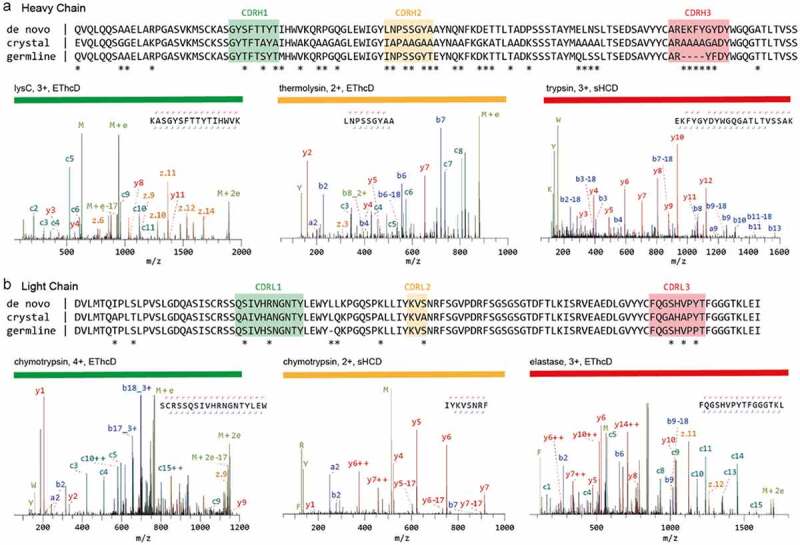
Figure 3.

Sequencing of a monoclonal Anti-FLAG M2 antibody. The variable regions of the heavy (a) and light chains (b) are shown. The de novo sequence derived by MS is shown on top, alongside the previously published sequence used in the crystal structure of the Fab (PDB ID: 2G60) and germline sequence (IMGT-DomainGapAlign; IGHV1-04/IGHJ2; IGKV1-117/IGKJ1). Differential residues are highlighted by asterisks (*). Exemplary MS/MS spectra in support of the assigned sequences are shown below the alignments, labeled with protease, precursor charge state, and fragmentation type. The peptide sequence and fragment coverage are indicated in the top-right of each spectrum spectra, with b/c ions indicated in blue/teal and y/z ions in red/orange. The same color annotation is used for peaks in the spectra, with additional peaks such as intact/charge reduced precursors, neutral losses, and immonium ions indicated in green. Figure and caption adapted from Peng et al.17
