Abstract
Objective:
Modern preclinical small animal radiation platforms utilize cone beam computerized tomography (CBCT) for image guidance and experiment planning purposes. The resolution of CBCT images is of particular importance for visualizing fine animal anatomical structures. One major cause of spatial resolution reduction is the finite size of the x-ray focal spot. In this work, we proposed a simple method to measure x-ray focal spot intensity map and a CBCT image domain deblurring model to mitigate the effect of focal spot-induced image blurring.
Approach:
We measured a projection image of a tungsten ball bearing using the flat panel detector of the CBCT platform. We built a forward blurring model of the projection image and derived the spot intensity map by deconvolving the measured projection image. Based on the measured spot intensity map, we derived a CBCT image domain blurring model for images reconstructed by the filtered backprojection algorithm. Based on this model, we computed image domain blurring kernel and improved the CBCT image resolution by deconvolving the CBCT image.
Main Results:
We successfully measured the x-ray focal spot intensity map. The spot size characterized by full width at half maximum was ~ 0.75 × 0.55 mm2 at 40 kVp. We computed image domain convolution kernels caused by the x-ray focal spot. A simulation study on noiseless projections was performed to evaluate the spatial resolution improvement exclusively by the focal spot kernel, and the modulation transfer function (MTF) at 50% was increased from 1.40 to 1.65 mm−1 for in-plane images and 1.05 to 1.32 mm−1 for cross-plane images. Experimental studies on a CT insert phantom and a plastinated mouse phantom demonstrated improved spatial resolution after image domain deconvolution, as indicated by visually improved resolution of fine structures. MTF at 50% was improved from 1.00 to 1.12 mm−1 for in-plane direction and from 0.72 to 0.84 mm−1 for cross-plane direction.
Significance:
The proposed method to mitigate blurring caused by finite x-ray spot size and improve CBCT image resolution is simple and effective.
1. Introduction
Image-guided small animal irradiation platforms have been successfully developed to support preclinical small animal radiation research (Verhaegen et al., 2011). Cone beam CT (CBCT) (Jaffray et al., 2002) is currently the most widely used imaging tool on these platforms to allow the acquisition of volumetric images for experiment planning, and for the guidance of animal positioning to accurately deliver radiation to the targeted area, while minimizing radiation to other regions. It has been demonstrated that the use of CBCT can offer soft-tissue imaging at acceptable imaging doses to ensure sub-millimeter targeting accuracy for radiation delivery (Clarkson et al., 2011).
For small animal irradiation experiments, CBCT image resolution is of particular importance because of the small size of animal subjects. There is a strong desire to achieve a high image resolution to visualize fine structures of the subjects. One major factor limiting the CBCT spatial resolution is the finite focal spot size of the x-ray tube. In an x-ray tube, an electron beam generated at the cathode is accelerated to hit the anode and generate x-rays. For a typical x-ray tube for CBCT imaging purpose, the effective focal spot size of the x-ray beam is mainly determined by the size of the electron beam and is often ~ 0.5 mm. Under the reconstruction algorithms that assume a point x-ray source, the resulting CBCT image is blurred. To overcome this problem, a micro-focal x-ray tube may be installed on the small animal irradiators to provide CBCT images with an improved spatial resolution. Nonetheless, not only does this approach increase the cost of the irradiation systems, it also introduces other concerns such as heat dissipation and long data acquisition time.
In x-ray imaging field, there have been tremendous efforts on overcoming the blurring problem caused by the relative large x-ray focal spot size and improving image resolution. X-ray tubes with a fine focal spot size are often used for radiography applications like in film-screen mammography (Muntz and W., 1979) and the CT neck angiography (Oh et al., 2019). Great efforts have been made to investigate the impact of the focal spot size (Koutalonis et al., 2008; Gorham and Brennan, 2010; Rueckel et al., 2014), and to mitigate blurs that it introduces. Monte Carlo simulations were employed to evaluate the spectral and spatial characteristics of off-focal radiation in kV x-ray tubes for imaging (van der Heyden et al., 2020). The x-ray spot intensity map can be measured using pinhole or coded-aperture techniques (Doi et al., 1975; Russo and Mettivier, 2011). To mitigate the impacts of x-ray spot, Mohan et al. (2020) developed a SABER approach to reduce the blur in radiographs caused by multiple aspects including the finite x-ray source spot. They modeled the point spread function of the source focal spot by a 2D density function. Uhlig and Zellner (2020) applied corrections to the images based on deconvolution with the 2D point spread function measured by irradiating pinholes with different widths. La Rivière et al. (2006) formulated a statistical restoration model to estimated x-ray projection data based on measurements that were degraded by different factors, including x-ray spot size. For volumetric images, blurring model has been employed in various steps of image processing for multi-detector CT to improve image resolution. However, it was found that the modeling has relatively small advantages in current CT systems (Hofmann et al., 2014). In the domain of flat-panel based CBCT, due to smaller flat panel pixel sizes, larger x-ray focal spots, addressing the x-ray spot effect is expect to be more crucial. Tilley II et al. (2015) developed a forward model for flat-panel-based CBCT systems including blur caused by the finite focal spot size. The model enabled estimation of true projection images without blur, which were then used in a subsequent statistical reconstruction process. In the framework of model-based iterative reconstruction (MBIR), the same group later built a non-linear least-square reconstruction model with blur effect incorporated (Tilley et al., 2017; Tilley II et al., 2017). The model achieved improved image quality over images reconstructed by the conventional FBP algorithm (Feldkamp et al., 1984) or MBIR without blurring considered. Chang et al. (2014) proposed an efficient reconstruction method by establishing an linear equivalence relation between the finite focal spot model and the ideal point source model to improve the spatial resolution.
In this paper, we will report our recent progress towards improving image resolution of the CBCT system on the SmART small animal irradiation platform (Precision X-ray Irradiation, Inc., North Branford, CT, USA) by mitigating blurring caused by the finite x-ray spot size. We will achieve improved resolution via two steps. First, we will employ a practically simple method to obtain the x-ray focal spot intensity map by deconvolving the measured x-ray projection image of a small tungsten ball bearing. Second, different from previous approaches that incorporated the blurring model in the MBIR process or in the preprocessing step of projection data, we will attempt to derive an approximate model describing CBCT image domain blurring caused by the x-ray focal spot. This model will allow us to improve CBCT image resolution by a simple deconvolution operation in the image domain.
2. Methods
2.1. X-ray focal spot intensity map measurement
The SmART preclinical radiation platform (Precision X-ray Irradiation, Inc., North Branford, CT, USA) is shown in Figure 1(a), which includes a rotating C-arm gantry and an animal bed. The gantry can perform CBCT scanning and deliver radiation using an x-ray tube mounted on the gantry. The x-ray tube can emit an x-ray beam with energy in the range of 5 to 225 kVp. Opposite to the x-ray tube is an amorphous silicon flat-panel detector (FPD) for x-ray projection image measurement. The FPD has 1024 × 1024 active pixels and the pixel size is 0.2 × 0.2 mm2. The gantry and the animal bed are enclosed in a self-shielded cabinet.
Figure 1:
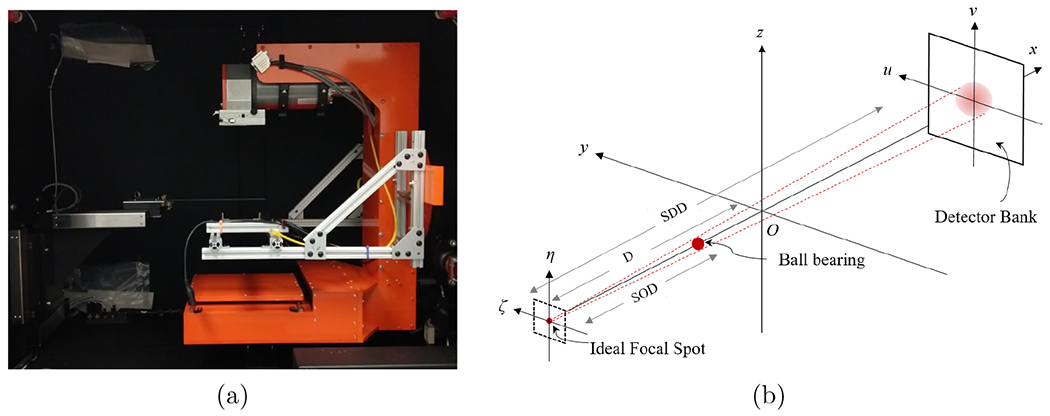
(a) SmART preclinical radiation platform. (b) Illustration of the configuration for x-ray focal spot intensity map measurement.
Let us consider the setup shown in Figure 1 (b). Z-axis is the CBCT rotation axis. We placed a tungsten carbide ball bearing (BB) between the x-ray focal spot and the FPD. The BB’s radius was R = 0.5 mm. We attached the BBs to the filter of the x-ray tube, and the source-to-object distance (SOD) was known to be 6.94 cm. We then acquired the x-ray projection of the BB using the FPD under the setting of 40 kVp and 0.27 mAs. Under an ideal point x-ray focal spot and assuming the FPD only measures transmission signal of the x-ray beam, the measured image intensity can be computed analytically. Specifically, in the coordinate defined in Figure 1(b), the projection image intensity under the ideal point focal spot at (−D, 0, 0) is
| (1) |
where D = 30.5 cm denotes the source-to-axis distance, μ is the x-ray attenuation coefficient of the BB material, I0 is the intensity of the x-ray beam, is the angle between the x axis and the x-ray line connecting the ideal focal spot and (u, v), and α ≡ SDD/SOD is the amplification factor, with SDD = 62.55 cm being the source-to-detector distance. Note that this expression ignored the polychromatic nature of the x-ray beam. We used the average x-ray attenuation μ = 1.41 × 103 cm−1 under the 40 kVp beam spectrum in our calculation.
With a finite size x-ray focal spot, the measured image is blurred. Denote the x-ray focal spot intensity map as κ(ζ, η). Note that in our coordinate definition, (ζ, η) axes are parallel to (u, v) axes. For a small object, the measured image can be expressed in a convolution model:
| (2) |
Note that this expression ignored the slight variation of the projected BB image under a point x-ray source caused by the variation of the x-ray spot locations. This was a valid approach, as the variation was expected small because of the small x-ray focal spot size relative to SOD.
Eq. (2) offered a straightforward method to measure the x-ray focal spot intensity map by deconvolving the measured image using the known kernel p. As such, once the projection image p(u, v) was computed, we deconvolved the measured image to obtain the x-ray focal spot map as:
| (3) |
where and represent the forward and inverse Fourier transform, respectively. ϵ is a small positive number introduced to avoid noise amplification in this calculation. Note that the arguments in the left and right sides of the above expression differed by a factor α due to geometry amplification of the x-ray projection.
2.2. Modeling the impact of x-ray focal spot in image domain
In this section, we try to derive a relation between a ground truth CT image f(x, y, z) and the measured image that was reconstructed by the filtered backprojection (FBP) algorithm (Feldkamp et al., 1984) using the projection data affected by the finite x-ray focal spot size. Knowing this relation will allows to solve f(x, y, z) from .
In the imaging and reconstruction pipeline, the forward x-ray projection, blurring of the x-ray projection caused by the finite x-ray focal spot size, and FBP image reconstruction are all linear operations. Hence, it is sufficient to study the impact of image blurring for the case with an image , i.e. a Dirac measure centered at (x0, y0, z0). For this particular case, the projection data under an ideal zero-size x-ray spot Pβ(u, v, x0, y0, z0) is also a Dirac measure: , where u, v are coordinates of the detector plane, β is the projection rotation angle. See Figure 2 for the definition of geometry. The projection data here refers to the image of x-ray line integral. The relationship between u, v, β and x, y, z is
| (4) |
| (5) |
and u0 = u(x0, y0, β) and v0 = v(x0, y0, z0, β). D is the source-to-axis distance (SAD). Note that we considered here the case with the detector plane positioned at isocenter and containing the z axis, instead of the physical detector position.
Figure 2:
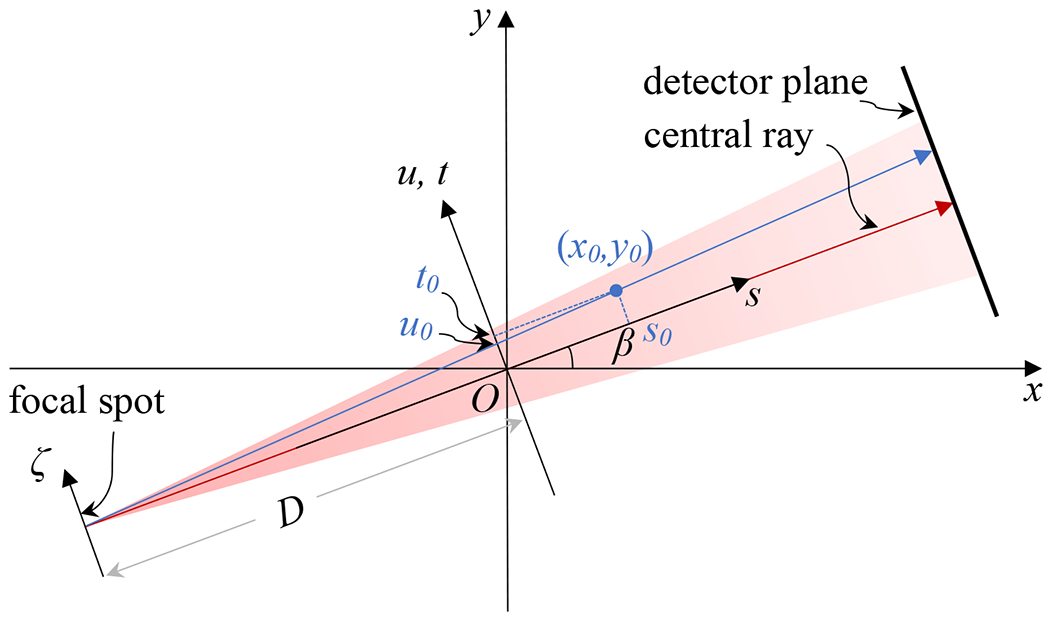
Geometry definition.
Under a finite-size focal spot with intensity distribution κ(ζ, η), the projection data becomes
| (6) |
where is the projection of a delta function image at (x0, y0, z0) to the projection angle β with a unit-intensity off-axis point source at (ζ, η) (Chang et al., 2014). In particular, . Note that, strictly speaking, the blur caused by the x-ray spot occurs in the measured x-ray projection intensity data, whereas the projection data in Eq. (6) is calculated based on the x-ray line integral, i.e. log transformed projection measurement data. However, under the assumption of a small spot size, it was found that the blurring model in the x-ray line integral data also holds (Chang et al., 2014).
After FBP reconstruction, the reconstructed image is
| (7) |
where and h(·) is the ramp filter. As the focal spot coordinates ζ and η do not depend on image coordinates, we change the order of integration as
| (8) |
where k(x, y, z, x0, y0, z0) is the function representing the image domain blurring from a point (x0, y0, z0). In the following subsection, we will numerically show that this function can be approximated as .
With this expression, because of the linearity of the imaging and reconstruction process, the reconstructed image for a general image f(x, y, z) can be expressed as
| (9) |
This equation indicates that the reconstructed image is a convolution of the true image f(x, y, z) with the approximated 3D blurring kernel K. This will enable us to restore f(x, y, z) from via deconvolution.
2.2.1. Blurring kernels
Assuming the object size is small, x0, y0, z0 ≪ D, it follows that s ≪ D, z ~ v, . Eq. (8) can be expressed as
| (10) |
Eq. (10) specified the way of numerically computing k(x, y, z, x0, y0, z0). Specifically, for an image with a point object at (x0, y0), we computed its 2D forward x-ray projection δ(u – u0,β,ζ) at projection angle β with an off-center point source at ζ. We then performed FBP reconstruction assuming the ideal point source at ζ = 0, yielding fδ,ζ(x, y, x0, y0). Finally, we numerically evaluate the numerical integration over ζ.
The above expression already indicated that k(x, y, z, x0, y0, z0) is a function of z – z0. As for its dependence on x, x0, y and y0, we will numerically verify that it is approximately a function of x – x0 and y – y0.
2.2.2. Image deconvolution
Based on Eq. (9), we computed the image f(x, y, z) by deconvolving the measured image (x, y, z) via the Fourier transform approach
| (11) |
where and denote 3D Fourier transform and its inverse, respectively. ϵ = 0.001 is a small positive number used to avoid amplification of high-frequency signals in the results. This value was empirically chosen to maintain similar noise level between the resulting image f and the input image , so that comparison of image resolutions between the two is fair.
2.3. Evaluation
A simulation study was performed to demonstrate the validity and effectiveness of the proposed approach. A cylinder of 4 mm in radius and 8 mm in height filled with solid water with a linear x-ray attenuation coefficient μ = 0.25 cm−1 was considered for simplicity. We computed the forward x-ray projection by computing the x-ray path length through the cylinder analytically. The measured x-ray focal spot map was employed to simulate the blurring effect on the projection data. 600 projections were computed. D and SDD were 30.5 cm and 62.5 cm, respectively. The detector was assumed to have 300 × 300 pixels with 0.1 mm pixel size. A CBCT image with 200 × 200 × 200 voxels and 0.1 mm voxel size was reconstructed using the FBP algorithm. These settings were consistent with those of the actual CBCT system.
We also carried out experiments to validate our method. CBCT data were acquired at 40 kVp with a filter of 2.0 mm Al and 0.3 mm Cu and 0.27 mAs per projection in consistency with energy that the focal spot kernel was computed with. For the projection geometry, D = 30.5 cm and SDD = 62.5 cm. 600 projections were acquired in each scan with the angular range of 360° and scan time of 60 sec. We acquired dark images and flood-field images to correct each projection image.
We studied two phantoms (SmART Scientific Solutions B.V., Maastricht, Netherlands) to evaluate the image quality. One was a preclinical CT calibration insert phantom and the second one was a plastinated mouse specimen. After applying for all the geometry and intensity correction factors following our previously reported procedure (Huang et al., 2021), and reconstructing the image using FBP reconstruction algorithm, we deconvolved the image as in Eq. (11). The resulting CBCT images were visually compared with the original CBCT images before deconvolution to inspect for image resolution improvement.
To quantitatively measure the improvement of CBCT resolution, Modulation Transfer Function (MTF) was computed for the simulation study, as well as the experimental study with the CT calibration insert phantom (using a bone insert). To compute the in-plane MTF, we first determined the center coordinates of the object (insert), and then obtained an Edge Spread Function (ESF) with respect to the distance to the center along a radial line cross through the center. Repeating the same process for multiple radial lines and layers at different z coordinate, we obtained an averaged ESF that was smooth enough to compute its first-order derivative, i.e. line-spread function (LSF). The Fourier transform of LSF was calculated to compute the MTF. As for the cross-plane MTF, we selected an edge at the end of the bone rod in an image plane defined by the rod central axis and the isocenter. We computed ESF of this edge in the selected plane, and MTF was calculated as the Fourier transform of the LSF that was obtained from the ESF.
3. Results
3.1. X-ray focal spot map
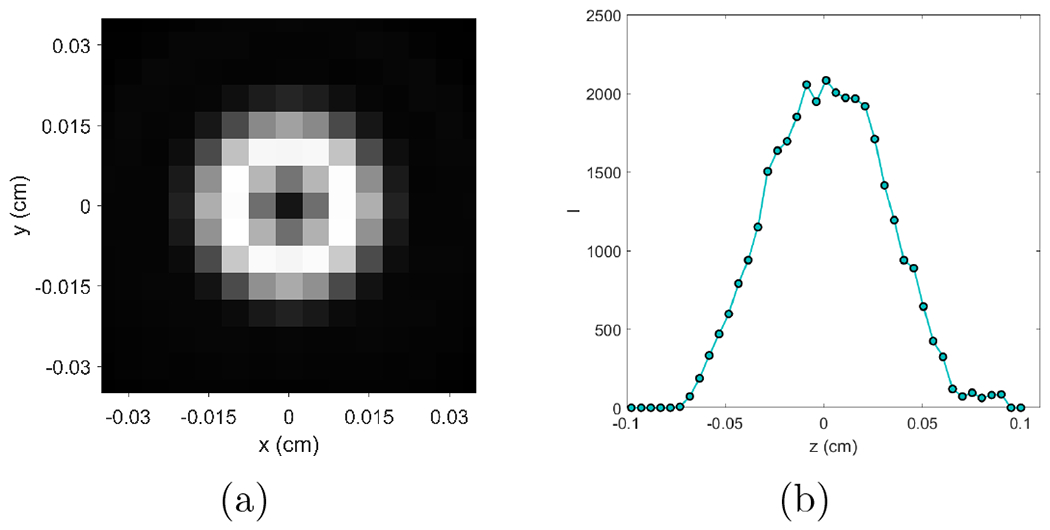
Figure 3(a) shows the measured x-ray focal spot map κ(ζ, η). This is a 41 × 41 pixel image with pixel size of 0.05 mm per dimension. We observed that the actual focal spot has a non-regular shape and the intensity was not uniformly distributed over the focal spot map. Figure 3(b) depicts the measured x-ray focal spot projected onto ζ and η axes. Full width at half maxima values were calculated along these two directions and the result was 0.75 × 0.55 mm2. The rectangle in Figure 3(a) indicating this size.
Figure 3:
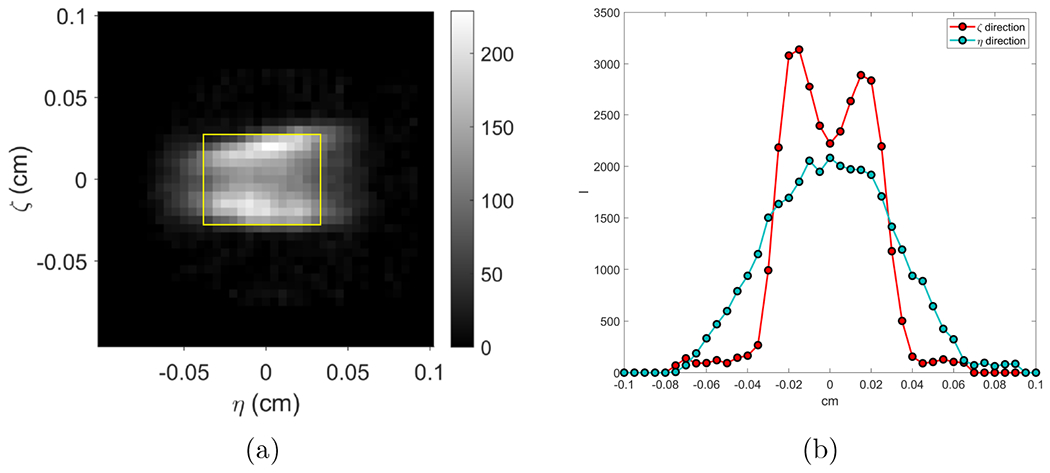
(a) Measured focal spot intensity map and (b) its projections along ζ- and η- directions.
3.2. Blurring kernels
We first computed fδ,ζ(x, y, x0, y0). The result for a representative case (x0, y0) = (0, 0) with different ζ values are shown in the top row of Figure 4. As expected, the images exhibited a larger ring with increasing absolute values of ζ due to the fact that filtered projections originated from ζ ≠ 0 were back projected along the x-ray line corresponding to ζ = 0. The ripple structure around the circle in each image reflected the ramp filter shape in the FBP algorithm.
Figure 4:
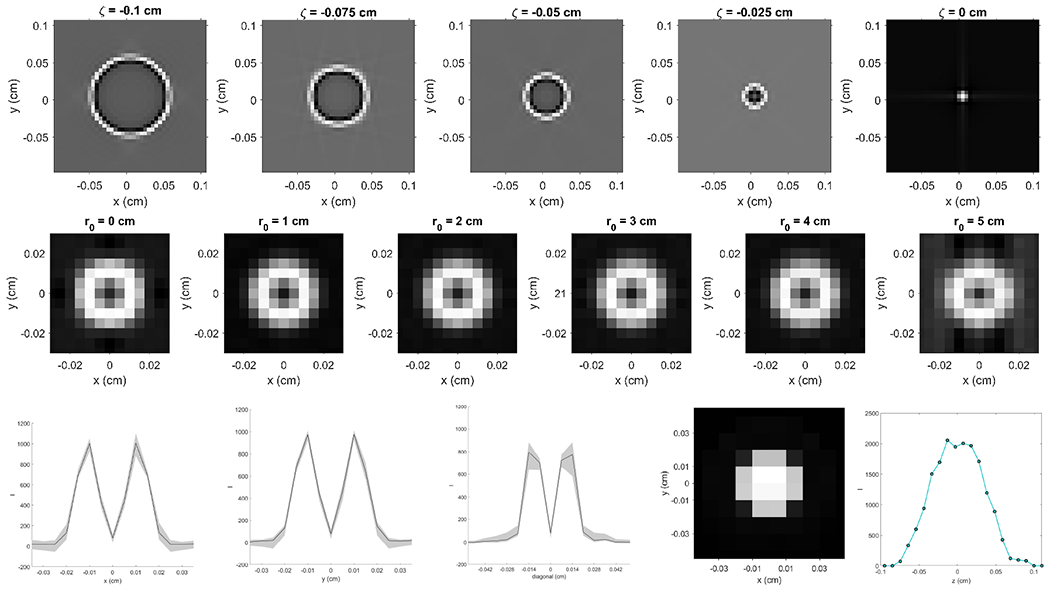
Top: fδ,ζ(x, y, x0, y0) image obtained with a fixed (x0, y0) = (0, 0) and various ζ. Middle: k(x, y, z = 0, x0, y0, z0 = 0) computed with various . Bottom: K(x−x0, y−y0, 0) along y = 0 (left-most), x = 0 (second to left) and diagonal (middle) directions. Second to right: Blurring kernel K(x−x0, y−y0, 0). Right-most: Blurring kernel K(0, 0, z − z0).
We then computed k(x, y, z, x0, y0, z0) via Eq. (10). We focused on the behavior of this function in the x and y directions, and set z = z0 = 0. Because of rotational symmetry of the CBCT system, k(x, y, z, x0, y0, z0) is only a function of . Middle row of Figure 4 shows the computed k(x, y, z = 0, x0, y0, z0 = 0) with various r0 values. There was visually no change of k(x, y, z = 0, x0, y0, z0 = 0) with increasing values of r0. This numerically justified our assumption k(x, y, z, x0, y0, z0) = K(x − x0, y − y0, z − z0). We also plotted the center line k(x, y, z = 0, x0, y0, z0 = 0) along x, y and diagonal directions as shown in Figure 4. The area shaded in gray demonstrates the range of k(x, y, z = 0, x0, y0, z0 = 0) at different r0.
The final result of the blurring kernel K(x−x0, y−y0, 0) by averaging k(x, y, z = 0, x0, y0, z0 = 0) at different r0 values is shown in second to right image in the bottom row of Figure 4 and the right-most one shows the blurring kernel K(0, 0, z−z0) along the z direction.
3.3. Simulation
Figure 5 presents the simulation study results. The ideal case was the one with analytically computed projection data under a point focal spot, which represents the best case achievable, considering the resolution loss in image reconstruction caused by factors such as finite angular sampling frequency, filtering, inaccurate FBP reconstruction algorithm along the z direction etc. The raw case was the one with projection data computed using the finite x-ray focal spot and reconstructed using the FBP algorithm. The deblurred one was that with our proposed method. Visually, the proposed method improved sharpness of edges. Quantitatively, MTF at 50% was increased from 1.40 to 1.65 mm−1 for in-plane images and 1.05 to 1.32 mm−1 for cross-plane images. Note that our method only restored resolution to a certain extent, and there is still room of improvement, as compared to the ideal case.
Figure 5:
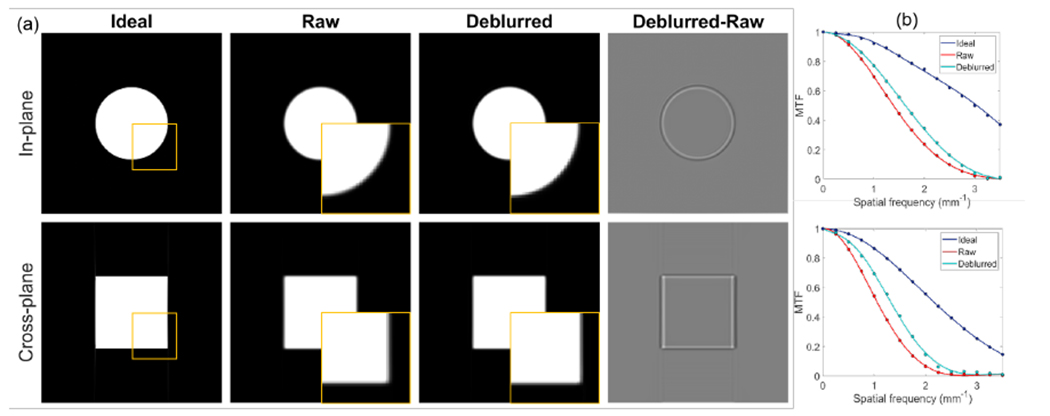
(a) CBCT of the simulated ideal, raw and deblurred images, and the difference between deblurred and raw images. Top and bottom rows are in-plane and cross-plane images. Display window [0, 0.2] cm−1 for phantom images and [−0.05, 0.05] cm−1 for difference image. Squares indicated locations of zoomed-in views. (b) MTFs of in-plane direction (top) and cross-plane direction (bottom) of different images.
3.4. CBCT image deconvolution
Figure 6 (a) presents the raw and the deblurred CBCT images of the rod phantom, and their differences, displayed in the in-plane and cross-plane directions. We observed an improvement in sharpness of the object contours in the deblurred images as indicated by the difference figures. The difference mainly appeared at image edges due to sharpened image edges.
Figure 6:
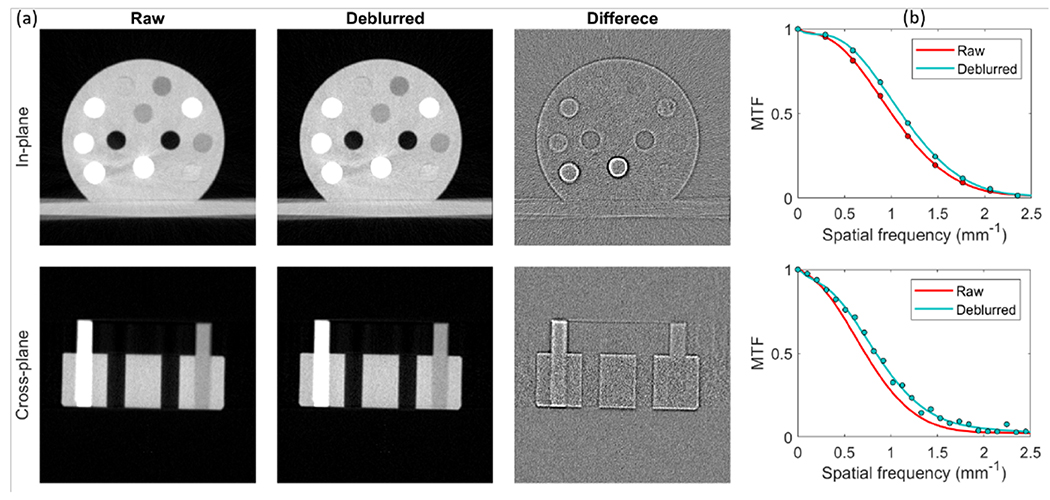
(a) CBCT images of the calibration insert phantom. Top and bottom rows are in-plane and cross-plane images. Display window [−1000,300] HU for phantom images and [−100,100] HU for difference images. (b) MTFs of in-plane direction (top) and cross-plane direction (bottom) of different images.
Figure 6 (b) shows the MTFs of the raw and deblurred images in the in-plane and cross-plane directions, and the solid curves are simply fitted with polynomials. Clearly, the MTF of the deblurred image trended slowly to zero with increasing spatial frequency, which indicated that the blurring in raw CBCT images was mitigated by deconvolution with our 3D x-ray focal spot blurring kernels. Quantitatively, MTF at 50% was improved from 1.00 to 1.12 mm−1 for in-plane direction and 0.72 to 0.84 mm−1 for cross-plane direction. We also compared noise amplitudes in the raw and deblurred images by calculating standard deviation of a homogeneous region inside the phantom. This is important to ensure a fair comparison of image resolutions under similar noise levels. The noise amplitudes in the raw and deblurred images were 37 HU and 39 HU, respectively.
Top row of Figure 7 presents the raw and the deblurred CBCT images and their differences of the plastinated mouse phantom at an in-plane cross section. Other rows of this figure show the raw and the deblurred CBCT images and their differences in the other two views. As expected, the spatial resolution of the deblurred images was improved and more details became visible, especially at object edges, as shown in the difference images. For example, the nasal bones area pointed out by the cyan arrows in Figure 7 exhibits a higher spatial resolution. The vague teeth indicated by the yellow arrow from the raw image have been restored with a sharper edge. To see the improvements more clearly, we also plotted the zoom-in views of several areas in Figure 8. Small structure can be seen in the deblurred images with a higher contrast. We also compared image intensity profiles in Figure 8 to show improvement in image sharpness. Since there is no ground truth in this animal case, we cannot quantify improvement in image resolution. Based on the previous results in the simulation case and the CT insert phantom case, it is likely that the observed resolution enhancement is real.
Figure 7:
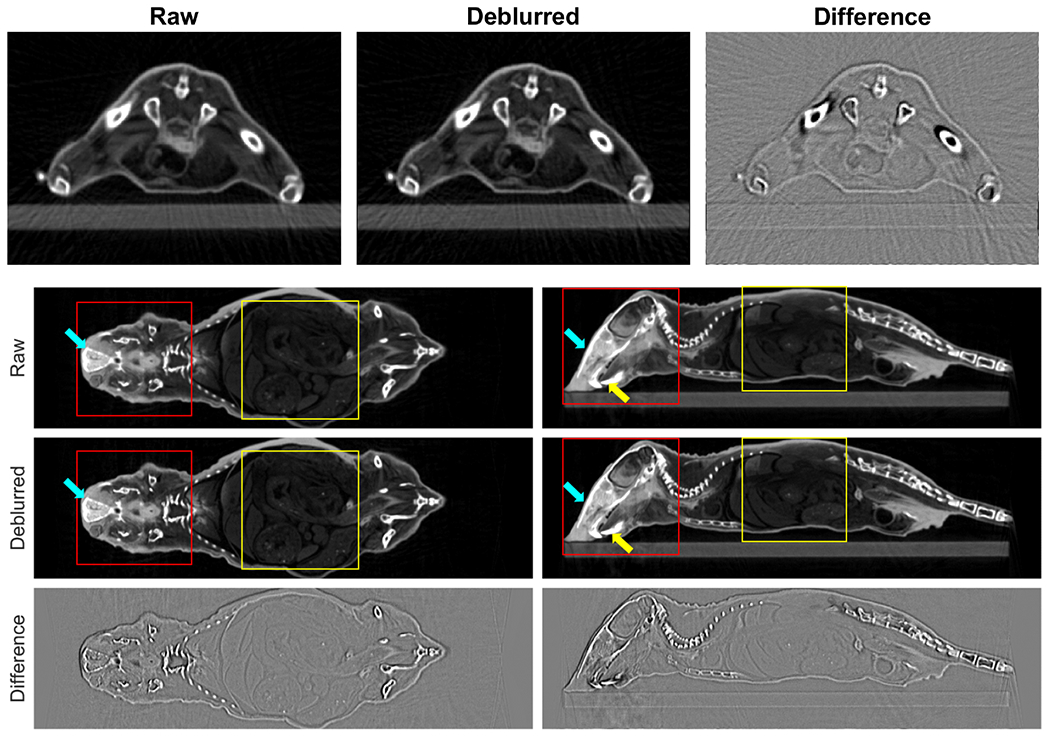
Top row: In-plane CBCT images of plastinated mouse phantom. From left to right, original image, deblurred image, and difference. Second to last rows: raw images, deblurred images, and differences of sagittal and coronal CBCT images. Display window [−1000,300] HU for CBCT images and [−100,100] HU for difference images. Arrows indicate regions of improvement. Square regions are zoom-in views in Figure 8.
Figure 8:
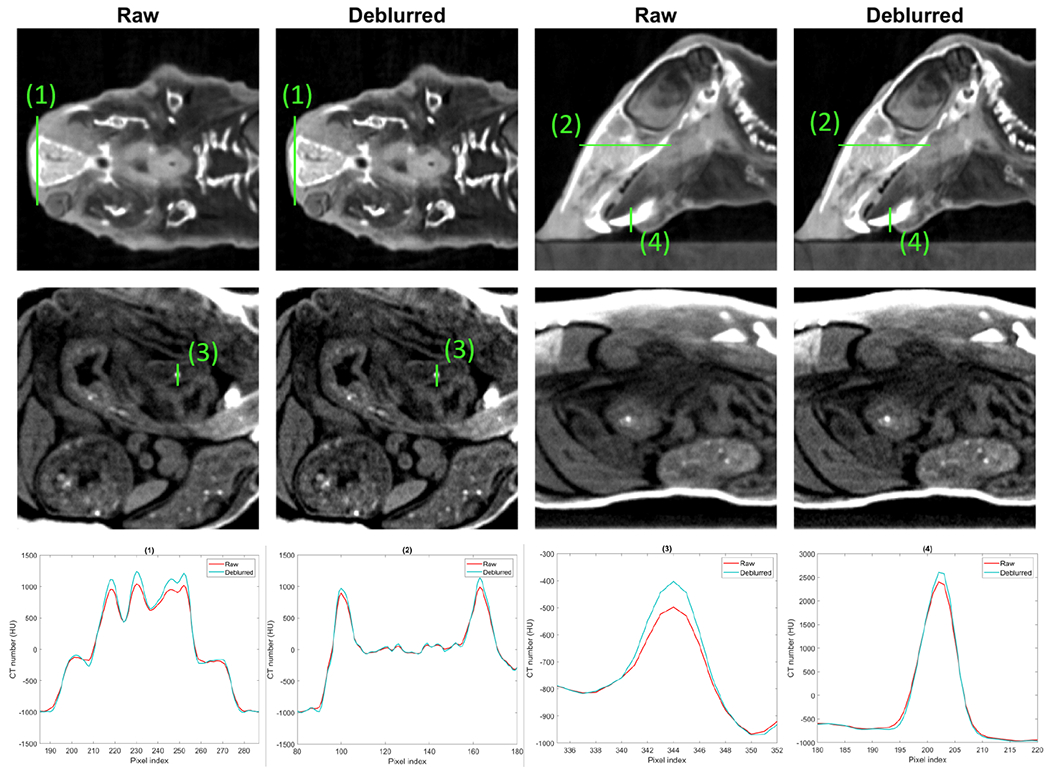
Top and middle rows: zoom-in regions of raw and deblurred images of plastinated mouse phantom. Display windows are [−1000 300] HU for the top row and [−950,−600] HU for the middle row. Bottom row: line profiles of plastinated mouse indicated by solid green lines in the top and middle row images.
4. Discussions
Improving image resolution by addressing the blur caused by finite x-ray focal spot size is an important task for CBCT because of the relatively small flat panel pixel sizes and large x-ray focal spots. Extensive previous studies have been performed on this subject. Major approaches to handle this problem were to build a forward blurring model and then use it to deconvolve measured projection images before reconstruction, or to incorporate the blurring model directly in the MBIR framework. In this study, we developed a relatively simple approach that directly estimated the effect of x-ray spot size induced blurring in the CBCT image reconstructed by the standard FBP algorithm. With some assumptions, the effect was able to be described by an image-domain convolution model. This hence enabled us to apply a simple deconvolution operation to mitigate the blurring effect and improve resolution. Despite the simpler scheme than previous studies, the effectiveness of our method has been demonstrated in numerical and experimental studies.
In our approach, the blurring kernel was numerically computed, and FBP reconstruction was a main part of the calculation. Hence, the kernel depends on settings of the FBP algorithm, such as angular sampling frequency, detector and image grids, and reconstruction kernel etc. One should compute the kernel based on the specific setup in FBP reconstruction. For instance, when changing the image voxel size from 0.1 mm to 0.05 mm, the variation of the kernel is shown in Figure 9.
Figure 9:
(a) Blurring kernel K(x − x0, y − y0, 0) and (b) K(0, 0, z − z0) computed at voxel size of 0.05 mm
While the proposed method mitigated the blur caused by the x-ray focal spot to a certain extent, there was still room of improvement, as indicated by the separation between the MTFs of the deblurred and the ideal cases in Figure 5. Quantitatively, our method improved MTF at 50% from 1.40 to 1.65 mm−1 for the in-plane direction and from 1.05 to 1.32 mm−1 for the cross-plane direction, whereas in the ideal case, the MTFs were 3.05 and 2.18 mm−1 along the two directions, respectively.
There are other issues affecting the resolution of CBCT images. In the flat panel detector, x-ray photon triggered light photons with a diverse angular distribution can be detected by multiple pixels, causing blurs in projection images. While we did not consider this blurring effect in our model, the projection data in this study has been corrected for this effect following the procedure reported in our previous study (Huang et al., 2021). The raw images, e.g. those showed in Figure 7 were reconstructed with projection data after detector blur correction. Another effect is deviation of scanning geometry from the ideal circular geometry. We have calibrated the scan geometry and resampled the projection data to convert them into those for the ideal circular scan geometry (Huang et al., 2021). All CBCT images were reconstructed using the corrected data. Yet, it is expected that there is residual motion uncertainty, such as gantry wobbling during the data acquisition. The residual motion cannot be handled by the geometry calibration step, and it may limit the effectiveness of modeling x-ray focal spot for resolution improvement. Object motion during data acquisition is another major factor limiting the spatial resolution. Nielsen (1980) showed that the MTF at 50% due to motion is about 2 lp/mm and that of focal spot is about 4 lp/mm. The motion blur depends on the velocity of motion. Tay et al. (2008) reported that the axial spatial resolution was degraded from 0.63 mm at rest to 0.8 mm at velocity of 20 mm/s. For small animals with a relatively large heart or respiratory motion, the induced blur would be a great concern. Eliminating image blurs caused by these motions is beyond the scope of this work. However, the proposed method could facilitate the reduction of image blurs caused by object motion. In the conventional approaches, a small-spot x-ray tube is used to address focal spot-induced blur, which increases scanning time and hence the risk of motion-caused blur. In contrast, our method handles image blur caused by focal spot in a post-processing step without prolong data acquisition time.
In addition to addressing the blurring issue via modeling approaches, recently, studies on improving image resolution using deep learning approaches (Shen et al., 2020a) have demonstrated a great potential (Hatvani et al., 2018; Park et al., 2018). Employing a deep neural network, it was possible to establish a direct end-to-end mapping between low-resolution and high-resolution images. Existing studies achieved so mostly via a pure data-driven approach, i.e. to train the network using data at different resolution levels. A potential direction to improve these methods is to incorporate models about the mechanisms of image blurring in the network construction and training process. By directly providing information about image blurring mechanisms, this may potentially reduce the requirement on training data size and quality, as well as to improve other aspects of the deep learning model, such as interpretability and robustness (Antun et al., 2020; Wu et al., 2020; Shen et al., 2020b).
Noise and resolution are always factors trading off each other. Previous studies using MBIR allowed incorporation of both effects in a unified framework, even noise statistics and correlations (Tilley et al., 2017; Tilley II et al., 2017). In this study, we simply performed an image domain deconvolution, which is known to potentially amplify noise. We used Fourier transform approach for deconvolution operation, with a small parameter ϵ introduced to control noise in the resulting images (Eq. (11)). The parameter ϵ was empirically selected to control noise levels, as demonstrated by the similar noise amplitudes before and after deconvolution. One potential improvement to address the noise issue is to use a more sophisticated deconvolution model that formulates the problem as an optimization problem and introduces an image domain regularization to control the resulting image quality and suppress noise.
5. Conclusion
In this study, to improve the resolution of CBCT images for preclinical small animal radiation research by addressing image blurs caused by finite x-ray spot size, we developed a simple method to measure x-ray focal spot intensity map by deconvolving measured x-ray projection of a tungsten ball bearing using the flat panel detector of the CBCT. Based on the measured intensity map, we further derived an approximate CBCT image domain blurring model for images reconstructed by the FBP algorithm, and subsequently used it to improved the CBCT image resolution via a deconvolution operation. Numerical results on a simulation study of noise-free projections show improvement in the spatial resolution by the proposed method. Experimental studies on a CT insert phantom and a plastinated mouse phantom demonstrated improved spatial resolution, indicated by visually improved resolution of fine structures and quantitatively by improved MTFs. The approach proposed in this study is simple and effective to address x-ray focal spot induced image blurring and improve CBCT image resolution.
Acknowledgement
This study was supported in part by grants from National Institutes of Health (R37CA214639, R01CA227289).
References
- Antun Vegard, Renna Francesco, Poon Clarice, Adcock Ben, and Hansen Anders C. On instabilities of deep learning in image reconstruction and the potential costs of ai. Proceedings of the National Academy of Sciences, 117(48):30088–30095, 2020. [DOI] [PMC free article] [PubMed] [Google Scholar]
- Chang Ming, Xiao Yongshun, and Chen Zhiqiang. Improve spatial resolution by modeling finite focal spot (mffs) for industrial ct reconstruction. Opt. Express, 22 (25):30641–30656, 2014. doi: 10.1364/OE.22.030641. [DOI] [PubMed] [Google Scholar]
- Clarkson R, Lindsay PE, Ansell S, Wilson G, Jelveh S, Hill RP, and Jaffray DA. Characterization of image quality and image-guidance performance of a preclinical microirradiator. Medical physics, 38(2):845–856, 2011. [DOI] [PMC free article] [PubMed] [Google Scholar]
- Doi Kunio, Fromes Bernard, and Rossmann Kurt. New device for accurate measurement of the x-ray intensity distribution of x-ray tube focal spots. Medical physics, 2(5):268–273, 1975. [DOI] [PubMed] [Google Scholar]
- Feldkamp Lee A, Davis Lloyd C, and Kress James W. Practical cone-beam algorithm. Josa a, 1(6):612–619, 1984. [Google Scholar]
- Gorham Sinead and Brennan Patrick C. Impact of focal spot size on radiologic image quality: A visual grading analysis. Radiography, 16(4):304–313, 2010. ISSN 1078-8174. doi: 10.1016/j.radi.2010.02.007. [DOI] [Google Scholar]
- Hatvani Janka, Horváth András, Michetti Jérôme, Basarab Adrian, Kouamé Denis, and Gyöngy Miklós. Deep learning-based super-resolution applied to dental computed tomography. IEEE Transactions on Radiation and Plasma Medical Sciences, 3(2):120–128, 2018. [Google Scholar]
- Hofmann Christian, Knaup Michael, and Kachelrieß Marc. Effects of ray profile modeling on resolution recovery in clinical ct. Medical physics, 41(2):021907, 2014. [DOI] [PubMed] [Google Scholar]
- Huang Yanqi, Hu Xiaoyu, Zhong Yuncheng, Lai Youfang, Shen Chenyang, and Jia Xun. Improving dose calculation accuracy in preclinical radiation experiments using multi-energy element resolved cone beam ct. Physics in Medicine & Biology, 2021. [DOI] [PMC free article] [PubMed] [Google Scholar]
- Jaffray David A, Siewerdsen Jeffrey H, Wong John W, and Martinez Alvaro A. Flat-panel cone-beam computed tomography for image-guided radiation therapy. International Journal of Radiation Oncology* Biology* Physics, 53(5):1337–1349, 2002. [DOI] [PubMed] [Google Scholar]
- Koutalonis M, Delis H, Spyrou G, Costaridou L, Tzanakos G, and Panayiotakis G. Monte carlo studies on the influence of focal spot size and intensity distribution on spatial resolution in magnification mammography. Physics in Medicine and Biology, 53(5):1369–1384, 2008. doi: 10.1088/0031-9155/53/5/013. URL 10.1088/0031-9155/53/5/013. [DOI] [PubMed] [Google Scholar]
- La Rivière Patrick J, Bian Junguo, and Vargas Phillip A. Penalized-likelihood sinogram restoration for computed tomography. IEEE transactions on medical imaging, 25(8):1022–1036, 2006. [DOI] [PubMed] [Google Scholar]
- Mohan K, Panas R, and Cuadra J. Saber: A systems approach to blur estimation and reduction in x-ray imaging. IEEE Transactions on Image Processing, 29:7751–7764, 2020. [Google Scholar]
- Muntz EP and Logan WW Focal spot size and scatter suppression in magnification mammography. American Journal of Roentgenology, 133:453–459, 1979. [DOI] [PubMed] [Google Scholar]
- Nielsen Bengt. Resolution unsharpness and mtf. Technical report, Department of Radiation Physics, Faculty of Health Sciences, Linkoping university, 1980. [Google Scholar]
- Chia-Wei Oh Lawrence, Kwok-Pan Lau Kenneth, Devapalasundaram Ashwini, Buchan Kevin, Kuganesan Ahilan, and Huynh Minh. Efficacy of fine focal spot technique in ct angiography of neck. The British Journal of Radiology, 92(1100):20190083, 2019. [DOI] [PMC free article] [PubMed] [Google Scholar]
- Park Junyoung, Hwang Donghwi, Yun Kim Kyeong, Kwan Kang Seung, Kim Yu Kyeong, and Sung Lee Jae. Computed tomography super-resolution using deep convolutional neural network. Physics in Medicine & Biology, 63(14):145011, 2018. [DOI] [PubMed] [Google Scholar]
- Rueckel J, Stockmar M, Pfeiffer F, and Herzen J. Spatial resolution characterization of a x-ray microct system. Applied Radiation and Isotopes, 94:230–234, 2014. ISSN 0969-8043. doi: 10.1016/j.apradiso.2014.08.014. [DOI] [PubMed] [Google Scholar]
- Russo Paolo and Mettivier Giovanni. Method for measuring the focal spot size of an x-ray tube using a coded aperture mask and a digital detector. Medical physics, 38(4):2099–2115, 2011. [DOI] [PubMed] [Google Scholar]
- Shen Chenyang, Nguyen Dan, Zhou Zhiguo, Jiang Steve B, Dong Bin, and Jia Xun. An introduction to deep learning in medical physics advantages, potential, and challenges. Physics in Medicine and Biology, 65(5):05TR01, 2020a. [DOI] [PMC free article] [PubMed] [Google Scholar]
- Shen Chenyang, Tsai Min-Yu, Chen Liyuan, Li Shulong, Nguyen Dan, Wang Jing, Jiang Steve B, and Jia Xun. On the robustness of deep learning based lung nodule classification for ct images with respect to image noise. Physics in Medicine & Biology, 2020b. [DOI] [PMC free article] [PubMed] [Google Scholar]
- Tay Shian Chao, Primak Andrew N., Fletcher G. Joel, Schmidt Bernhard, An Kai-Nan, and Cynthia H McCollough H Understanding the relationship between image quality and motion velocity in gated computed tomography:preliminary work for 4-dimensional musculoskeletal imaging. Journal of computer assisted tomography, 32(4):634–639, 2008. [DOI] [PMC free article] [PubMed] [Google Scholar]
- Tilley Steven, Jacobson Matthew, Cao Qian, Brehler Michael, Sisniega Alejandro, Zbijewski Wojciech, and Stayman J Webster. Penalized-likelihood reconstruction with high-fidelity measurement models for high-resolution cone-beam imaging. IEEE transactions on medical imaging, 37(4):988–999, 2017. [DOI] [PMC free article] [PubMed] [Google Scholar]
- Tilley Steven II, Siewerdsen Jeffrey H, and Stayman J Webster. Model-based iterative reconstruction for flat-panel cone-beam ct with focal spot blur, detector blur, and correlated noise. Physics in Medicine & Biology, 61(1):296, 2015. [DOI] [PMC free article] [PubMed] [Google Scholar]
- Tilley Steven II, Zbijewski Wojciech, and Stayman J. Webster. High-fidelity modeling of shift-variant focal-spot blur for high-resolution ct. In Proc Int MeetFully Three-Dimensional Image Reconstr Radiol Nucl Med, pages 752–759, 2017. [Google Scholar]
- Uhlig W Casey and Zellner Michael B. Utilizing point-spread functions of x-ray sources to increase image resolution of shaped charge jet x-radiographs. Technical report, CCDC Army Research Laboratory, January 2020. [Google Scholar]
- van der Heyden Brent, Paiva Fonseca Gabriel, Podesta Mark, Messner Ivan, Reisz Niklas, Vaniqui Ana, Deutschmann Heinz, Steininger Phil, and Verhaegen Frank. Modelling of the focal spot intensity distribution and the off-focal spot radiation in kilovoltage x-ray tubes for imaging. Physics in Medicine & Biology, 65(2):025002, 2020. [DOI] [PubMed] [Google Scholar]
- Verhaegen Frank, Granton Patrick, and Tryggestad Erik. Small animal radiotherapy research platforms. Physics in Medicine & Biology, 56(12):R55, 2011. [DOI] [PubMed] [Google Scholar]
- Wu Weiwen, Hu Dianlin, Cong Wenxiang, Shan Hongming, Wang Shaoyu, Niu Chuang, Yan Pingkun, Yu Hengyong, Vardhanabhuti Varut, and Wang Ge. Stabilizing deep tomographic reconstruction networks. arXiv preprint arXiv:2008.01846, 2020. [Google Scholar]


