

Abstract
Background:
Mechanical ventilation (MV) in ICU patients may impact hemodynamics and renal function. We aimed to describe the interactions of MV settings, hemodynamic parameters and worsening of renal function (WRF).
Methods:
We included adult patients admitted for the first time in the ICU from the MIMIC-III database. Mean arterial blood pressure (mABP), central venous pressure (CVP) and positive end-expiratory pressure (PEEP) were collected and summarized as a time-weighted mean. The main outcome was WRF defined as acute kidney injury (AKI) occurrence or one-KDIGO stage worsening compared to the KDIGO stage the day before. We used a multinomial logistic regression at day 1 (ldmk-1) and day 2 (ldmk-2) according to a landmark-approach, with a two-days sliding perspective.
Results:
27,248/61,051 patients met the inclusion criteria (15,258 male (56.0%); 60.1% over 60y). ICU and hospital mortality were 7.4 and 10.7%, respectively.
MV was independently associated with WRF in the ldmrk-1 and −2 models (relative risk ratio [RRR] 8.15 [6.58;10.11] and 7.08 [3.97;12.61] at day-3 and 4, respectively). In MV patients, PEEP was associated with WRF in the ldmrk-1 and −2 models (RRR 1.36 [1.16, 1.6] and 1.17 [0.88, 1.56] by 1cmH2O increase at day-3 and 4, respectively).
Mean perfusion pressure decreased while central venous pressure increased over PEEP categories. In multivariable analysis, mABP, CVP and PEEP were independently associated with WRF.
Conclusion:
In this large cohort of ICU patients, we observed a strong relationship between MV and WRF. PEEP was associated with WRF in MV patients. This association relied at least partly on renal venous congestion.
Keywords: acute kidney injury, positive end-expiratory pressure, mechanical ventilation, ventilation induced kidney injury
Background
Despite frequent in critically ill patients ,exact pathogenesis of AKI remains unclear. Besides specific renal injuries, general hypoxia, renal blood flow alterations and biotrauma may be involved [1]. These mechanisms support the strong link between respiratory parameters of mechanical ventilation, renal perfusion and AKI occurrence, leading to the organ-crosstalk concept of cardio-pulmonary-renal interactions [2]. This old concept [3–5] is emphasized by positive pressure ventilation by increasing intra-thoracic pressures and then venous congestion [6, 7]. To date, no large analysis has been performed in the daily real-ICU life, in particular focusing on this triple interaction including venous congestion, low renal perfusion and mechanical ventilation settings.
In the present study, we aim to describe the effect mechanical ventilation and its settings on worsening of renal function and its interaction with hemodynamics in a large cohort of patients admitted to the ICU.
Patients and methods
The MIMIC-III database
MIMIC-III (Medical Information Mart for Intensive Care III) is a large, freely-available database comprising deidentified health-related data associated with over sixty thousands patients who stayed in critical care units of the Beth Israel Deaconess Medical Center between 2001 and 2012 [8]. The database also contains records of all laboratory values, nursing progress notes, intravenous medications, fluid intake/output, and other clinical variables. Other clinical data were added to the database including pharmacy provide order entry records, admission and death records, discharge summaries, International Classification of diseases, 9th Revision (ICD-9) codes, and imaging and electrocardiographic reports.
Selection of patients
We included in the present analysis all the patients who were 18 years old or older, admitted for the first time in the ICU and who did not had a planned surgery. We also excluded all patients with a diagnosis of chronic kidney disease (CKD, ICD-9 code 585.9) and those who did not have any KDIGO [9] information at day-1. Last we excluded all patients who had KDIGO-3 AKI at ICU admission.
In the second analysis, we selected among the first study sample all the patients who had central venous pressure assessment available both at day-1 and day-2.
Outcomes
The main outcome was multinomial including the following modalities: worsening of renal function (WRF), ICU death, discharge alive without WRF and still at risk without WRF. WRF was defined by AKI occurrence or worsening (increase of at least one KDIGO-category over time) at the different time points. The first outcome taken into account was the first outcome met.
Data collected
All data have been extracted from the MIMIC-III database using custom PostgreSQL (PostgreSQL Global Development Group) queries. Demographics data were retrieved at ICU admission, including age, gender, weight, ethnicity, vital status at ICU and hospital discharge, and ICU lengths of stay. Severity scores included SAPS III and SOFA at ICU admission [10, 11]. Respiratory (positive end-expiratory pressure [PEEP] and mean airway pressure [Paw]) and hemodynamic (mean arterial blood pressure [mABP], central venous pressure [CVP]) parameters were collected as maximal and mean values each day. Mean perfusion pressure was calculated as the difference between mABP and CVP. We also calculated daily time-weighted means for these parameters to better reflect the relationship between exposure duration and importance of the parameter (a detailed explication of this calculation is provided in the supplementary material). Moreover, we calculated the time-weighted mean-PEEP over day-1 and day-2 to take into account the exposure during day-1 in the landmark-2 model. mean perfusion pressure was calculated using row data and aggregates were calculated afterwards. The respiratory status (mechanical ventilation yes/no) and the need for a vasopressor support (norepinephrine, epinephrine, vasopressin, dopamine) as well as an inotropic support by dobutamine were collected daily. Blood gas exchanges data were collected using the worst values of PaO2/FiO2 ratio and PaCO2. All these parameters were collected both at day-1 and day-2. We also collected daily fluid balance by computing all the intakes and the urine output. We calculated a daily cumulative fluid balance since ICU admission as well.
The KDIGO classification was evaluated using the maximal blood creatinine level each day and the weight-normalized urine output every 6 hours. Renal replacement therapy (RRT) was collected as well. As the MIMIC-III database does not include pre-admission creatinine level, we performed a back-calculation of serum creatinine assuming that patients without CKD would have a glomerular filtration rate in normal range, defined by 75mL/min/1.73m2. The use of nephrotoxic agents was collected using the list previously published [12] and treated as a binary variable in the multivariable model.
Infection criteria were collected from ICD-9 codes according to the Angus criteria [13], as previously described [14].
Statistical analysis
Descriptive statistics were presented as median [interquartile] and n (%) for continuous and categorical variables, respectively. Comparisons between groups of PEEP (no mechanical ventilation – treated as the reference - , PEEP <5, between 5 and 8 and > 8 cmH2O) were performed using the Chi-square test and Jonckheere’s test for qualitative and quantitative variables, respectively. The Jonckheere’s test allows comparisons of quantitative variables across more than two ordered categories [15].
Data modelling
To take into account repeated assessments of renal function as well as hemodynamic and respiratory parameters over time, we performed a landmark analysis (Figure 1). We repeated a multinomial logistic regression (main outcome treated as a categorical variable with more than 2 categories, i.e. worsening of renal function (as defined above), death, discharged alive from ICU and still at risk) at the landmark times day 1 and day 2 with a 2–day sliding horizon, i.e. day 3 and 4, respectively. Patients classified as dead or discharged alive did not meet the outcome worsening of renal function and so died or were discharged alive free of renal worsening. At day 2, patients who previously met one of the multinomial outcomes were not included in the second multivariable model. The association measure, i.e. the relative risk ratio (RRR) for a given outcome should be interpreted versus both the reference category of the variable of interest and the reference outcome (i.e. discharged alive).
Figure 1. Analysis design.

To take into account individual repeated hemodynamic, respiratory and renal assessments, two multivariable models were performed at day-1 and day-2 (i.e. landmark times) with a sliding 2-day time window (horizon). The landmark model at day-1 takes measurement during day-1 and looks at the outcomes within day-3, i.e. during the following two days. The landmark model at day-2 takes measurements during day-2 among patients who did not meet one of the outcome at day-1 and looks at outcomes within day-4. In yellow are indicated the numbers of patients taken into account in the landmark model at day-1 while those taken into account in the landmark model at day-2 are shown in blue. Those who were taken into account in both models (i.e. patients who met one of the outcomes during day-3) are shown in green. The box with inclined lines at day-1 highlights the fact that patients who met the outcome during day-1 were not taken into account in the landmark model at day-2. Patients included in the day-2 model were those still at risk at day-2 (i.e. those who did not meet one of the possible outcomes within day-1). The multivariable model was a multinomial logistic regression to take into consideration an outcome with several categories.
Variables of interest
To evaluate the independent relationship between mechanical ventilation and outcomes, we used a two-steps approach:
First, we ran the model described above in the whole cohort using a binary variable “mechanical ventilation”, i.e. mechanical ventilation yes/no
Second, we selected the patients who received mechanical ventilation and ran a similar model (with the same covariates) using mechanical ventilation settings as to know: PEEP (as a continuous and categorized variable) and mean airway pressure (Paw) as categorized and continuous variable when available.
The assumptions of independence of irrelevant alternatives (using the Hausman-McFadden test) as well as non-perfect separation were verified.
Covariates
We included in all the multivariable models age (as a categorical variable), gender, the Charlson comorbidity score, ethnic origin, the use of nephrotoxic agents. In the day-1 landmark model, we also included the SAPS3 score (minus age) and the Angus’ sepsis criteria while we included the use of vasopressor and the reason for ICU admission in the landmark-2 model, as the formers have been specifically designed for the first day after ICU admission and could not be relevant in the second landmark model. The reason for ICU admission was derived from the main ICD code that was recorded. The presence of acute kidney injury at day-1 was also included in the second model. Fluid balance has been included in both models, using the cumulative fluid balance since ICU admission in the day-2 landmark model. In models focusing on mechanically ventilated patients, we also adjusted for the worst PaO2/FiO2 ratio and PaCO2 levels. In order to make our results easier to read, the estimates for the worst PaO2/FiO2 ratio (by 10 units decrease) and PaCO2 (by 5 mmHg increase) levels are given for a 5 and 10 units decrease, respectively.
Relevant interactions were tested.
Interactions between CVP, mABP and PEEP
We then selected patients with CVP measurement available at day-1 and day-2 and performed a similar analysis and added interaction terms as follows: PEEPxmABP, PEEPxCVP and PEEPxCVPxmABP, to accurately study the impact of these parameters on the outcome. Predicted probability of meeting AKI worsening criteria was calculated from the multivariable models.
Handling of missing data
Multiple imputations by chained equations were performed using the mice package to handle missing values (5% of data). We used the multinom function of the nnet package for the multinomial analysis.
All the analyses were performed using R (R version 3.4.3 (2017–11-30) -- “Kite-Eating Tree” Copyright (C) 2017 The R Foundation for Statistical Computing). A p value < 0.05 was considered significant.
Results
Among the 61,051 ICU patients included in the MIMIC-III database, 27,248 patients met the inclusion criteria and were included in the analysis (Figure 2).
Figure 2. Flow chart of the cohort selection.

Baseline characteristics
Patients were mostly male (56.0%) older than 60 years in 60.1% (Table 1). Median SAPS III score at admission was 38 [iqr 29, 52]. Main diagnoses are listed in the eTable1. ICU and hospital mortality reached 7.3 and 10.6%, respectively. At admission, 10,729 (39.4%) had no acute kidney injury while 6,926 (25.4%) and 9,593 (35.2%) suffered KDIGO1 or KDIGO2 AKI, respectively. The evolution of renal function over time is presented in eFigure1.
Table 1.
Baseline characteristics of the 27,248 patients included in the analysis
| Parameter | |
| Male gender | 15,258 (56.0) |
| Age, categories | |
| ≤ 50y | 6,179 (22.7) |
| ]50, 60] | 4,699 (17.2) |
| ]60, 70] | 5,398 (19.8) |
| > 70y | 10,972 (40.3) |
| African-american | 2,091 (7.8) |
| Charlson comorbities score | 2 [1,3] |
| SAPS III | 38 [29, 52] |
| SOFA score | 4 [2,6] |
| Day-1 clinical and biological data | |
| Worst PaCO2 level | 46 [41, 54] |
| Mean PaCO2 level | 41 [37, 45] |
| Worst PaO2/FiO2 ratio level | 166 [103, 260] |
| Mean PaO2/FiO2 ratio level | 302 [213, 430] |
| Mean central venous pressure | 10 [8, 13] |
| Mean arterial blood pressure | 77 [71, 85] |
| Current infection | 11,516 (42.3) |
| Current infection with acute organ dysfunction* | 7,745 (28.4) |
| ICU length of stay, day | 2.4 [1.2, 4.2] |
| ICU mortality | 1,996 (7.3) |
| Hospital mortality | 2,893 (10.6) |
Continuous variables are presented as median [interquartile]
Categorical variables are presented as n (%)
Results are calculated on available data
According to Angus’ definition, as previously described
Relationship between mechanical ventilation and outcomes
Among the 27,248 patients, 6,841 (25.1%) suffered a worsening of renal function while 8,248 (30.3%) were discharged alive and 417 (1.5%) died within day-3. 6,566 (24.1%) were mechanically ventilated at day-1. Patterns of missing values are shown in eFigure2. MV was independently associated with outcomes in the landmark-1 and −2 models (24.99 [20.03;31.2], 11.55 [6.7;19.89] and 8.15 [6.58;10.11] for being still at risk, dead or suffering worsening renal function at day-3, respectively) and (10.08 [5.74;17.71], 2.69 [0.91;7.91] and 7.08 [3.97;12.61] for being still at risk, dead or suffering WRF at day-4, respectively) (Table 2).
Table 2.
Relationship between mechanical ventilation and outcomes in mechanically ventilated patients.
| Relative Risk Ratio | |||
|---|---|---|---|
| Still at risk | Dead | WRF | |
| Day 1 mechanical ventilation on day-3 WRF | |||
| Male gender | 0.91 [0.79;1.04], (p=0.147) | 0.87 [0.56;1.37], (p=0.56) | 1.1 [0.99;1.22], (p=0.073) |
| Afro-american origin | 0.93 [0.73;1.17], (p=0.528) | 0.54 [0.19;1.52], (p=0.244) | 1.1 [0.92;1.3], (p=0.301) |
| Age | |||
| ≤ 50y | ref. | ref. | ref. |
| ]50, 60] y | 1.25 [1.01;1.54], (p=0.037) | 2.81 [1.1;7.21], (p=0.032) | 1.31 [1.12;1.53], (p=0.001) |
| ]60, 70] y | 1.56 [1.28;1.91], (p<0.001) | 5.82 [2.4;14.12], (p<0.001) | 1.66 [1.43;1.95], (p<0.001) |
| > 70 | 1.45 [1.2;1.74], (p<0.001) | 8.09 [3.51;18.66], (p<0.001) | 1.82 [1.58;2.1], (p<0.001) |
| Mechanical ventilation | 24.99 [20.03;31.2], (p<0.001) | 11.55 [6.7;19.89], (p<0.001) | 8.15 [6.58;10.11], (p<0.001) |
| SAPS 3 (minus age), per 1pt increase | 1.01 [1.01;1.01], (p<0.001) | 1.06 [1.05;1.07], (p<0.001) | 1.01 [1.01;1.01], (p<0.001) |
| Sepsis Angus’ criteria | 1.95 [1.68;2.26], (p<0.001) | 0.48 [0.29;0.82], (p=0.007) | 1.25 [1.1;1.41], (p<0.001) |
| Charslon score | 1.05 [1.02;1.09], (p=0.001) | 1.01 [0.91;1.13], (p=0.808) | 1.03 [1;1.06], (p=0.02) |
| Use of nephrotoxic agents | 0.40 [0.33;0.49], (p<0.001) | 6.73 [0.93;48.92], (p=0.059) | 0.48 [0.41;0.56], (p<0.001) |
| Fluid balance, per 1000mL increase | 1.09 [1.07;1.11], (p<0.001) | 1.02 [0.96;1.1], (p=0.508) | 1.04 [1.02;1.06], (p<0.001) |
| Day 2 mechanical ventilation setting on day-4 WRF | |||
| Male gender | 0.93 [0.67;1.28], (p=0.648) | 0.66 [0.3;1.45], (p=0.298) | 0.94 [0.68;1.32], (p=0.737) |
| Afro-american origin | 1.01 [0.55;1.86], (p=0.976) | 0.57 [0.2;1.65], (p=0.298) | 1.21 [0.65;2.26], (p=0.551) |
| Age | |||
| ≤ 50y | ref. | ref. | ref. |
| ]50, 60] y | 1.48 [0.9;2.43], (p=0.121) | 1.55 [0.37;6.53], (p=0.549) | 1.7 [1.01;2.85], (p=0.046) |
| ]60, 70] y | 1.28 [0.79;2.05], (p=0.312) | 1.37 [0.34;5.44], (p=0.655) | 1.44 [0.87;2.36], (p=0.152) |
| > 70 | 1.19 [0.76;1.86], (p=0.443) | 2.18 [0.67;7.08], (p=0.196) | 1.43 [0.9;2.29], (p=0.129) |
| AKI at day-1 | 1.45 [1.04;2.04], (p=0.029) | 3.57 [1.42;8.94], (p=0.007) | 2.6 [1.84;3.69], (p<0.001) |
| Mechanical ventilation | 10.08 [5.74;17.71], (p<0.001) | 2.69 [0.91;7.91], (p=0.072) | 7.08 [3.97;12.61], (p<0.001) |
| Mechanical ventilation duration during day-1 | 0.99 [0.97;1.01], (p=0.502) | 1.09 [1.03;1.16], (p=0.002) | 0.99 [0.97;1.01], (p=0.473) |
| Vasopressor support | 18 [8;44], (p<0.001) | 1.29 [0.68;2.46], (p=0.43) | 18 [7.9;44], (p<0.001) |
| Charslon score | 1.02 [0.94;1.11], (p=0.68) | 0.7 [0.52;0.95], (p=0.022) | 1.03 [0.94;1.12], (p=0.577) |
| Reason for ICU admission | |||
| Digestive disease | 0.6 [0.34;1.07], (p=0.083) | 0.25 [0.03;2.15], (p=0.207) | 0.68 [0.38;1.23], (p=0.203) |
| Respiratory disease | 0.49 [0.3;0.82], (p=0.006) | 0.72 [0.24;2.16], (p=0.554) | 0.6 [0.36;1], (p=0.05) |
| Trauma | 0.79 [0.5;1.25], (p=0.31) | 0.57 [0.19;1.74], (p=0.326) | 0.95 [0.6;1.53], (p=0.848) |
| Others | 0.6 [0.39;0.9], (p=0.015) | 0.34 [0.11;1.08], (p=0.066) | 0.63 [0.41;0.97], (p=0.035) |
| Use of nephrotoxic agents | 0.82 [0.57;1.18], (p=0.284) | 1.18 [0.47;2.95], (p=0.73) | 1.01 [0.99;1.03], (p=0.401) |
| Cumulative fluid balance since ICU admission, per 1000mL increase | 1.02 [1;1.04], (p=0.014) | 1.01 [0.97;1.05], (p=0.593) | 0.81 [0.56;1.18], (p=0.272) |
Multivariable multinomial logistic regression. The relative risk ratio should be interpreted as the association of mechanical ventilation and outcomes compared to not to be mechanically ventilated and to the outcome reference class (i.e. to be discharged alive without AKI). WRF: worsening renal function; PEEP: positive end-expiratory pressure. The relative risk ratio of 9.64 for mechanical ventilation should be interpreted as follows: The risk of worsening renal function within day-3 relative to being discharged alive from the ICU was 9.64-fold higher in mechanically ventilated patients than those not mechanically ventilated.
Relationship between mechanical ventilation settings at day-1 and worsening renal function within day-3
Among the 6,566 patients under mechanical ventilation at day-1, PEEP was missing in 743 cases. In multivariable analysis, increasing PEEP was independently associated with worsening renal function (Table 3 and eTable2). Similar results were obtained with Paw (eTable3).
Table 3.
Relationship between category of PEEP level and outcomes in mechanically ventilated patients.
| Relative Risk Ratio | |||
|---|---|---|---|
| Still at risk | Dead | WRF | |
| Day 1 mechanical ventilation on day-3 WRF | |||
| Male gender | 0.93 [0.6;1.46], (p=0.766) | 0.5 [0.2;1.25], (p=0.139) | 1.05 [0.67;1.66], (p=0.819) |
| Afro-american origin | 1.16 [0.55;2.47], (p=0.7) | 0.55 [0.07;4.56], (p=0.576) | 1.19 [0.55;2.56], (p=0.658) |
| Age | |||
| ≤ 50y | ref. | ref. | ref. |
| ]50, 60] y | 0.96 [0.53;1.73], (p=0.891) | 2.06 [0.44;9.66], (p=0.36) | 0.97 [0.53;1.77], (p=0.91) |
| ]60, 70] y | 1.58 [0.81;3.07], (p=0.18) | 9.66 [2.38;39.13], (p=0.001) | 2.04 [1.04;4.02], (p=0.039) |
| > 70 | 2.14 [1.17;3.9], (p=0.013) | 12.61 [3.43;46.39], (p<0.001) | 3.12 [1.7;5.76], (p<0.001) |
| PEEP level (by 1 cmH2O increase) | 1.32 [1.13;1.55], (p=0.001) | 1.29 [1.03;1.61], (p=0.024) | 1.36 [1.16;1.6], (p<0.001) |
| SAPS 3 minus age (by 1 unit increase) | 1.01 [1;1.02], (p=0.235) | 1.04 [1.02;1.06], (p<0.001) | 1.01 [1;1.03], (p=0.035) |
| Sepsis Angus’ criteria | 2.7 [1.72;4.22], (p<0.001) | 0.3 [0.11;0.82], (p=0.02) | 1.63 [1.03;2.57], (p=0.036) |
| Charslon score (by 1 unit increase) | 1.1 [0.97;1.24], (p=0.145) | 0.81 [0.6;1.09], (p=0.163) | 1.15 [1.01;1.3], (p=0.03) |
| Use of nephrotoxic agents | 1.2 [0.69;2.08], (p=0.52) | 6.83 [1.39;33.54], (p=0.018) | 1.44 [0.82;2.53], (p=0.21) |
| Worst PaCO2 (by 5mmHg increase) | 0.99 [0.98;1.01], (p=0.23) | 0.99 [0.97;1.02], (p=0.468) | 0.99 [0.98;1], (p=0.196) |
| Worst PaO2/FiO2 ratio (by 10 units decrease) | 1 [1;1], (p=0.254) | 1 [0.99;1], (p=0.279) | 1 [1;1], (p=0.341) |
| Fluid balance, per 1000mL increase | 1.03 [0.97;1.09], (p=0.373) | 0.96 [0.85;1.09], (p=0.514) | 1.01 [0.95;1.08], (p=0.661) |
| Day 2 mechanical ventilation setting on day-4 WRF | |||
| Male gender | 0.51 [0.17;1.52], (p=0.224) | 0.41 [0.09;1.79], (p=0.234) | 0.49 [0.16;1.49], (p=0.209) |
| Afro-american origin | 0.51 [0.1;2.46], (p=0.397) | 1.3 [0.67;2.55], (p=0.438) | 1.1 [0.23;5.38], (p=0.902) |
| Age | |||
| ≤ 50y | ref. | ref. | ref. |
| ]50, 60] y | 2.34 [0.25;22.19], (p=0.459) | 0.62 [0.14;2.73], (p=0.53) | 2.15 [0.22;20.86], (p=0.508) |
| ]60, 70] y | 0.67 [0.15;3.11], (p=0.614) | 0.71 [0.23;2.14], (p=0.543) | 0.82 [0.17;3.87], (p=0.804) |
| > 70 | 0.73 [0.19;2.88], (p=0.654) | 0.87 [0.19;4.02], (p=0.863) | 0.95 [0.24;3.8], (p=0.937) |
| AKI at day-1 | 1.15 [0.39;3.39], (p=0.795) | 2.48 [0.51;12.06], (p=0.262) | 2.07 [0.69;6.16], (p=0.193) |
| PEEP level over day-1 and day-2 (by 1 cmH2O increase) | 1.22 [0.92;1.62], (p=0.175) | 1.13 [0.78;1.63], (p=0.524) | 1.17 [0.88;1.56], (p=0.279) |
| Vasopressor support | 41 [21;81], (p<0.001) | 0.97 [0.5;1.86], (p=0.926) | 2.2 [1.35;3.56], (p=0.001) |
| Charlson score | 0.96 [0.73;1.27], (p=0.784) | 0.89 [0.69;1.15], (p=0.381) | 1.01 [0.76;1.34], (p=0.962) |
| Reason for ICU admission | |||
| Digestive disease | 0.21 [0.04;1.2], (p=0.08) | 0 [0;0], (p<0.001) | 2.01 [1.68;2.4], (p<0.001) |
| Respiratory disease | 0.34 [0.11;1.03], (p=0.058) | 0.55 [0.11;2.64], (p=0.452) | 0.93 [0.49;1.75], (p=0.812) |
| Trauma | 0.2 [0.08;0.52], (p=0.001) | 0.11 [0.02;0.49], (p=0.004) | 0.5 [0.27;0.92], (p=0.025) |
| Others | 0.37 [0.13;1.04], (p=0.06) | 0.12 [0.02;0.7], (p=0.019) | 0.38 [0.2;0.7], (p=0.002) |
| Use of nephrotoxic agents | 0.87 [0.27;2.82], (p=0.812) | 1.6 [0.28;9.31], (p=0.598) | 1.06 [0.32;3.49], (p=0.93) |
| Worst PaCO2 (by 5mmHg increase) | 1.11 [0.87;1.41], (p=0.422) | 0.72 [0.47;1.1], (p=0.125) | 1.07 [0.83;1.36], (p=0.616) |
| Worst PaO2/FiO2 ratio (by 10 units decrease) | 1.01 [0.97;1.06], (p=0.642) | 0.98 [0.91;1.05], (p=0.525) | 1 [0.96;1.05], (p=0.976) |
| Cumulative fluid balance since ICU admission, per 1000mL increase | 1.08 [1.01;1.14], (p=0.015) | 1.06 [0.98;1.15], (p=0.147) | 1.07 [1.01;1.13], (p=0.031) |
Multivariable multinomial logistic regression. The relative risk ratio should be interpreted as the association of the level of PEEP and outcomes compared to a 1 cmH2O lower PEEP level and to the outcome reference class (i.e. to be discharged alive without AKI). The relative risk ratio of 1.16 for the PEEP level should be interpreted as follows: The risk of worsening renal function within day-3 relative to being discharged alive from the ICU was 1.16-fold higher by 1 cmH2O increase of the PEEP level in mechanically ventilated patients. WRF: worsening renal function; PEEP: positive end-expiratory pressure.
Similar results were obtained after multiple imputation of missing values (eFigure 3). There was no significant interaction between the level of PEEP and the PaO2/FiO2 ratio.
Relationship between mechanical ventilation settings at day-2 and WRF within day-4
Increasing PEEP was positively associated with WRF but not significantly (Table 3 and eTable2). A similar association between Paw and worsening renal function was observed as well (n=4,182, eTable 3).
Relationship between PEEP categories and worsening renal function according to the level of mean perfusion pressure
Among the 27,248 patients included in the analysis, 4,936 (18.1%) had CVP available data at day-1 and day-2 allowing mean perfusion pressure calculation. Mean perfusion pressure decreased while central venous pressure increased over PEEP categories (eTable 4 and Figure 3). Moreover, the proportion of patients with a CVP>8mmHg increased across PEEP categories, regardless of the cardiovascular SOFA score (69.8, 72.3, 76.6 and 93.7% of patients, respectively, p for trend < 0.001) (eFigure 1 and eTable4).
Figure 3. Hemodynamic data at day-1 and day-2.
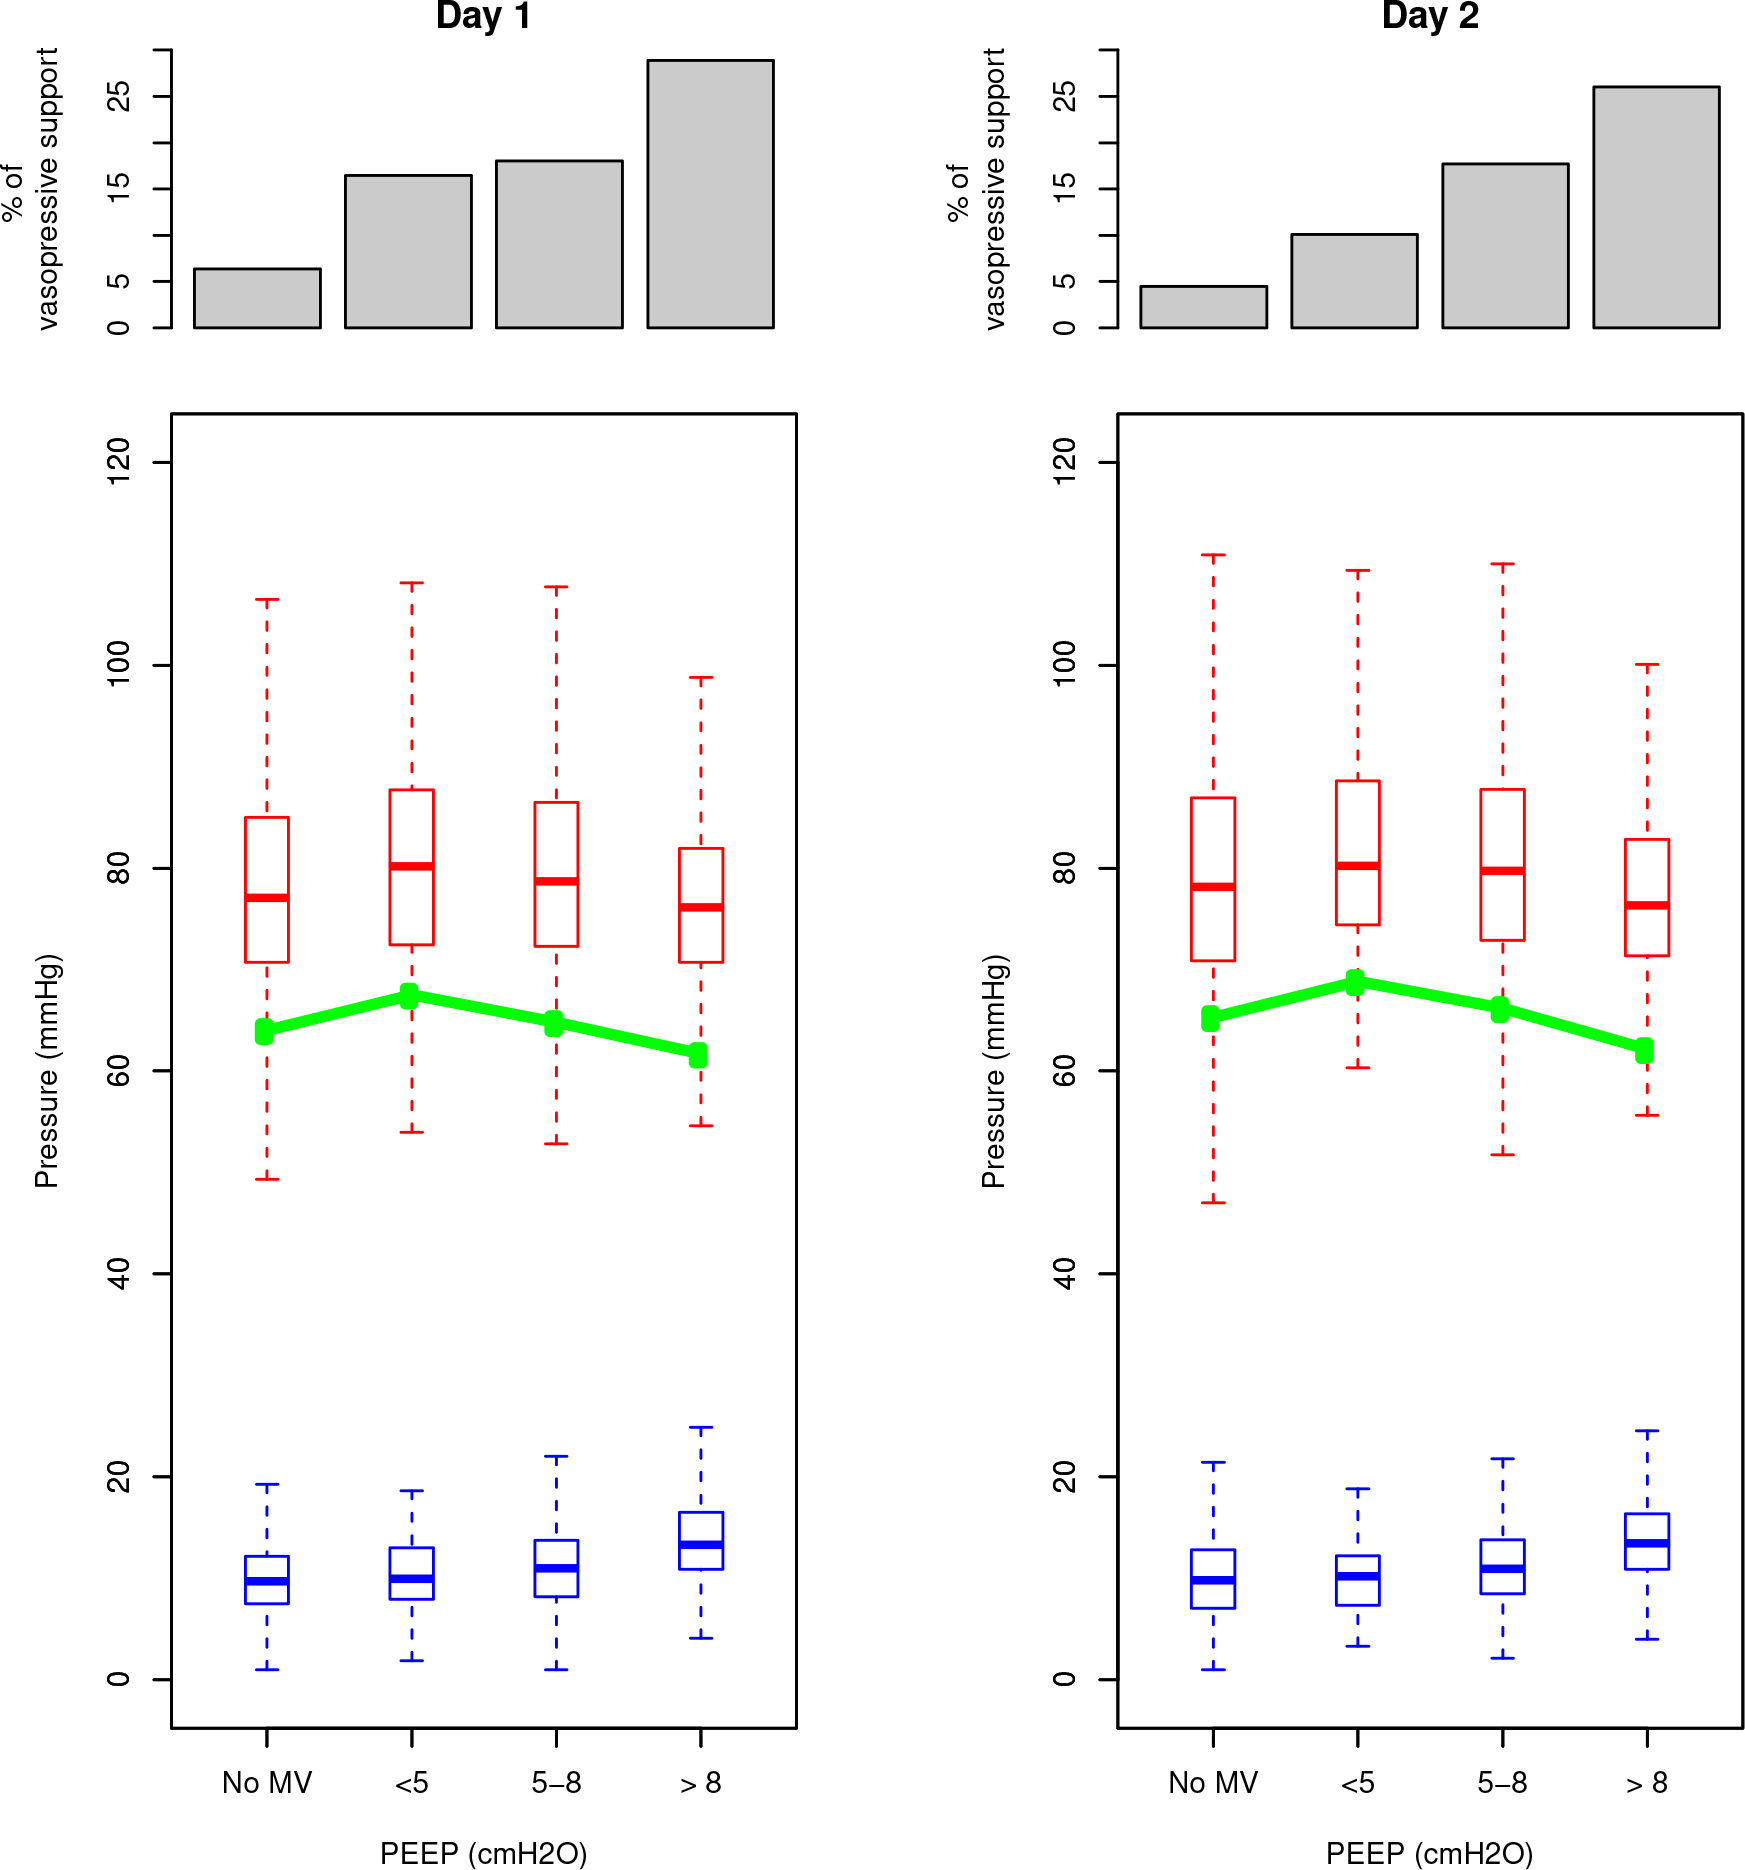
Patients are distributed in four groups of end-expiratory pressure (ZEEP, PEEP < 5, PEEP [5–8], PEEP >8). Histograms at the top of the figure show the proportion of patients receiving vasopressive support among the four groups. Box plots show mean arterial pressure (red boxes) and central venous pressure (blue boxes). The green connected line shows the mean perfusion pressure.
In multivariable analysis, mABP, CVP and PEEP were independently associated with WRF, as shown in Figure 4. The probability of worsening renal function increased when CVP and PEEP increased and when mABP decreased. All the double interactions (PEEPxmABP, PEEPxCVP, CVPxmABP) as well as the triple interaction were statistically significant for both models (p<0.001 for both).
Figure 4. Interaction between positive end-expiratory pressure, mean arterial blood pressure and central venous pressure on worsening renal function.

At the top of the plot is shown the calculated mean perfusion pressure [mean perfusion pressure] (i.e. mean arterial blood pressure minus central venous pressure). Below are plotted predicted probabilities of WRF at day-3 (middle) and at day-4 (bottom),calculated from multinomial logistic regressions adjusting for age, gender, ethnicity, SAPS3 score, PEEP, CVP, mABP (as continuous variables), use of vasopressors, use of nephrotoxic agents, reason for ICU admission, PaCO2 and PaO2/FiO2 ratio. Interactions PEEPxCVP, PEEPxmABP, CVPxmABP and PEEPxCVPxmABP were also included. The probability of WRF is plotted against these three variables according to a colour scale (green: low probability, red: high probability); probability thresholds (in percent) are indicated besides the blue lines as well.
Discussion
In the present study, we observed a strong relationship between mechanical ventilation, mechanical ventilation settings, i.e. positive end expiratory and mean airway pressures, and worsening of renal function at the very early phase of management of ICU patients. We also reported a strong interaction between positive respiratory pressure and hemodynamics on WRF occurrence, highlighting the negative impact of venous congestion on kidney function. While the relationship between mechanical ventilation settings and worsening renal function is supported by former physiological observations, its pathogenesis remains a matter of debate. Ventilator-induced kidney injury may be induced by at least three mechanisms: alterations of gases exchange, pulmonary inflammatory reaction and effect on systemic and renal blood flow [1, 16]. Regarding the latter, several recently reported papers suggested the impact of mean perfusion pressure on renal function in critically ill patients [17, 18]. We confirm this relationship and provide interesting insights in its pathogenesis: the impact of mean perfusion pressure on renal function is mediated by both an increase of central venous pressure and a decrease of mean arterial blood pressure and strongly interacts with the level of PEEP in mechanically ventilated patients. This emphasizes the concept of cardio-pulmonary-renal interactions relying on heart-lung interactions.
We observed a higher prevalence of congestion across PEEP groups and an independent relationship between CVP, PEEP and worsening renal function. Taken together, this suggests that AKI could be at least partly related to venous congestion. Our results at day-1 and day-2 highlight the complexity of the relationships between intra-thoracic pressures, transpulmonary pressures and renal perfusion as the impact of Paw remains significantly associated with WRF in both multivariable models while the effect of increasing PEEP was only significant at day-1, though positive at day-2. In experimental models, an increase in renal vein pressure or a renal vein compression were associated with a reversible renal dysfunction [19, 20]. In critically ill patients, a central venous pressure higher than 8 mmHg was associated with a decrease of microcirculatory and renal blood flow and an increase of AKI occurrence [21–23]. Ostermann et al recently reported that low mean perfusion pressure was associated with worsening renal functionin a cohort of 2,118 ICU patients but CVP seemed to be the sole independent predictor of renal outcome [24]. In the same manner, Chen KP et al observed an association between high CVP at admission and AKI occurrence [25]. Interestingly, right ventricular dysfunction is also a strong predictor of AKI occurrence [26].
Mechanisms underlying renal injury related to venous congestion remain imperfectly understood. The elevation of renal venous pressure leads to an increase of intratubular and peritubular capillary pressures in dogs [27]. Renal damage induced by such a mechanism is related to a decrease of oxygen delivery and has been demonstrated as the most important hemodynamic factor driving worsening renal function in decompensated patients with advanced heart failure [23]. However, this direct relationship may not be the sole explanation of the deleterious impact of venous congestion on renal function. In a recent rodent model of venous congestion using inferior vena cava ligation between the two renal veins, Shimada et al observed that venous congestion was not only associated with increased renal interstitial hydrostatic pressure but also with tubulointerstitial and glomerulal injury as well as medullary thick ascending limb hypoxia. Interestingly, renal injury persisted at day-3 while venous congestion was relieved. Additional mechanisms as extracellular matrix expansion, pericyte detachment and pericyte-myofibroblast transition promotion could contribute to explain these original findings [Shimada S Scientific reports 2018].
Besides venous congestion, a decrease in mean arterial blood pressure was independently associated with an increase of WRF occurrence and interacted also with the level of PEEP. This new demonstration of the heart-lung interactions confirms previous reports published for a long time [28][29]. Our findings highlight this complicated relationship and reinforce the impact of positive airway pressure on systemic hemodynamics leading to a decrease in renal perfusion and worsening renal function occurrence.
Our work presents some limitations. First, despite a very large number of data, we cannot be sure to have taken into consideration all potential confounders and the associations we observed may not be based on causality. We specifically did not have major measures as cardiac output or surrogates of renal blood flow. However, we tried to adjust for all the major confounders we believe are important in the ICU setting. Second, the overall severity of patients admitted to the ICU was not high, as shown by the quite low rate of mortality in this cohort of mechanically ventilated patients. This may limit the generalizability of our findings, especially in the most severe ICU patients. However, one could consider that what is reported in patients with low severity could be magnified in high severity. Such a selection of patients might explain the discrepancies we observed in the model we included mABP, CVP and PEEP in. The selection of patients with CVP measurement available both at day-1 and day-2 is a selection bias that limits the generalizability of our findings. Moreover, we cannot rule out these discrepancies rely on confounders we did not take into account as an elevated CVP directly reflects fluid overload of right ventricular failure. Third, we cannot exclude that patients discharged alive without worsening of renal function did not suffer the outcome after ICU discharge. Fourth, we cannot be sure the lack of evidence for a non-linear relationship between PEEP level and outcomes reflects the real association as we only found a significant association with the highest PEEP category when using PEEP as a categorical variable. Fifth, we were not able to use a classical competing risk analysis as the time in our dataset was collected as a discrete variable. However, the multinomial logistic regression is perfectly designed for such data [30]. Fifth, we were not able to discriminate the relative weight of confounders at day-1 and at day-3 on the timing of AKI occurrence. Last, the limited time horizon we chose may underestimate the relationship between the factors we collected and worsening renal function occurrence. However, this is in line with the previously described early onset of AKI in ICU patients [31] and the very quick impact of mechanical ventilation settings on renal function in both animal [32] and human [33] physiological studies. We cannot exclude this could impact the outcome occurrence.
Conclusion
In this large cohort of ICU patients, we observed a strong relationship between mechanical ventilation settings and worsening of renal function. This association relied at least partly on renal venous congestion generated by PEEP but perfusion deficit was also an independent predictor of worsening renal function. Further research should be lead to explore new ways of kidney protection in these patients.
140-character Tweet
Mechanical ventilation settings are strongly associated with worsening of renal function, relying on renal venous congestion and perfusion deficit.
Supplementary Material
Take-home messages.
We observed a strong relationship between mechanical ventilation settings and worsening of renal function. This association relied at least partly on renal venous congestion generated by PEEP but perfusion deficit was also an independent predictor of worsening of renal function.
Abbrevations
- ICU
intensive care unit
- mechanical ventilation
mechanical ventilation
Footnotes
Competing interest: none
Declaration
Ethics approval and consent to participate: not applicable
Consent for publication: all authors gave their consent to publish this manuscript
Availability of data and material:
the MIMIC-III database is open source
References
- 1.Kuiper JW, Groeneveld ABJ, Slutsky AS, Plötz FB (2005) Mechanical ventilation and acute renal failure. Critical Care Medicine 33:1408–1415. doi: 10.1097/01.CCM.0000165808.30416.EF [DOI] [PubMed] [Google Scholar]
- 2.Husain-Syed F, McCullough PA, Birk H-W, et al. (2015) Cardio-Pulmonary-Renal Interactions. JACC 65:2433–2448. doi: 10.1016/j.jacc.2015.04.024 [DOI] [PubMed] [Google Scholar]
- 3.Annat G, Viale JP, Bui Xuan B, et al. (1983) Effect of PEEP ventilation on renal function, plasma renin, aldosterone, neurophysins and urinary ADH, and prostaglandins. Anesthesiology 58:136–141. [DOI] [PubMed] [Google Scholar]
- 4.Farge D, La Coussaye De JE, Beloucif S, et al. (1995) Interactions Between Hemodynamic and Hormonal Modifications During Peep-Induced Antidiuresis and Antinatriuresis. Chest 107:1095–1100. doi: 10.1378/chest.107.4.1095 [DOI] [PubMed] [Google Scholar]
- 5.Hall SV, Johnson EE, Hedley-Whyte J (1974) Renal hemodynamics and function with continuous positive-pressure ventilation in dogs. Anesthesiology 41:452–461. [DOI] [PubMed] [Google Scholar]
- 6.Slutsky AS, Tremblay LN (1998) Multiple system organ failure. Is mechanical ventilation a contributing factor? Am J Respir Crit Care Med 157:1721–1725. doi: 10.1164/ajrccm.157.6.9709092 [DOI] [PubMed] [Google Scholar]
- 7.Ranieri VM, Giunta F, Suter PM, Slutsky AS (2000) Mechanical ventilation as a mediator of multisystem organ failure in acute respiratory distress syndrome. JAMA 284:43–44. [DOI] [PubMed] [Google Scholar]
- 8.Johnson AEW, Pollard TJ, Shen L, et al. (2016) Data Descriptor: MIMIC-III, a freely accessible critical care database. Scientific data 1–9. doi: 10.1038/sdata.2016.35 [DOI] [PMC free article] [PubMed] [Google Scholar]
- 9.KDIGO AKI Guideline Work Group (2012) KDIGO Clinical Practice Guideline for Acute Kidney Injury. Kidney Int Suppl 2:1–138. doi: 10.1038/kisup.2012.6 [DOI] [Google Scholar]
- 10.Vincent J-L, Moreno R, Takala J, et al. (1996) The SOFA (Sepsis-related Organ Failure Assessment) score to describe organ dysfunction/failure. On behalf of the Working Group on Sepsis-Related Problems of the European Society of Intensive Care Medicine. In: Intensive Care Med. pp 707–710 [DOI] [PubMed] [Google Scholar]
- 11.Moreno RP, Metnitz PGH, Almeida E, et al. (2005) SAPS 3—From evaluation of the patient to evaluation of the intensive care unit. Part 2: Development of a prognostic model for hospital mortality at ICU admission. Intensive Care Med 31:1345–1355. doi: 10.1007/s00134-005-2763-5 [DOI] [PMC free article] [PubMed] [Google Scholar]
- 12.Perazella MA (2012) Drug use and nephrotoxicity in the intensive care unit. Kidney Int 81:1172–1178. doi: 10.1038/ki.2010.475 [DOI] [PubMed] [Google Scholar]
- 13.Angus DC, Linde-Zwirble W, Lidicker J, et al. (2001) Epidemiology of severe sepsis in the United States: Analysis of incidence, outcome, and associated costs of care. 29:1303–1310. [DOI] [PubMed] [Google Scholar]
- 14.Johnson AEW, Aboab J, Raffa JD, et al. (2018) A Comparative Analysis of Sepsis Identification Methods in an Electronic Database*. Critical Care Medicine 46:494–499. doi: 10.1097/CCM.0000000000002965 [DOI] [PMC free article] [PubMed] [Google Scholar]
- 15.Jonckheere AR (1954) A distribution-free k-sample test against ordered alternativs. Biometrika 41:133–145. [Google Scholar]
- 16.Kuiper JW, Vaschetto R, Corte Della F, et al. (2011) Bench-to-bedside review: Ventilation-induced renal injury through systemic mediator release--just theory or a causal relationship? Crit Care 15:228. doi: 10.1186/cc10282 [DOI] [PMC free article] [PubMed] [Google Scholar]
- 17.Wong BT, Chan MJ, Glassford NJ, et al. (2015) Mean arterial pressure and mean perfusion pressure deficit in septic acute kidney injury. Journal of Critical Care 30:975–981. doi: 10.1016/j.jcrc.2015.05003 [DOI] [PubMed] [Google Scholar]
- 18.Saito S, Uchino S, Takinami M, et al. (2016) Postoperative blood pressure deficit and acute kidney injury progression in vasopressor-dependent cardiovascular surgery patients. Critical Care 1–8. doi: 10.1186/s13054-016-1253-1 [DOI] [PMC free article] [PubMed] [Google Scholar]
- 19.Firth JD, Raine AEG, Ledingham JGG (1988) Raised venous pressure: a direct cause of renal sodium retention in oedema? The Lancet 331:1033–1036. [DOI] [PubMed] [Google Scholar]
- 20.Winton FR (1931) The influence of venous pressure on the isolated mammalian kidney. The Journal of Physiology 72:49–61. [DOI] [PMC free article] [PubMed] [Google Scholar]
- 21.Schrier RW, Wang W (2004) Acute renal failure and sepsis. N Engl J Med 351:159–169. doi: 10.1056/NEJMra032401 [DOI] [PubMed] [Google Scholar]
- 22.Legrand M, Dupuis C, Simon C, et al. (2013) Association between systemic hemodynamics and septic acute kidney injury in critically ill patients: a retrospective observational study. Crit Care 17:R278. doi: 10.1186/cc13133 [DOI] [PMC free article] [PubMed] [Google Scholar]
- 23.Mullens W, Abrahams Z, Francis GS, et al. (2009) Importance of Venous Congestion for Worsening of Renal Function in Advanced Decompensated Heart Failure. JACC 53:589–596. doi: 10.1016/j.jacc.2008.05.068 [DOI] [PMC free article] [PubMed] [Google Scholar]
- 24.Ostermann M, Hall A, Crichton S (2017) Low mean perfusion pressure is a risk factor for progression of acute kidney injury in critically ill patients – A retrospective analysis. 1–7. doi: 10.1186/s12882-017-0568-8 [DOI] [PMC free article] [PubMed] [Google Scholar]
- 25.Chen KP, Cavender S, Lee J, et al. (2016) Peripheral Edema, Central Venous Pressure, and Risk of AKI in Critical Illness. Clinical Journal of the American Society of Nephrology 11:602–608. doi: 10.2215/CJN.08080715 [DOI] [PMC free article] [PubMed] [Google Scholar]
- 26.Chen C, Lee J, Johnson AE, et al. (2017) Right Ventricular Function, Peripheral Edema, and Acute Kidney Injury in Critical Illness. Kidney International Reports 2:1059–1065. doi: 10.1016/j.ekir.2017.05.017 [DOI] [PMC free article] [PubMed] [Google Scholar]
- 27.Gottschalk CW, MYLLE M (1956) Micropuncture study of pressures in proximal tubules and peritubular capillaries of the rat kidney and their relation to ureteral and renal venous pressures. The American Journal of Physiology 185:430–439. doi: 10.1152/ajplegacy.1956.185.2.430 [DOI] [PubMed] [Google Scholar]
- 28.Kumar A, Falke KJ, Geffin B, et al. (1970) Continuous positive-pressure ventilation in acute respiratory failure. N Engl J Med 283:1430–1436. [DOI] [PubMed] [Google Scholar]
- 29.Nanas S, Magder S (1992) Adaptations of the Peripheral Circulation to PEEP. 146:688–693. doi: 10.1164/ajrccm/146.3.688 [DOI] [PubMed] [Google Scholar]
- 30.Degeling K, Koffijberg H, Franken MD, et al. (2018) Comparing Strategies for Modeling Competing Risks in Discrete-Event Simulations: A Simulation Study and Illustration in Colorectal Cancer. Med Decis Making 39:57–73. doi: 10.1177/0272989X18814770 [DOI] [PMC free article] [PubMed] [Google Scholar]
- 31.Hoste EAJ, Lameire NH, Vanholder RC, et al. (2003) Acute Renal Failure in Patients with Sepsis in a Surgical ICU: Predictive Factors, Incidence, Comorbidity, and Outcome. Journal of the American Society of Nephrology 14:1022–1030. doi: 10.1097/01.ASN.0000059863.48590.E9 [DOI] [PubMed] [Google Scholar]
- 32.Gammanpila S, Bevan DR, Bhudu R (1977) Effect of positive and negative expiratory pressure on renal function. British Journal of Anaesthesia 49:199–205. [DOI] [PubMed] [Google Scholar]
- 33.Drury DR, Henry JP, Goodman J (1947) The effetcs of continuous pressure breathing on kidney function. J Clin Invest 26:945–951. doi: 10.1172/JCI101889 [DOI] [PMC free article] [PubMed] [Google Scholar]
Associated Data
This section collects any data citations, data availability statements, or supplementary materials included in this article.
Supplementary Materials
Data Availability Statement
the MIMIC-III database is open source