

Abstract
Background
Prior studies have evaluated clinical characteristics associated with opioid dose requirements in hospitalized patients with acute pancreatitis (AP) but did not incorporate morphologic findings on CT imaging.
Aims
We sought to determine whether morphologic severity on imaging is independently associated with opioid dose requirements in AP.
Methods
Adult inpatients with a diagnosis of AP from 2006 to 2017 were reviewed. The highest modified CT severity index (MCTSI) score and the daily oral morphine equivalent (OME) for each patient over the first 7 days of hospitalization were used to grade the morphologic severity of AP and calculate mean OME per day(s) of treatment (MOME), respectively. Multiple regression analysis was used to evaluate the association of MOME with MCSTI.
Results
There were 249 patients with AP, of whom 196 underwent contrast-enhanced CT. The mean age was 46 ± 13.6 years, 57.9% were male, and 60% were black. The mean MOME for the patient cohort was 60 ± 52.8 mg/day. MCTSI (β=3.5 [95% CI 0.3, 6.7], p = 0.03), early hemoconcentration (β = 21 [95% CI 4.6, 39], p = 0.01) and first episode of AP (β = −17 [95% CI −32, −2.7], p = 0.027) were independently associated with MOME. Among the 19 patients undergoing ≥ 2 CT scans, no significant differences in MOME were seen between those whose MCTSI score increased (n = 12) versus decreased/remained the same (n = 7).
Conclusion
The morphologic severity of AP positively correlated with opioid dose requirements. No difference in opioid dose requirements were seen between those who did versus those who did not experience changes in their morphologic severity.
Keywords: Acute pancreatitis, Morphology, Opioid, Contrast-enhanced computed tomography
Introduction
Pain management is one of the most important treatment objectives in patients hospitalized with acute pancreatitis (AP) [1]. In North America, opioids are utilized for this purpose in the majority of patients despite the lack of evidence supporting their use over non-opioid analgesics [2-5]. The quantity of daily opioids used impacts the dynamic pancreatitis activity score, particularly in patients with mild AP, and this has been reported to be associated with several important clinical outcomes in AP [6]. The widespread use of opioids for the treatment of conditions associated with acute pain in hospital settings is coming under greater scrutiny [7]. Even a single opioid prescription can lead to long-term use among opioid-naïve patients [8]. Recent data have shown that about 40% of opioid-naïve patients hospitalized with AP are discharged with opioids [9] and that 17% become persistent opioid users [10].
In order to appropriately identify potential interventions for reducing opioid use, the factors associated with inpatient opioid dose requirements must be identified. Prior studies have examined demographic and clinical factors associated with opioid dose requirements in AP, but none have evaluated the impact of morphologic changes on imaging [11-13]. A positive correlation between morphology and opioid dose requirements may offer clinicians additional tools for pain assessment beyond patient-reported scores. It would also be important to know if opioid use correlates with morphologic changes of AP as the direction of the relationship is not clear, especially in light of recent experimental data that show that opioid administration can worsen AP histology [14] and an administrative database study [15], admittedly with several limitations [16], that suggests that opioid exposure can cause AP.
The primary aim of this study was to evaluate risk factors, including morphology on imaging, for their association with opioid dose requirements over the first 7 days of hospitalization in patients with AP. The secondary aim was to determine if the opioid dose requirements resulted in changes in morphologic severity among the subgroup of patients undergoing ≥ 2 CT scans.
Methods
Study Design, Patient Population
We conducted a retrospective cohort study of all adult patients (≥ 18 years of age) who were admitted to our institution between 2006 and 2017 with a diagnosis of AP. These patients were identified using the International Classification of Diseases, Ninth Revision, Clinical Modification (ICD-9-CM) or Tenth Revision, Clinical Modification (ICD-10-CM), but diagnoses were confirmed and data were collected for all patients through review of the paper and electronic medical records.
Exclusion criteria included patients transferred from an outside hospital, those readmitted for AP within 2 weeks of discharge for a previous episode of AP, those requiring intubation with mechanical ventilation within the first 7 days and those with incomplete data, psychiatric comorbidities, cancer, end-stage renal disease, underlying chronic pancreatitis as defined by the presence of calcification(s) and/or a dilated main pancreatic duct (≥ 5 mm) on past or current abdominal imaging, no contrast-enhanced CT imaging over the first 7 days of hospitalization, chronic opioid (scheduled opioid use for longer than 3 months) and illicit drug use (Fig. 1). This study was approved by the Johns Hopkins Institutional Review Board for Human Research and complied with Health insurance Portability and Accountability Act (HIPAA) regulations.
Fig. 1.
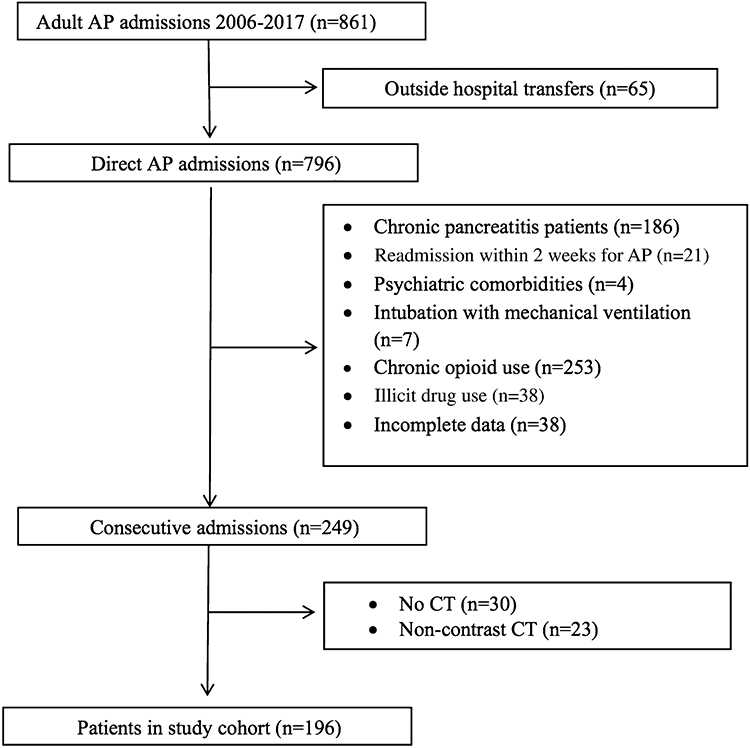
Flow diagram for patients included in the study cohort
Imaging Protocol and Analysis
CT scans were obtained on various Siemens® multidetector CT scanners. These studies were obtained using standard voltage (120 kVp) and current settings (290 mAs) and utilized Siemens® CareDose to reduce total radiation dose to the patient. The pancreas protocol is a dual-phase intravenous contrast-enhanced study. Iodinated contrast (up to 120 mL) is injected intravenously at 4–5 mL/sec, and the patient may receive an additional 1000 mL of water by mouth to serve as a neutral oral contrast agent. The arterial phase is bolus triggered based on peak enhancement of the aorta (20–30 s after contrast injection) and is obtained from the diaphragm through the iliac artery bifurcation. The venous phase is obtained 60 s after contrast injection, covering from the diaphragm through the pelvis. Thin axial data sets are obtained for both phases and multiplanar reconstructions are created for review and are saved in the picture archiving and communication system. An expert abdominal radiologist, blinded to the clinical data, reviewed all CT imaging studies obtained over the first 7 days of hospitalization and calculated the modified CT severity index (MCTSI) score. Pancreatic inflammation and pancreatic necrosis (depending on the degree) can each contribute up to 4 points to the MCTSI, while extrapancreatic complications can contribute up to 2 points. The morphologic severity of AP according to MCTSI is categorized as mild (0–2 points), moderate (4–6 points), or severe (8–10 points) [17]. The highest MCTSI score for each patient over the first 7 days was used for the analysis.
Definitions
AP was defined according to the revised Atlanta classification criteria as two or more of the following: characteristic abdominal pain, serum amylase or lipase levels three or more times the upper limit of normal and/or changes consistent with AP on abdominal imaging [18]. Hospitalization refers to the time period between presentation and discharge.
Systemic inflammatory response syndrome (SIRS) was defined by the presence of 2 or more of the following: temperature > 38 or < 36 degrees Celsius, heart rate > 90 beats per minute, respiratory rate > 20 respirations per minute or PaCO2 < 32 mmHg, and/or white blood cell count > 12,000 cells/mm3 or < 4000 cells/mm3 or > 10% band cells. Early hemoconcentration and early SIRS were defined as a hematocrit ≥ 44% and presence of SIRS within the first 24 h of hospitalization, respectively. The bedside index for severity in acute pancreatitis (BISAP) was used to assess prognosis [19-21]. SIRS was persistent if duration was > 48 h. Persistent (> 48 h) organ failure (POF) was defined as a Marshall score of ≥ 2 in the renal, pulmonary and/or cardiovascular system(s) [22]. Organ failure and SIRS were assessed each day during the first 7 days of hospitalization, based on the most extreme laboratory value and/or clinical measurement within any 24-hour period. Mortality was defined as death during hospitalization.
The medication administration record was reviewed to calculate the total opioid dose administered during the first 7 days of hospitalization. Using the CDC opioid conversion chart [23], this was converted to oral morphine equivalent (OME). This total OME was then divided by the number of days that opioids were administered in order to determine the mean OME per day(s) of treatment (MOME). For example, the administration of 100 mg, 40 mg, 30 mg, 20 mg and 10 mg of OME to a patient over 5 days of hospitalization, respectively, would equal a MOME of 40 mg/day. In those patients who underwent 2 or more CT scans, we also calculated the interval MOME which was defined as the total OME between the first two CT scans divided by the number of days of treatment between those two scans.
Statistical Analysis
Demographic and clinical characteristics at the time of presentation were reported using descriptive statistics, as proportions (percentages) for categorical variables and means (standard deviation) for continuous variables. Nonparametric tests were used when variables deviated from the normal distribution, and the results are shown as medians and interquartile ranges [IQRs]. The association between MOME and gender, race, alcohol, age-adjusted Charlson comorbidity index (ACCI), first episode of AP, the MCTSI within the first 72 h and the highest MCTSI over the first seven days of hospitalization, early SIRS and hemoconcentration were assessed with simple linear and multiple regression analyses. These variables were selected based on prior studies that established their association with opioid administration [11, 12]. Non-normal values were log 10 transformed to approximate a normal distribution. MOME was treated as a continuous variable. Multicollinearity was measured by variance inflation factors and tolerance, which were below 2. Furthermore, correlations between independent variables were tested using Pearson’s product–moment correlation. The risk of overfitting was controlled by using a ratio of 1:10, at least for the number of independent variables and sample size. A p-value < 0.05 was deemed significant. All statistical analyses were conducted using Stata version 15 (StataCorp LP, College Station, TX).
Results
A total of 861 adult AP admissions were identified between 2006 and 2017 using the ICD-9-CM and ICD-10-CM. There were 196 patients who met inclusion criteria (Fig. 1). There were 53 patients who were excluded due to the absence of contrast-enhanced CT imaging, among whom 23 underwent CT imaging but without contrast administration. These 53 excluded patients had similar demographic and clinical characteristics compared to those with mild MCTSI scores (data not shown). A total of 172 (88%) patients were discharged by day 7.
Table 1 shows demographic and clinical characteristics of the 196 patients in our cohort. The mean age was 46 ± 13.6 years, 113 (57.9%) were male and 117 (60%) were black. The mean duration of symptoms prior to presentation was 3 ± 1.5 days. The two most common etiologies for AP among all patients were alcohol and biliary at 55.8% and 20.5%, respectively. There were 1.5%, 30.7%, and 55.1% of patients with BISAP ≥ 3, early hemoconcentration and SIRS, respectively. Within the first week of presentation, 5.1% developed POF. Morphologically mild, moderate, and severe AP by MCTSI was found in 93 (47.4%), 91 (46.4%) and 12 (6.1%) patients, respectively, over the first 7 days of hospitalization.
Table 1.
Demographic and clinical characteristics of study cohort (n = 196)
| Age, y | 46 ± 13.6 |
| Male sex | 113 (57.9) |
| Race | |
| Black | 117 (60) |
| White | 59 (30.2) |
| Hispanic | 16 (8.2) |
| Other | 3 (1.5) |
| Etiology | |
| Alcohol | 109 (55.8) |
| Biliary | 40 (20.5) |
| Idiopathic | 21 (10.8) |
| Other | 25 (12.8) |
| Smoking | |
| Never smoker | 90 (46.1) |
| Current smoker | 80 (41) |
| Former smoker | 20 (10.2) |
| First episode of acute pancreatitis | 117 (60) |
| Duration of symptoms before presentation, days | 3 ± 1.5 |
| Age-adjusted Charlson comorbidity index | 2 [1, 4] |
| Measures of prognosis | |
| Early hemoconcentration | 60 (30.7) |
| Early SIRS | 108 (55.1) |
| BISAP ≥ 3 | 3 (1.5) |
| Measures of severity | |
| Persistent SIRS | 66 (33.8) |
| Persistent organ failure | 10 (5.1) |
| ICU admission | 8 (4) |
| Death | 1 (0.5) |
Data presented as numbers (%), mean ± SD and median [interquartile range]
SIRS systemic inflammatory response syndrome, BISAP bedside index of severity in acute pancreatitis
All 196 included patients had contrast-enhanced CT within 72 h of presentation among whom 19 had additional contrast-enhanced CT scans between hospital days 3–7. Only two patients had > 2 CT scans but there was no change in MCTSI scores. Among those 19 patients who had repeat CT, 1 had a lower MCTSI, 6 had the same MCTSI, and 12 had higher MCTSI scores with an average increase of 4 points. Among those with repeat CT scans, MOME was not significantly different between patients with increased MCTSI versus those with decreased/unchanged MCTSI scores (88.3 ± 80 vs 65.9 ± 36.8 mg/day, p = 0.8) over the first 7 days of hospitalization. The interval MOME between the first and second scans was not significantly different in those who had increased MCTSI scores on the second CT scan versus those who had decreased/unchanged MCTSI scores (83.9 ± 94 vs 50.9 ± 40 mg/day; p = 0.3).
Figure 2 illustrates daily MOME over the first 7 days of hospitalization for the study cohort. The overall mean MOME for the cohort was 60 ± 52.8 mg/day. There were 18 patients who did not receive any opioid analgesics during the first 7 days of hospitalization.
Fig. 2.

Daily mean OME over the first seven days of hospitalization. n = number of patients receiving opioids on that day. OME, oral morphine equivalent
Table 2 shows the simple linear and multiple regression analyses of variables associated with MOME using both MCTSI within the first 72 h and the highest MCTSI within the first 7 days of hospitalization. Male gender, black race, alcohol etiology, ACCI, and early SIRS were not associated with MOME on either the simple linear or multiple regression analyses. Patients with early hemoconcentration had, on average, a 21 mg increase in MOME (β = 21 [95% CI 4.6, 39], p = 0.01); patients with an increase in MCTSI score (each increment of 2 points) had, on average, a 3.5 mg increase in MOME (β = 3.5 [95% CI 0.3, 6.7], p = 0.03); and patients experiencing their first episode of AP had, on average, a 17 mg decrease in MOME (β = −17 [95% CI −32, −2.7], p = 0.027) than those experiencing a recurrent AP episode over the first 7 days of hospitalization after adjusting for all other variables. Figure 3 illustrates the mean MOME according to the highest MCTSI over first 7 days of hospitalization.
Table 2.
Simple linear and multiple regression analyses of factors associated with MOME for the study cohort (n = 196)
| Variable | MCTSI score within 72 h of hospitalization |
Highest MCTSI score in 7 days |
||||||
|---|---|---|---|---|---|---|---|---|
| Simple linear regression |
Multiple regression |
Simple linear regression |
Multiple regression |
|||||
|
β coefficient [95%CI] |
p value |
β coefficient [95% CI] |
p value |
β coefficient [95%CI] |
p value |
β coefficient [95% CI] |
p value | |
| Gender (male) | 3 [−12, 18] | 0.4 | −5.7 [−21, 10] | 0.4 | 3 [−12, 18] | 0.4 | −6.4 [−12, 10] | 0.4 |
| Race (black) | −8 [−24, 6.3] | 0.2 | 5 [−5.5, 15] | 0.35 | −8 [−24, 6.3] | 0.2 | −10 [−5.5, 15] | 0.1 |
| Alcohol | 3.6 [−11, 18] | 0.6 | 2.3 [−13, 18] | 0.7 | 3.6 [−11, 18] | 0.6 | 5 [−11, 21] | 0.4 |
| Age-adjusted CCI | −5 [−20, 9] | 0.4 | 0.3 [−3, 3.5] | 0.8 | −5 [−20, 9] | 0.4 | 0.2 [−3, 3.5] | 0.9 |
| First episode of AP | −14 [−29, 0.7] | 0.054 | −18 [−33, −2.7] | 0.021 | −14 [−29, 0.7] | 0.054 | −17 [−32, −2.7] | 0.027 |
| MCTSI (every 2 points) | 4.3 [1.06, 7.6] | 0.01 | 3.4 [0.07, 6.7] | 0.04 | 4.6 [1.5, 7.7] | 0.004 | 3.5 [0.3, 6.7] | 0.03 |
| Early SIRS | −10 [−25, 4] | 0.1 | −9.6 [−23, 6] | 0.2 | −10 [−25, 4] | 0.1 | −7 [–22, 6] | 0.2 |
| Early hemoconcentration | 24 [8.4, 40] | 0.003 | 23 [6.4, 40] | 0.007 | 24 [8.4, 40] | 0.003 | 21 [4.6, 39] | 0.01 |
CCI Charlson comorbidity index, CI confidence interval, AP acute pancreatitis, MCTSI modified CT severity index, SIRS systemic inflammatory response syndrome, β regression coefficient
Fig. 3.

Mean MOME according to the highest MCTSI over first 7 days of hospitalization. OME oral morphine equivalent, MCTSI modified CT severity index. The line is indicating the best fitted line (β = 4.6 [95% CI 1.5, 7.6]; p = 0.004)
Discussion
Our study shows that the morphologic severity of AP on CT imaging, early hemoconcentration and first episode of AP are independently associated with opioid dose over the first 7 days in patients hospitalized with AP. To our knowledge, this is the first study to show a positive association between morphologic severity of AP and opioid dose requirements in patients hospitalized for AP, regardless of whether the CT scan used for analysis was within 72 h or the CT scan showing the highest MCTSI score within the first 7 days of hospitalization. We have also shown, in a smaller subset of patients undergoing 2 or more CT scans, that there was no significant difference in the total opioid dose requirement or the interval dose requirement between the two scans among those with increased versus decreased/unchanged morphologic severity.
Despite the well-established correlation between early hemoconcentration and necrosis [24, 25], we did not find collinearity between early hemoconcentration and MCTSI based on a Pearson’s product-moment correlation (r2 = 0.2). This is likely because the MCTSI score also incorporates extrapancreatic complications such as pleural effusion, ascites and gastrointestinal involvement [17], thus weakening the association between MCTSI and early hemoconcentration alone. We chose the MCTSI over the original CT Severity Index because the MCTSI has been shown to have a greater correlation with clinical outcomes [26]. Since MCTSI is broadly utilized by practicing radiologists, has been validated in several studies and given the paucity of studies evaluating the morphologic changes of AP and their association with opioid use, we felt that this would be the optimal radiologic scoring system for our study.
Previous studies have focused on clinical factors associated with opioid administration in AP. An Italian prospective study showed higher rates and longer duration of opioid use in patients with severe compared to mild AP [13]. The results may be less generalizable to North America as opioids are, in general, less commonly used for analgesia in Europe [2]. In addition, this study had several limitations including utilization of the original Atlanta classification to define severe AP and the lack of adjustment for possible confounders including pre-existing chronic pain and substance abuse. Subsequent studies [11, 12] addressed these issues by using the revised Atlanta classification and accounting for confounders, but they still did not incorporate the findings on imaging.
While prior experimental data showed that opioid administration results in worsened histologic severity of AP [14], our results suggest these microscopic changes do not appear to correlate with morphologic changes on imaging in patients. We evaluated 19 patients who underwent two or more CT scans during the first 7 days of hospitalization and did not find a significant difference in opioid dose administered between the 12 patients with increased versus the seven patients with decreased or unchanged morphologic severity. There was also no significant difference between these groups with regard to the opioid dose requirements between CT scans. These are small numbers of patients but the lack of a significant difference in the opioid dose administered between these two groups of patients is worth highlighting. It is important to emphasize that opioid administration can result in elevated lipase levels in patients due to spasm of the sphincter of Oddi, findings that were once utilized for the now defunct Nardi test [27] and are also the presumptive explanation for lipase elevations in patients treated with the weak opioid eluxadoline [28, 29]. What remains unclear is how frequently opioid induced sphincter of Oddi spasm is accompanied by unequivocal changes of AP on imaging which is arguably the criterion standard for AP. This impacts all studies in AP as imaging is variably utilized and clinical criteria (i.e., upper abdominal pain and pancreatic enzyme elevations) lack specificity for AP [30].
There are three clinical implications of our study. First, it provides support for morphologic severity on imaging as a biomarker of pain in AP, thus offering an additional clinical tool to assess analgesic requirements beyond patient-reported pain intensity scores. Since non-opioid analgesics are effective in treating pain in patients with mild AP [31, 32], a patient with pain but mild morphologic severity and who is experiencing their first episode of AP could potentially be treated with either non-opioids or low-dose opioid analgesics. This could have a substantial systemic impact on reducing opioid analgesic use and dose since most patients have mild AP. Second, imaging may have prognostic potential in anticipating total opioid requirements over the course of hospitalization for AP. Since all of our patients underwent a CT scan in the first 72 h of hospitalization and the majority of our patients (88%) were discharged over the first 7 days of hospitalization, early morphologic severity effectively correlates with the total opioid dose administered during hospitalization. Furthermore, the median length of stay and MOME in our patient cohort were similar to previous studies [33, 34]. While only 19 patients underwent 2 or more CT scans over the first 7 days of hospitalization, our multiple regression model showed that use of the highest MCTSI score did not result in any change in the β coefficients for any of our significant variables. Third, our study lends support for a future study to investigate if type of opioid administered actually worsens AP morphologic severity as we did not find a significant difference in the total or interval opioid dose administered between patients with increased versus decreased/unchanged morphologic severity over 2 CT scans.
Our study has several strengths. First, we relied on hospital opioid administration records, which tend to be highly accurate due to federal and state regulations. Second, we used a validated assessment of morphologic severity in AP and incorporated all the clinical variables that are known to be associated with opioid administration in AP in our multivariable model. Third, the strict exclusion criteria we used should have minimized confounding by reducing the number of patients who might have had non-AP related needs for opioids. Fourth, we included patients over recent years, thus increasing the overall generalizability of our results since opioid prescription patterns have likely changed as the opioid crisis in the USA has garnered more attention and regulatory oversight.
There are several limitations to our study. First, our cohort included only 12 cases of severe AP by MCTSI thus limiting the generalizability beyond the moderate group. We suspect that we had fewer severe AP patients because of exclusion of transferred patients due to concerns around incomplete records and those who were intubated and placed on mechanical ventilation early in the course of their hospitalization as they may have received opioids for sedation. Second, we are at risk for selection bias by having excluded 53 patients since they did not undergo contrast-enhanced CT scans; however, we believe this was minimized because those 53 excluded patients had clinical and demographic characteristics similar to our mild MCTSI group. Third, alcohol was the etiology of AP for more than half of our patient cohort, which was predominantly composed of black patients. While this could limit the applicability of our results, the impact should be mitigated by the fact that alcohol is among the two most common causes of AP in Western countries [35]. Fourth, we used opioid administration as a surrogate marker for pain, but the majority of our patient cohort were not using scheduled opioids as inpatients (e.g., patient-centered analgesia pumps), and therefore, received opioids only on an as needed basis based on their reported pain intensity. Fifth, only one radiologist reviewed our imaging thus limiting our ability to account for interobserver variation.
In conclusion, morphologically severe AP is independently associated with opioid dose requirements. Among patients undergoing 2 or more CT scans, there was no significant difference in opioid dose requirements in those with increased versus decreased/unchanged morphologic severity.
Footnotes
Conflict of interest V.K.S. is a consultant for AbbVie and Nestle Health Science; medical advisory board participant for Cook Medical; and receives grant support from Orgenesis and Theraly. M.A.K. is a consultant for Boston Scientific, Olympus, and Medtronic.
The preliminary data for this study was presented as a poster during the 43rd Annual Meeting of the American Pancreatic Association in San Diego, CA on November 9, 2017.
References
- 1.Meng W, Yuan J, Zhang C et al. Parenteral analgesics for pain relief in acute pancreatitis: a systematic review. Pancreatology 2013;13:201–206 [DOI] [PubMed] [Google Scholar]
- 2.Matta B, Gougol A, Gao X et al. Worldwide variations in demographics, management, and outcomes of acute pancreatitis. Clin Gastroenterol Hepatol. 2019. 10.1016/J.CGH.2019.11.017. [DOI] [PMC free article] [PubMed] [Google Scholar]
- 3.Basurto Ona X, Rigau Comas D, Urrútia G. Opioids for acute pancreatitis pain. Cochrane Database Syst Rev. 2013. 10.1002/14651858.CD009179.pub2. [DOI] [PMC free article] [PubMed] [Google Scholar]
- 4.Elsevier. IAP/APA evidence-based guidelines for the management of acute pancreatitis. Pancreatology. 2013;13:e1–15. [DOI] [PubMed] [Google Scholar]
- 5.Grover AS, Mitchell PD, Manzi SF, Fox VL. Initial pain management in pediatric acute pancreatitis: opioid versus non-opioid. J Pediatr Gastroenterol Nutr. 2018;66. Available from: https://journals.lww.com/jpgn/Fulltext/2018/02000/Initial_Pain_Management_in_Pediatric_Acute.26.aspx. [DOI] [PubMed] [Google Scholar]
- 6.Buxbaum J, Quezada M, Chong B, et al. The pancreatitis activity scoring system predicts clinical outcomes in acute pancreatitis: findings from a prospective cohort study. Am J Gastroenterol. 2018;113. Available from: https://journals.lww.com/ajg/Fulltext/2018/05000/The_Pancreatitis_Activity_Scoring_System_predicts.19.aspx. [DOI] [PMC free article] [PubMed] [Google Scholar]
- 7.Wood E, Simel DL, Klimas J. Pain management with opioids in 2019–2020. JAMA 2019;322:1912–1913 [DOI] [PubMed] [Google Scholar]
- 8.Deyo RA, Hallvik SE, Hildebran C et al. Association between initial opioid prescribing patterns and subsequent long-term use among opioid-naïve patients: a statewide retrospective cohort study. J Gen Intern Med 2017;32:21–27 [DOI] [PMC free article] [PubMed] [Google Scholar]
- 9.Yang AL, Jin DX, Srivoleti P, Banks PA, McNabb-Baltar J. Are opioid-naive patients with acute pancreatitis given opioid prescriptions at discharge? Pancreas 2019;48. Available from: https://journals.lww.com/pancreasjournal/Fulltext/2019/11000/Are_Opioid_Naive_Patients_With_Acute_Pancreatitis.27.aspx. [DOI] [PubMed] [Google Scholar]
- 10.Ahmed A, Yakah W, Freedman SD, Kothari DJ, Sheth SG. Evaluation of opioid use in acute pancreatitis in absence of chronic pancreatitis: absence of opioid dependence an important feature. Am J Med. 2020. 10.1016/j.amjmed.2020.03.010. [DOI] [PubMed] [Google Scholar]
- 11.Wu BU, Butler RK, Chen W. Factors associated with opioid use in patients hospitalized for acute pancreatitis. JAMA Netw Open 2019;2:e191827–e191827 [DOI] [PMC free article] [PubMed] [Google Scholar]
- 12.Parsa N, Faghih M, Garcia Gonzalez F, et al. Early Hemoconcentration Is associated with increased opioid use in hospitalized patients with acute pancreatitis. Pancreas. 2019;48. Available from: https://journals.lww.com/pancreasjournal/Fulltext/2019/02000/Early_Hemoconcentration_Is_Associated_With.9.aspx. [DOI] [PubMed] [Google Scholar]
- 13.Pezzilli R, Uomo G, Gabbrielli A et al. A prospective multicentre survey on the treatment of acute pancreatitis in Italy. Dig Liver Dis 2007;39:838–846 [DOI] [PubMed] [Google Scholar]
- 14.Barlass U, Dutta R, Cheema H, et al. Morphine worsens the severity and prevents pancreatic regeneration in mouse models of acute pancreatitis. Gut. 2018;67:600 LP–602. [DOI] [PubMed] [Google Scholar]
- 15.Kim J, Tabner AJ, Johnson GD, Brumback BA, Hartzema A. Increased risk of acute pancreatitis with codeine use in patients with a history of cholecystectomy. Dig Dis Sci 2020;65:292–300 [DOI] [PubMed] [Google Scholar]
- 16.Singh VP. Paradoxical pain from opioids: increased risk of acute pancreatitis. Dig Dis Sci 2020;65:13–14 [DOI] [PMC free article] [PubMed] [Google Scholar]
- 17.Mortele KJ, Wiesner W, Intriere L et al. A modified CT severity index for evaluating acute pancreatitis: improved correlation with patient outcome. Am J Roentgenol 2004;183:1261–1265 [DOI] [PubMed] [Google Scholar]
- 18.Banks PA, Bollen TL, Dervenis C, et al. Classification of acute pancreatitis—2012: revision of the Atlanta classification and definitions by international consensus. Gut. 2013;62:102 LP–111. [DOI] [PubMed] [Google Scholar]
- 19.Wu BU, Johannes RS, Sun X, Tabak Y, Conwell DL, Banks PA. The early prediction of mortality in acute pancreatitis: a large population-based study. Gut. 2008;57:1698 LP–1703. [DOI] [PubMed] [Google Scholar]
- 20.Papachristou GI, Muddana V, Yadav D, et al. Comparison of BISAP, Ranson’s, APACHE-II, and CTSI Scores in predicting organ failure, complications, and mortality in acute pancreatitis. Am J Gastroenterol. 2010;105:435–41. [DOI] [PubMed] [Google Scholar]
- 21.Singh VK, Wu BU, Bollen TL, et al. A Prospective Evaluation of the Bedside Index for Severity in Acute Pancreatitis Score in Assessing Mortality and Intermediate Markers of Severity in Acute Pancreatitis. Am J Gastroenterol. 2009;104. Available from: https://journals.lww.com/ajg/Fulltext/2009/04000/A_Prospective_Evaluation_of_the_Bedside_Index_for.26.aspx. [DOI] [PubMed] [Google Scholar]
- 22.Marshall JC, Cook DJ, Christou NV, Bernard GR, Sprung CL, Sibbald WJ. Multiple organ dysfunction score: a reliable descriptor of a complex clinical outcome. Crit Care Med. 1995;23. Available from: https://journals.lww.com/ccmjournal/Fulltext/1995/10000/Multiple_Organ_Dysfunction_Score_A_reliable.7.aspx. [DOI] [PubMed] [Google Scholar]
- 23.Calculating total daily dose of opioids for safer dosage [Internet] Available from: https://www-cdc-gov.proxy1.library.jhu.edu/drugoverdose/pdf/calculating_total_daily_dose-a.pdf.
- 24.Baillargeon J-D, Orav J, Ramagopal V, Tenner S, Banks PA. Hemoconcentration as an early risk factor for necrotizing pancreatitis. Am J Gastroenterol. 1998;93. Available from: https://journals.lww.com/ajg/Fulltext/1998/11000/Hemoconcentration_as_an_early_risk_factor_for.26.aspx. [DOI] [PubMed] [Google Scholar]
- 25.Brown A, Orav J, Banks PA. Hemoconcentration is an early marker for organ failure and necrotizing pancreatitis. Pancreas. 2000;20. Available from: https://journals.lww.com/pancreasjournal/Fulltext/2000/05000/Hemoconcentration_Is_an_Early_Marker_for_Organ.5.aspx. [DOI] [PubMed] [Google Scholar]
- 26.Banday IA, Gattoo I, Khan AM, Javeed J, Gupta G, Latief M. Modified computed tomography severity index for evaluation of acute pancreatitis and its correlation with clinical outcome: a tertiary care hospital based observational study. J Clin Diagn Res. 2015;9:TC01–TC5. [DOI] [PMC free article] [PubMed] [Google Scholar]
- 27.Lobo DN, Takhar AS, Thaper A, Dube MG, Rowlands BJ. The morphine-prostigmine provocation (Nardi) test for sphincter of Oddi dysfunction: results in healthy volunteers and in patients before and after transduodenal sphincteroplasty and transampullary septectomy. Gut 2007;56:1472–1473 [DOI] [PMC free article] [PubMed] [Google Scholar]
- 28.Lembo AJ, Lacy BE, Zuckerman MJ et al. Eluxadoline for Irritable bowel syndrome with diarrhea. N Engl J Med 2016;374:242–253 [DOI] [PubMed] [Google Scholar]
- 29.Harinstein L, Wu E, Brinker A. Postmarketing cases of eluxadoline-associated pancreatitis in patients with or without a gallbladder. Aliment PharmacolTher 2018;47:809–815 [DOI] [PubMed] [Google Scholar]
- 30.Rompianesi G, Hann A, Komolafe O, Pereira SP, Davidson BR, Gurusamy KS. Serum amylase and lipase and urinary trypsinogen and amylase for diagnosis of acute pancreatitis. Cochrane Database Syst Rev. 2017. 10.1002/14651858.CD012010.pub2 [DOI] [PMC free article] [PubMed] [Google Scholar]
- 31.Ince AT, Senturk H, Singh VK et al. A randomized controlled trial of home monitoring versus hospitalization for mild non-alcoholic acute interstitial pancreatitis: a pilot study. Pancreatology. 2014. 10.1016/j.pan.2014.02.007. [DOI] [PubMed] [Google Scholar]
- 32.Bedia G, Ali D, Mustafa S, Özgür K, Ertan S. Pain treatment in patients with acute pancreatitis: a randomized controlled trial. Turk J Gastroenterol 2019;27:192–196 [DOI] [PubMed] [Google Scholar]
- 33.Herzig SJ, Rothberg MB, Cheung M, Ngo LH, Marcantonio ER. Opioid utilization and opioid-related adverse events in nonsurgical patients in US hospitals. J Hosp Med 2014;9:73–81 [DOI] [PMC free article] [PubMed] [Google Scholar]
- 34.Peery AF, Crockett SD, Murphy CC et al. Burden and cost of gastrointestinal, liver, and pancreatic diseases in the United States: update 2018. Gastroenterology 2019;156:254–272.e11 [DOI] [PMC free article] [PubMed] [Google Scholar]
- 35.Lowenfels AB, Maisonneuve P, Sullivan T. The changing character of acute pancreatitis: epidemiology, etiology, and prognosis. CurrGastroenterol Rep 2009;11:97–103 [DOI] [PubMed] [Google Scholar]