

Abstract
Despite the considerable impact of stroke on both the individual and on society, a neuroprotective therapy for stroke patients is missing. This is partially due to the current lack of a physiologically relevant human in vitro stroke model. To address this problem, we have developed a luminescent human iPSC-derived neurospheroid model that enables real-time read-out of neural viability after ischemia-like conditions. We subjected 1- and 4-week-old neurospheroids, generated from iPSC-derived neural stem cells, to 6 h of oxygen–glucose deprivation (OGD) and measured neurospheroid luminescence. For both, we detected a decrease in luminescent signal due to ensuing neurotoxicity, as confirmed by conventional LDH assay and flow cytometric viability analysis. Remarkably, 1-week-old, but not 4-week-old neurospheroids recovered from OGD-induced injury, as evidenced by their reduced but overall increasing luminescence over time. This underscores the need for more mature neurospheroids, more faithfully recapitulating the in vivo situation. Furthermore, treatment of oxygen- and glucose-deprived neurospheroids with the pan-caspase inhibitor Z-VAD-FMK did not increase overall neural survival, despite its successful attenuation of apoptosis, in a human-based 3D environment. Nevertheless, owing to its three-dimensional organization and real-time viability reporting potential, the luminescent neurospheroids may become readily adopted in high-throughput screens aimed at identification of new therapeutic agents to treat acute ischemic stroke patients.
Supplementary Information
The online version contains supplementary material available at 10.1007/s13311-022-01212-z.
Keywords: iPSC, Neurospheroids, Oxygen–glucose deprivation, Bioluminescence, Neurotoxicity
Introduction
Stroke is one of the leading causes of death and disability worldwide [1]. Notwithstanding the impact of stroke on the patient’s quality of life and on society, the current treatment of ischemic stroke patients is limited to the administration of the thrombolytic agent tissue plasminogen activator or to mechanical clot retrieval by thrombectomy. However, only a small proportion of all acute ischemic stroke patients are eligible for last-mentioned treatments mainly due to the very narrow therapeutic time window after stroke onset [2].
In an urgent need to find new therapies, decades of research resulted in over a thousand of candidate neuroprotective drugs of which none have led to an effective therapy to date. Although considered promising in rodent models, many neuroprotective agents failed when translated to the clinic. Multiple reasons may account for this lack of success, such as deficiencies in animal studies or clinical trial design [3, 4], but it is equally clear that the predictive power of the systems currently used to model ischemic stroke in vitro should be questioned.
To study ischemic stroke in vitro, ischemic conditions are usually induced by chemical or enzymatic inhibition of metabolism or by more physiologically relevant oxygen and glucose deprivation (OGD), followed by the assessment of the viability and/or cytotoxicity through endpoint assays [5–11]. The vast majority of in vitro stroke research is based on the use of rodent cells, with rat primary neurons being the most common. However, as rodents and humans are separated by 80 million years of evolution, cellular and molecular differences exist [4]. In case of stroke, these differences are, for instance, reflected in a longer duration of excitotoxicity — a part of the ischemic cascade — for humans compared to mice [12]. It is therefore easy to understand that molecular targets identified in rodents might not all be present in humans. The few human-based systems that have been used to date in the field of stroke research, consist mainly of less physiologically relevant cancer cell lines, such as the neuroblastoma cell line, SH-SY5Y [13–16], and more relevant but difficult to obtain primary human brain slice preparations [17, 18]. Fortunately, the advent of induced pluripotent stem cell (iPSC)-technology has provided another cell source for generating human-based in vitro models with the ability to overcome the aforementioned limitations.
Besides the limited number of studies using brain slices, all knowledge acquired from in vitro stroke research is based on cells grown as a monolayer. However, it is well accepted that three-dimensional (3D) models are able to more faithfully recapitulate the in vivo human brain in terms of physiology, as compared to traditional 2D cell cultures. In 3D, cells are able to generate 3D projections and establish multiple interactions with other cells and cell types and extracellular matrix in a way that is more representative to the human brain [19]. Moreover, as shown by a recent study [20], the dimensionality of neural culture also seems to affect the response to damage induced by OGD, with 3D models being more resilient. Although 3D brain organoids have found their way into many research fields, their use in in vitro stroke research has been largely unexplored territory. Only recently, pioneering studies have exposed brain organoids to low oxygen levels, mainly to investigate the effect of hypoxia on neurodevelopment and corticogenesis [21–23].
Obviously, the stroke field will benefit from new physiologically relevant in vitro models complementing in vivo research to eventually improve the clinical translation of promising neuroprotective strategies. In this study, we developed and validated a new human-based model to facilitate in vitro stroke research using human iPSC-derived neurospheroid technology (Fig. 1). By means of an incorporated bioluminescent reporter, we have made it possible to directly read out the spheroid culture health condition after the induction of an ischemic-like event in real time. To provide the proof-of-concept of this new model system, 1- and 4-week-old neurospheroids were subjected to OGD and analyzed both by luminescence measurements and various conventional methodologies. Furthermore, the (in) effectivity of Z-VAD-FMK, a caspase inhibitor, to confer neuroprotection was evaluated in this human model system.
Fig. 1.

General overview of the development and characterization of the luminescent neurospheroid model for in vitro stroke research. A Neurospheroids were generated starting from human neural stem cells (NSCs) that were differentiated from human iPSCs (hiPSCs). Obtained neurospheroids were characterized for their growth (size measurements) and cell composition (histological quantification using a spheroid array). B Luminescent neurospheroids were developed by genetic engineering of the hiPSC-derived NSC population using a lentiviral vector encoding a green fluorescent protein and firefly luciferase reporter open reading frame (ORF) (eGFP-T2A-fLuc) together with a puromycin resistance ORF, by puromycin selection. C Luminescent neurospheroids were subjected to OGD and validated as a model for in vitro stroke by luminescence measurements, LDH assay, flow cytometry, and histological analysis
Methods
Culture of Human Neonatal Foreskin Fibroblasts and Embryonic Stem Cell-derived Neural Progenitors
Both the neonatal foreskin fibroblasts and the embryonic stem cell-derived neural progenitors used in this study were newly obtained with confirmed origin. Human neonatal foreskin fibroblasts (ATCC, CRL-2522™) were cultured in RPMI supplemented with 15% heat-inactivated fetal bovine serum (FBS, Gibco), 1% sodium pyruvate (Gibco), and 1% penicillin–streptomycin (PS, Gibco). Human embryonic stem cell-derived neural stem cells (ENStem-A™ neural progenitor cells, EMD Millipore) were cultured in ENStem-A™ neural expansion medium supplemented with 2 mM L-glutamine (Gibco) and 20 ng/ml human fibroblast growth factor-2 (FGF-2, EMD Millipore) on poly-L-ornithine (20 µg/ml, Sigma-Aldrich) and laminin-coated (5 µg/ml, Merck Millipore) plates, according to the manufacturer’s instructions. Both cultures were maintained at 37 °C with 5% CO2 with medium changes every other day or every 2–3 days for the stem cells and the foreskin fibroblasts, respectively.
Generation and Culture of Human-induced Pluripotent Stem Cells
Human-induced pluripotent stem cells (hiPSCs) were generated by the reprogramming of neonatal foreskin fibroblasts (ATCC, CRL-2522™) using CytoTune®-iPS 2.0 Sendai Reprogramming Kit (Thermo Fisher) according to the manufacturer’s instructions. Obtained hiPSCs were further cultured feeder-free in Essential 8 Flex medium (Life Technologies) on Matrigel (Corning)-coated plates at 37 °C with 5% CO2. Medium was changed every other day.
hPSC ScoreCard Assay
Embryoid bodies (EBs) were generated from hiPSCs in Essential 6 medium (Life Technologies) in ultra-low attachment (ULA) 24-well plates (Sigma). RNA was extracted from hiPSC at day 0 and 14 of EB formation and used for the TaqMan™ hPSC ScoreCard™ assay (Thermo Fisher) which was performed according to the manufacturer’s instructions.
Generation and Culture of hiPSC-derived Neural Stem Cells
Neural stem cell (NSC) cultures were established from hiPSCs using a commercial Neural Induction Medium (Gibco) according to the manufacturer’s instructions with minor modifications. In brief, hiPSCs were plated at a density of 2.5 × 10⁵ cells per well of a Matrigel (Corning)-coated 6-well plate. 24h post-seeding, medium was switched to Neural Induction Medium (Neurobasal medium (Gibco), 1 × neural induction supplement (Gibco), 1% PS (Gibco)). After 7 days of neural induction, obtained hiPSC-derived NSCs (further annotated as hiPSC-NSC) were further cultured in complete Neural Expansion Medium (cNEM) (1:1 Advanced DMEM/F12 (Gibco):Neurobasal medium (Gibco), 1 × neural induction supplement (Gibco), 1% PS (Gibco)) in 6-well plates coated with Geltrex™ (Life Technologies). Cultures were maintained at 37 °C with 5% CO2 with medium changes every other day.
Copy Number Variation Sequencing
DNA libraries of hiPSC-NSCs were prepared using the NEXTflex Rapid DNA-seq kit (following option 2, with bead-based size selection prior to polymerase chain reaction amplification) and NEXTflex DNA barcodes (PerkinElmer), starting from 200 ng of DNA. Next, libraries were equimolarly pooled to a concentration of 4–6 nM. Cluster generation was completed using a cBot 2 system (Illumina), and sequencing was performed on a HiSeq 3000 device (Illumina) in a single-read 50-cycle run mode. The minimal number of reads per sample was set at 15 million (mean coverage of 0.25 ×). Demultiplexing was executed by the bcl2fastq software (Illumina). Reads were mapped to GRCh38 with bwa mem v0.7.17 [24] and duplicate reads were removed with Picard [25] MarkDuplicates v2.21.6. Afterwards, for sWGS, the log2(ratio) was called and processed with WisecondorX [26] v1.1.6 and visualized in Vivar [27] to allow detection of copy number variations (CNVs) larger than 50 kb.
Neural Differentiation of hiPSC-NSC
Neuronal and astrocyte differentiation was performed based on the protocol of Yan et al. [28], with minor adjustments. For neuronal differentiation, hiPSC-NSCs were grown onto poly-L-ornithine (20 µg/ml, Sigma) and laminin (10 µg/ml, Sigma)-coated well plates in neuronal differentiation medium (Neurobasal Plus medium (Gibco), 1 × B27 plus supplement (Gibco), 2 mM L-glutamine (Gibco), 1 × CultureOne supplement (Gibco), 200 µM ascorbic acid (Sigma), 1% PS (Gibco), 20 ng/ml brain-derived neurotrophic factor (BDNF), and glial cell line-derived neurotrophic factor (GDNF) (Immunotools)) for a minimum of 16 days. Medium was changed every 2–3 days. For astrocyte differentiation, hiPSC-NSCs were cultured on Geltrex-coated well plates in astrocyte differentiation medium (DMEM (Gibco), 1 × N2 supplement (Gibco), 2 mM L-glutamine (Gibco), 1% FBS (Gibco), 1% PS (Gibco)) for a minimum of 22 days. Medium was changed every 2–3 days.
Neurospheroid Formation and Culture
To generate single neurospheroids of reproducible size, hiPSC-NSCs were seeded at a density of 1.6 × 10⁴ cells per well in an ULA 96-well plate (Corning) in cNEM. The second or third day after plating, fresh medium was added. Cultures were maintained at 37 °C with 5% CO2 and from day 3 post-seeding onwards under constant orbital shaking (88 rpm). A half medium change was performed every other day and even every day upon long-term culture.
Spheroid Size Measurements
The diameter of the neurospheroids was measured every week for 5 weeks using a Fluovert Leitz microscope with CellSens Entry software v.2.1.
Immunofluorescence of 2D Cultures and Neurospheroids
All steps described hereafter were performed at room temperature (RT), unless stated otherwise. For the 2D cultures, cells grown on coverslips were fixed with 4% paraformaldehyde (PFA) for 20 min at 4 °C. After a washing step with phosphate-buffered saline (PBS), cells were permeabilized for 30 min using 0.1% (v/v) Triton X-100 (Sigma) in Tris-buffered saline (TBS) and blocked with blocking solution consisting of TBS with 20% serum of the corresponding secondary antibody host species for 1 h on a shaker. Cells were incubated (4 °C) overnight with the primary antibodies diluted in 10% (m/v) milk solution (Sigma) in TBS (Table 1). After a washing step and a subsequent 1 h incubation with the secondary antibodies in milk solution on a shaker (Table 2), cells were again washed and counterstained with DAPI (1 µg/ml, Sigma) for 10 min at 4 °C. After a final washing step with distilled water, the sample was mounted using ProLong® Gold antifade reagent (Thermo Fisher).
Table 1.
List of primary antibodies used for immunocytochemistry. (NA not available)
| Antibody | Host | Source | Final concentration | |
|---|---|---|---|---|
| A | Nanog | Rabbit | Life technologies (PA1-097) | 2 µg/ml |
| B | Oct3/4 | Mouse | Santa Cruz (sc-5279) | 2 µg/ml |
| C | Tra-1–60 | Mouse | Santa Cruz (sc-21705) | 1 µg/ml |
| D | Tra-1–81 | Mouse | Santa Cruz (sc-21706) | 1 µg/ml |
| E | SOX1 | Goat | R&D systems (AF3369) | 2 µg/ml |
| F | SOX2 | Rabbit | Merck Millipore (AB5603) | 2 µg/ml |
| G | Oct3/4 | Rabbit | Santa Cruz (sc-9081) | 2 µg/ml |
| H | Tuj1 | Mouse | R&D systems (MAB1195) | 2 µg/ml |
| I | GFAP | Rabbit | Abcam (ab7260) | 1–10 µg/ml |
| J | Ki67 | Rabbit | Abcam (ab15580) | 5 µg/ml |
| K | NeuN | Guinea pig | Merck Millipore (ABN90P) | 5 µg/ml |
| L | TBR2 | Rabbit | Abcam (ab23345) | 2–3 µg/ml |
| M | PAX6 | Mouse | Abcam (ab78545) | 20 µg/ml |
| N | Hop | Mouse | Santa Cruz (sc-398703) | 4 µg/ml |
| O | DCX | Rabbit | Abcam (ab18723) | 2 µg/ml |
| P | Cl. Casp-3 | Rabbit | Cell Signaling Technology (9661) | NA – 1/400 dilution |
Table 2.
List of secondary antibodies used for immunocytochemistry
| Antibody | Host | Conjugation | Source | Final concentration | In combination with |
|---|---|---|---|---|---|
| Anti-goat | Donkey | AF555 | Invitrogen (A21432) | 10 µg/ml | E |
| Anti-rabbit | Donkey | AF488 | Invitrogen (A21206) | 2 µg/ml | A, F, G, J |
| Anti-mouse | Goat | AF555 | Invitrogen (A21425) | 2 µg/ml | B, H, M, N |
| Anti-mouse | Goat | AF555 | Invitrogen (A21426) | 10 µg/ml | C, D |
| Anti-rabbit | Goat | FITC | Jackson ImmunoResearch (111–096-045) | 7.5 µg/ml | I, L, O |
| Anti-guinea pig | Donkey | Cy3 | Jackson ImmunoResearch (706–165-148) | 7.5 µg/ml | K |
| Anti-rabbit | Donkey | AF555 | Invitrogen (A31572) | 2 µg/ml | P |
Neurospheroids were fixed with 4% PFA for 150 min at RT. To allow high-throughput staining of neurospheroids, we adapted the spheroid micro-array technology described by Ivanov and Grabowska [29] (Fig. 2). The original approach arranges up to 66 spheroids into a gel-based array that subsequently becomes paraffinized and sectioned. However, paraffin embedding does not preserve reporter fluorescence and requires tedious (de)paraffinization and antigen retrieval steps. Therefore, we here describe a new protocol to generate cryosections of parallel-mounted spheroids, explained in detail hereafter.
Fig. 2.

Procedure of embedding neurospheroids in TissueTek-OCT to make cryosections of multiple neurospheroids arranged in an array
A silicone mold was made by imprinting a 3D printed mold-maker (Molecular Spectroscopy research group, University of Antwerp) onto liquid silicone (15 shore A, Henry Schein) (Fig. 2), leaving a mold of either 66 or 35 wells, depending on the mold-maker used for the corresponding size of the neurospheroids. TissueTek-OCT (VWR) was poured into the silicone mold, which was positioned in a metal histology base mold for stabilization. Before loading the neurospheroids, a centrifugation step (100 × g for 1 min) ensured that the OCT in the wells was free from air bubbles. Next, the neurospheroids, which had been incubating with 20% sucrose in distilled water overnight for cryoprotection purposes, were pipetted into the OCT in the individual wells. Following a final centrifugation step (100 × g for 1 min) to pellet all neurospheroids to the bottom of the wells, the OCT with neurospheroids in the silicone-histology base mold was snap-frozen in isopentane at a fixed temperature of − 50 °C using liquid N2. The resulting OCT-block was removed from the silicone mold and turned upside down in the histology base mold (i.e., peaks directing upwards). Another layer of TissueTek-OCT was poured on top of the OCT-peaks and frozen again. Cryosections of 10 µm were made on poly-L-lysine (Sigma)-coated glass slides making use of the NX70 cryostar cryostat (Thermo Scientific).
Hematoxylin and Eosin Staining
A hematoxylin and eosin (HE) staining of neurospheroid array slices was performed with Carazzi’s hematoxylin (0.1% (m/v) dissolved in 1:4 distilled water:glycerol 85% containing 105 mM KAl(SO4)2.12 H2O, 0.9 mM KIO3 Sigma) and eosin Y (1% (m/v) in distilled water, Sigma). Slides were stained for 2 min with hematoxylin, washed for 5 min with running water, and stained with eosin Y for 5 min. After dipping 5 times in distilled water, slides were dehydrated by 95% and 100% ethanol (each for 2 min) and xylene (10 min) and mounted using Eukitt mounting medium (Sigma).
Microscopy and Image Analysis
Microscopic images of all 2D cultures were obtained using a BX51 fluorescence microscope equipped with an Olympus DP71 digital camera using a 10 × (NA 0.30), 20 × (NA 0.50), or 40 × (NA 0.75) dry objective lens, except for the images of the hiPSC-NSC neuronal and astrocyte differentiation which were taken with a Leica SP8 confocal microscope using a 60 × (NA 1.4) oil objective lens. Microscopic imaging of the neurospheroid arrays was performed using an automated Nikon Eclipse Ti widefield fluorescence microscope using a 20 × (NA 0.75) dry objective lens. Fiji image analysis freeware was used for image processing and analysis (http://fiji.sc). Quantification of different markers was performed on a single, complete slice of a neurospheroid composed of stitched 20 × images. For nuclear marker (NeuN, Ki67, SOX1, SOX2) quantification, nuclei were segmented to obtain nuclear regions of interest (ROIs) and marker signal intensity was measured using the CellBlocks_v08.ijm ImageJ script (https://github.com/DeVosLab/CellBlocks) [30, 31]. In brief, nuclei were segmented in the DAPI channel after Laplacian-enhancement by means of an automatic threshold setting based on the Triangle algorithm [32]. ROIs were considered positive when exceeding a pre-set intensity threshold. For the quantification of the cytoplasm-based cleaved caspase-3 marker, the percentage of the complete neurospheroid area covered by cleaved caspase-3 staining was determined. To this end, the total area of caspase-3 positive signals was divided by the projected area of the entire slice after manual intensity thresholding.
Genetic Engineering of hiPSC-NSC
To generate a hiPSC-NSC line stably expressing the enhanced green fluorescent protein (eGFP) and firefly luciferase (Luc) reporters, the original hiPSC-NSC population was transduced with the LV_CMV-eGFP-T2A-fLuc-IRES-PuroR lentiviral vector containing the corresponding reporter open reading frames under the control of a constitutive immediate early human CMV (CMVie) promoter, obtained from the Leuven Viral Vector Core (LVCC, KU Leuven, Belgium) (Fig. S1) [33, 34]. The eGFP and luciferase positive hiPSC-NSC population (eGFP/Luc hiPSC-NSC) was enriched by means of a transient puromycin selection of 2 weeks (increasing the concentration from 0.2 to 2.0 µg/ml).
Flow Cytometry
Flow cytometric analyses were performed using the Epics XL-MCL analytical and CytoFLEX (Beckman Coulter) flow cytometer and data were analyzed using FlowJo software v.7.2.2. For the validation of eGFP expression by the eGFP/Luc hiPSC-NSC population, dead cells were stained with GelRed (Biotum) and excluded from the analysis. To determine the viability and the mean fluorescence intensity (MFI) of the eGFP signal of the neurospheroids, the neurospheroids were first dissociated by incubation in accutase for 5 min at 37 °C and subsequent trituration. Dead cells were stained with GelRed.
In Vitro Luminescence Measurements
To validate luciferase expression by the eGFP/Luc hiPSC-NSC population, eGFP/Luc hiPSC-NSC and wild-type hiPSC-NSC, serving as a negative control, were plated at equal density in a white 24-well VisiPlate (Perkin Elmer). After reaching confluence, Beetle luciferin (E1601, Promega) was added to the cell culture medium of the wells at a final concentration of 1.5 mg/ml for 10 min, and the luminescent signal was measured using the GloMax® Discover Microplate Reader (Promega). For eGFP/Luc neurospheroids, luminescent measurements were carried out in black ULA 96-well plates (Corning) after 48 h of incubation with 150 µg/ml Beetle luciferin. For the luminescence measurements of 2D-cultured eGFP/Luc hiPSC-NSCs in the context of the evaluation of Z-VAD-FMK, cells were incubated for 30 min with 150 µg/ml Beetle luciferin.
Determination of Lactate Dehydrogenase Release
The degree of cytotoxicity was assessed by colorimetric detection of LDH in culture supernatant after 15–20 min of incubation, using CytoTox 96® Non-Radioactive Cytotoxicity Assay (Promega) according to the manufacturer’s instructions. The culture medium background was subtracted from each measurement.
OGD Experiments
To mimic a stroke-like event, eGFP/Luc neurospheroids of 1- or 4-week-old were deprived from glucose and oxygen. The glucose- and oxygen-deficient conditions were achieved by incubating the spheroids in glucose-free cNEM (DMEM/F12 w/o L-glutamine, w/o HEPES, w/o glucose (VWR), 1xB27 (Gibco), human recombinant epidermal growth factor (rhEGF) and rhFGF-2 (20 ng/ml, Immunotools)) in a humidified Bactron IV anaerobic chamber (Shel Lab) or Whitley H45 HEPA Hypoxystation (Don Whitley Scientific) containing 5% CO2, 94.5–95.0% N2 and 0.0–0.5% O2. Immediately prior to the OGD at day 0 the luminescent signal of the neurospheroids was measured (i.e., pre-OGD measurement). Thereafter, plates with neurospheroids were placed into the anaerobic/hypoxic chamber, and four times a half medium change was performed with the glucose-free cNEM that had been pre-equilibrating in the chamber overnight. This step ensures the replacement of the oxygenated glucose-containing media by the oxygen- and glucose-free cNEM at the start of the incubation. The neurospheroids were incubated for 6 or 24 h. At the end of the OGD, glucose (4.5 mg/ml, Gibco) was administered and the plates were brought back to atmospheric O2 level (21% O2). The cultures were maintained for one additional week before they underwent a second in vitro luminescence measurement at day 7 after reoxygenation (i.e., post-OGD measurement). Control neurospheroids were subjected to the same manipulations but were kept under normoxia, and glucose was added immediately after the medium changes with the glucose-free cNEM.
Obtained luminescence data (in relative light units, RLU) were subsequently processed as follows: for each single neurospheroid, the measured RLU value post-OGD (i.e., post-OGD measurement) was normalized to the calculated mean of pre-OGD RLU values of all neurospheroids of the corresponding condition (i.e., pre-measurement). This approach of data analysis allows to visualize the variation in luminescent signal existing between the individual neurospheres at the start of the experiment, when compared to the approach in which each neurosphere was considered a single entity. The ratio is visualized as “fold change” in the graphs, thus representing the net fold increase or decrease in signal compared to the pre-OGD measurement. More information on the statistical analysis of these data can be found under “Data Representation and Statistical Analyses” of the material and methods section.
For the evaluation of the caspase inhibitor Z-VAD-FMK (Enzo Lifesciences and Bachem) in the neurospheroid culture, the compound was added to the culture medium at a final concentration of 25 µM at the start of OGD until day 2 or until day 7 post-OGD. For the evaluation of Z-VAD-FMK in the 2D culture, eGFP/Luc hiPSC-NSCs were seeded at 2.5 × 10⁴ cells/well in a black 96-well plate (Greiner) one day prior to the OGD and kept for a total of 2 days under continuous exposure of Z-VAD-FMK (25 µM).
EF5 Hypoxia Detection
To visualize hypoxia in the neurospheroids, EF5 reconstituted in DMSO (10 mg/ml) was added to the culture medium at a final concentration of 200 µM at the start of OGD. At the end of OGD, the neurospheroids were immediately fixed and cryosections were obtained as previously described. EF5 adducts were subsequently stained by incubation with EF5 Cy3-conjugated monoclonal antibody ELK3-51 (75 µg/ml) for 4 h at 4 °C, using the EF5 Hypoxia Detection Kit, Cyanine 3 (Merck Millipore) and counterstained with DAPI. The control neurospheroids were handled correspondingly.
Analysis of Caspase-3 Activity
Lysates were prepared by lysing neurospheroids (n = 15–20 per lysate) in caspase lysis buffer (1% NP-40, 200 mM NaCl, 10 mM Tris–HCl pH 7, 5 mM EDTA, 10% glycerol, freshly supplemented with 1 mM leupeptin, 0.1 mM aprotinin, and 1 mM PMSF) followed by collection of the supernatant after a centrifugation step for 15 min at maximum speed at 4 °C. The volume of lysates was adjusted to obtain a protein concentration of 2 µg/µl. Twenty microgram of protein was further diluted with CFS buffer (10 mM HEPES pH 7.5, 220 mM mannitol, 68 mM sucrose, 2 mM NaCl, 2 mM MgCl2, 2.5 mM KH2PO4, freshly supplemented with 1 mM leupeptin, 0.1 mM aprotinin, 1 mM PMSF, and 10 mM DTT) containing DEVD-AMC (50 µM, PeptaNova) up to a total volume of 150 µl. The caspase-3 activity for each lysate was measured using FLUOstar Omega fluorescence plate reader in duplicate or triplicate at intervals of 5 min. Lysates of neurospheroids treated with 0.5 µM staurosporine (SelleckChem) for 48 h were included as a positive control for caspase-3 activity.
Western Blot
Lysates of neurospheroids (n = 15–20 per lysate) were prepared as described above. Laemmli buffer was added to the lysate and the mixture was boiled for 10 min. Proteins were separated by SDS-PAGE and subsequently transferred to a nitrocellulose membrane through semi-dry blotting. The membrane was blocked using 5% non-fat dry milk solution in TBS buffer with 0.05% Tween-20 (TBST) for 1 h and incubated with the primary antibody against caspase-3 (1/1000; 9662, Cell Signaling Technology) at 4 °C overnight. After TBST washing steps, the membrane was incubated with HRP-conjugated secondary anti-rabbit antibody (1/3000, NA934V, Cytiva Lifesciences) for 1 h. Finally, the membrane was developed using Western Lightning Enhanced Chemiluminescence Substrate (Perkin Elmer). The immunoblotting procedure was repeated using a HRP-conjugated anti-β-actin antibody, after a stripping and extensive washing step of the membrane. Lysates of neurospheroids treated with 0.5 µM staurosporine (SelleckChem) for 48 h were included as a positive control for cleaved caspase-3.
Data Representation and Statistical Analyses
Graphs representing quantitative data were obtained using GraphPad Prism v.8.2.1 software. Statistical analyses were carried out using GraphPad Prism and statistical software JMP® Version 15.1.0 for analyzing the mixed-effects models. The choice between a parametric or non-parametric statistical test was based on the sample size (cut off n = 10) and the normality of the data (Shapiro–Wilk normality test). Specifically for applying linear mixed-effects models, the conditions on normality of residuals and homoscedasticity were primarily checked to be in an acceptable range to perform this type of analysis. A p value < 0.05 was considered statistically significant.
To validate the eGFP/Luc hiPSC-NSC population, the produced luminescence of the eGFP/Luc hiPSC-NSC population was compared to that of the wild-type hiPSC-NSC population, using a non-parametric Mann–Whitney U test. The same test was used to compare the LDH activity of neurospheroids under control versus OGD conditions. An independent samples t test was performed for the flow cytometry data to compare the proportion of viable cells and the mean fluorescence intensity of the eGFP-positive cell population between 2- and 5-week-old neurospheroids. For the luminescence in function of the mean diameter, differences in RLU-values between the different diameters were determined by a Kruskal–Wallis test. Growth of the neurospheroids (size measurements), the marker quantifications, the in vitro luminescence data of neurospheroids over time and the flow cytometric data of the OGD experiments were modeled using a linear mixed-effects model, entering the age or condition (i.e., control or 6 h OGD) of the neurospheroids as fixed effect. The non-independence between observations within the same experiment was accounted for by entering the independent experiments as random effects. To compare the flow cytometric data between control and OGD conditions with and without Z-VAD-FMK to evaluate this compound, either one-way ANOVA (data from single experiment) or a linear mixed-effects model (data from multiple experiments) was carried out. For the caspase-3 activity assay, an ANCOVA model was fitted to identify differences between conditions for their produced fluorescence over time, followed by pairwise comparisons between conditions of interest. p values for these pairwise comparisons were corrected for multiple hypothesis testing using the Bonferroni method.
With regard to the luminescence data of the OGD experiments, first significant differences between the RLU fold change of the pre-OGD measurement and post-OGD measurement were determined for every condition (i.e., control or OGD). In case data were derived from a single experiment, a Wilcoxon signed rank test or paired t test was used to this end. In case data were obtained by multiple experiments, a linear mixed-effects model was fitted entering timepoint of the luminescence measurement as fixed effect and again the independent experiments as random effect. Second, differences between conditions were identified, using the RLU fold changepost-OGD – RLU fold changepre-OGD values (∆RLU fold change), by means of either one-way ANOVA or Kruskal–Wallis (data from single experiment) or a linear mixed-effects model (data from multiple experiments). For the latter, condition (i.e., control, 6 h OGD (+ Z-VAD-FMK)) of the neurospheroids was entered as fixed effect and independent experiments as random effect.
Post-hoc analyses for ANOVA and linear mixed-effects models were carried out with Tukey HSD correction for multiple comparisons. For the post hoc analysis following the Kruskal–Wallis test, Dunn’s correction was used.
Results
Development and Characterization of Neurospheroids with Reproducible Growth and Differentiation Pattern
In order to develop a platform for in vitro stroke research, we set out to generate a robust human iPSC-derived neurospheroid model (Fig. 1a). Hereto, we first established a new hiPSC line from human neonatal foreskin fibroblasts and characterized the resulting hiPSC by means of immunocytochemistry (ICC) and qRT-PCR (Fig. S2). hiPSCs expressed the human pluripotent stem cell markers Oct3/4, SOX2, TRA-1–60, TRA-1–81, and Nanog (Fig. S2a). Trilineage differentiation potential was confirmed after embryoid body formation and subsequent qRT-PCR analysis demonstrating downregulation of pluripotency-associated transcripts and upregulation of ectoderm, mesoderm, and endoderm-associated transcripts (hiPSC scorecard assay, Fig. S2b).
Next, the obtained hiPSC line was differentiated into a self-renewable NSC population (further annotated as hiPSC-NSC) and subsequently validated for marker expression, differentiation potential, and genetic stability (Fig. 3). First, the marker expression profile of the generated hiPSC-NSCs was compared to that of the corresponding hiPSCs and foreskin fibroblasts from which they had been derived, as well as to a commercially available NSC line derived from human embryonic stem cells (ES-NSCs). By means of ICC (Fig. 3a), we show that the expression of SOX2 is maintained in the hiPSC-NSC population upon differentiation from hiPSC. Moreover, hiPSC-NSCs acquire expression of the neural stem cell marker SOX1 and lose expression of the pluripotency-associated Oct3/4 marker. None of these marker proteins were present in the original foreskin fibroblast population. This SOX1+ SOX2+ Oct3/4− marker profile is in accordance with the ES-NSC population. As a second validation, the differentiation potential of the hiPSC-NSC into neurons and astrocytes was evaluated (Fig. 3b). The expression of the neuronal marker Tuj1 and the astrocyte marker GFAP was demonstrated after applying specific neuronal and astroglial differentiation protocols, thereby confirming the multipotent differentiation potential of the derived hiPSC-NSCs. Finally, CNV sequencing revealed that the established hiPSC-NSCs did not display large genomic alterations, i.e., CNVs larger than 50 kb (Fig. 3c).
Fig. 3.

Validation of the NSC population derived from hiPSC (hiPSC-NSC). A Immunofluorescence of hiPSC-NSC. The hiPSC-NSC population is SOX1+, SOX2+, Oct3/4−, in accordance with the commercially available NSC population derived from human embryonic stem cells (hES-NSC). Human neonatal foreskin fibroblasts (HFFs) here represent the negative control for all markers, while hiPSCs were used as a positive control for SOX2 and Oct3/4 expression. This NSC marker profile was confirmed for different passage numbers by at least three different experiments. B Immunofluorescence of differentiated hiPSC-NSC. Differentiation of hiPSC-NSCs into neurons (Tuj1+) and astrocytes (GFAP+) at days 16 and 45, respectively. The differentiation into neurons and astrocytes had been confirmed by at least three additional experiments. C CNV sequencing profile of hiPSC-NSC. The CNV sequencing profile of hiPSC-NSC showing the distribution of all bins (indicated as black dots) around ratio 0, indicating a normal genetic constitution. (Deletions would be represented by a ratio of − 1, and duplications by a ratio of 0.58.)
We next generated neurospheroids by seeding hiPSC-NSCs at equal density in wells of an ULA 96-well plate. By means of their spontaneous self-assembling capacity, neurospheroids started to form from as early as 1 day post-seeding. Growth of the spheroids was monitored by weekly measurements of their diameter for five consecutive weeks (Fig. 4a, b). Spheroids reached sizes from a mean diameter of 689 ± 22 µm at week 1, up to 2339 ± 96 µm at week 5, growing with an average of 415 ± 9 µm per week (95% CI [380, 450], p = 0.0003). Additionally, as can be concluded from Fig. 4b, this procedure of generating neurospheroids was associated with a low level of variability in size between individual neurospheroids. Moreover, the growth of the spheroids was highly reproducible across different independent experiments.
Fig. 4.

Characterization of hiPSC-NSC-derived neurospheroids. A Representative bright-field microscopic images of 1- to 5-week-old (1–5 W) neurospheroids. Scale bar 500 µm. B Growth of neurospheroids over the course of 5 weeks by three independent experiments with n = 10 per experiment. For each experiment, the mean diameter with standard deviation is plotted and a regression line is fitted through the data points. C Representative immunofluorescent images (i.e., image with relative number of positive cells closest to the median value of the quantification data shown in E) of 2- and 4-week-old neurospheroids stained for the neuronal markers Tuj1, DCX and NeuN, the astrocyte marker GFAP, the proliferation marker Ki67, the NSC markers SOX1 and SOX2, and for the apoptosis marker cleaved caspase-3 (Cl. Casp-3). Second row represents a 100 × 100 µm inset at the selected region (white square) from upper row images. Scale bar 100 µm. D Detailed immunofluorescent images of neural rosette structures (arrowheads) present in 4-week-old neurospheroids. Scale bar 50 µm. E Quantification of NeuN, Ki67, SOX2, and SOX1 markers with respect to the total number of nuclei of 2- and 4-week-old neurospheroids from four independent experiments with n = 3 per experiment. The box plots indicate median and interquartile range; whiskers indicate the minimum and maximum values of all four independent experiments. The dots indicate the median value of each independent experiment. F Representative immunofluorescent images of 2- and 4-week-old neurospheroids stained for the radial glia marker PAX6, the intermediate progenitor marker TBR2, and the outer radial glia marker Hop. Second row represents a 100 × 100 µm inset at the selected region (white square) from upper row images. Scale bar 100 µm. ****p < 0.0001
Besides their growth, we characterized the obtained neurospheroids for different markers implicated in proliferation and differentiation into neurons and astrocytes by ICC. The dynamics of these markers were assessed in time by comparison of 2- and 4-week-old neurospheroids. As shown by representative IF images (Fig. 4c), the cells in neurospheroids spontaneously differentiated into neurons, with both immature (Tuj1+, DCX+) and mature (NeuN+) phenotypes. Quantification of the NeuN-positive cells did however not reveal an increase of this marker over time (p = 0.0638) (Fig. 4e). In contrast to neurons, neither 2 nor 4-week-old neurospheroids contained GFAP+ cells, suggesting a lack of astrocytes (Fig. 4c). Nevertheless, the neurospheroids showed a reduction in the SOX1+ (mean difference = 37%, CI [31, 44], p < 0.0001) and SOX2+ (mean difference = 40%, CI [35, 46], p < 0.0001) NSC population and a decreased proliferation potential, as shown by the reduction in the proliferation marker Ki67 (mean difference = 15%, CI [9, 21], p < 0.0001) over time (Fig. 4c, e). Despite the immature phenotype, this suggests ongoing differentiation as further supported by the presence of TBR2+ intermediate progenitors and Hop+ outer radial glia cells in 2- and 4-week-old neurospheroids (Fig. 4f), as well as the disappearance of the radial glia marker PAX6 expression in 4-week-old neurospheroids (Fig. 4f). In agreement with ongoing differentiation processes, staining for cleaved caspase-3 indicates ongoing apoptotic events in 2- and 4-week-old neurospheroids (Fig. 4c). Also note the distribution of the SOX1-, SOX2- and Ki67-expressing cells within the neurospheroids. Where these marker-expressing cells were widely dispersed in 2-week-old neurospheroids, they were more confined to particular stem cell niches in 4-week-old spheroids. These stem cell niches resemble typical neural rosette structures (Fig. 4d), which can be considered the in vitro equivalent of the invaginated neuroectoderm forming the neural tube in embryos.
Bioluminescence Allows Real-time Monitoring of Neurospheroid Growth and Viability
Most of the traditional cell growth, viability, and/or cytotoxicity assays (e.g., 3-(4,5-dimethylthiazol-2-yl)-2,5-diphenyl-2H-tetrazolium bromide (MTT) and lactate dehydrogenase (LDH) assay, flow cytometry, microscopy) are terminal endpoint assays and/or require disruption of neurospheroids into a single cell suspension. To enable a real-time read-out of neurospheroid growth and viability, we therefore stably introduced the firefly luciferase (Luc) reporter into our model through lentiviral vector transduction (Figs. 1b, and 5a). As the construct also contains the fluorescent eGFP reporter (Fig. 5b), the established hiPSC-NSC population will be further referred to as eGFP/Luc hiPSC-NSCs. To evaluate whether the introduced bioluminescent system can be applied to monitor the growth and/or viability of neurospheroids over time, weekly luminescence measurements were performed on the same group of spheroids for 5 consecutive weeks (Fig. 5c, d). Our results demonstrate that luminescent neurospheroids display a dynamic luminescence pattern, whereby a significant increase in luminescent signal is detected during the first 3 weeks of culture, followed by signal stabilization (weeks 3–4). When cultured for a longer period, a signal decrease is observed while still leaving a substantially high luminescent signal despite their increase in size over time (Fig. 5c, d, list of p values provided in Tables S1 and S2). The observed decrease in luminescent signal upon long-term culture most likely reflects gradual cell loss due to nutrient deprivation and reduced viability and altered cellular metabolism associated with the transition from immature to more mature neurospheroids (Fig. 4c, e, and f). Supporting this hypothesis, flow cytometric analysis of 2-week-old and 5-week-old neurospheroids demonstrated a decrease in the number of viable cells within the neurospheroids (Fig. 5e), as well as a decrease in the level of eGFP expression (Fig. 5f), which may reflect the altered cellular metabolism during the differentiation process. Clearly, the observed decrease in luminescent signal following long-term culture of neurospheroids is a highly complex multifactorial event that may require further investigation. Nevertheless, as the observed luminescent signal pattern displays high similarity over multiple experiments and remains substantially high over the course of 5 weeks, its potential use in evaluating spheroid survival following cellular stress will be further evaluated below.
Fig. 5.

Validation of the eGFP- and Luc-positive hiPSC-NSC population (eGFP/Luc hiPSC-NSC) and longitudinal luminescence measurements of eGFP/Luc hiPSC-NSC-derived neurospheroids. A Luminescence data of eGFP/Luc hiPSC-NSCs (n = 5) versus control hiPSC-NSCs (n = 5). B Flow cytometry data of eGFP/Luc hiPSC-NSCs (green) versus control hiPSC-NSCs (black) on expression of eGFP. C Luminescence data of eGFP/Luc hiPSC-NSC-derived neurospheroids (n = 30) over the course of 5 weeks by three independent experiments. The box plots indicate median and interquartile range; whiskers indicate the minimum and maximum values of all three independent experiments. The dots indicate the median value of each independent experiment (n = 30). A list of p values can be found in Table S1. D Luminescence data of eGFP/Luc hiPSC-NSC-derived neurospheroids (n = 12) in function of the mean diameter (µm) at weeks 1–5. A list of p values can be found in Table S2. E Proportion of viable cells in 2-week (2 W) (n = 12) and 5-week (5 W) (n = 35)-old neurospheroids determined by flow cytometry. F Mean fluorescence intensity (MFI) of eGFP-positive cell population in 2-week (2 W) (n = 12) and 5-week (5 W) (n = 35)-old neurospheroids determined by flow cytometry. **p < 0.01, ****p < 0.0001 (RLU, relative light units)
Monitoring of OGD-mediated Neurotoxicity Using Bioluminescence
To evaluate the use of the established luminescent neurospheroids as a model for the investigation of stroke-like events, we subjected 1- and 4-week-old neurospheroids to OGD (0.0–0.5% O2) (Fig. 1c). At first, neurospheroids were subjected to 6 or 24 h of OGD with corresponding luminescence measurements immediately before OGD (pre-OGD measurement) and 1 week after OGD (post-OGD measurement) (Fig. 6). For 1-week-old neurospheroids (Fig. 6a), control spheroids that did not undergo the OGD event displayed — as expected (see Fig. 5c) — a significant increase in luminescent signal at day 7, while this increase was significantly lower following 6 h of OGD (p < 0.0001) (see Table S3 for a complete list of p values). This was confirmed by four additional experiments (Fig. 7a and Table S4). In contrast, 24 h of OGD abolished the expected increase in luminescent signal (Fig. 6a). Similarly, for 4-week-old neurospheroids (Fig. 6b), control spheroids that did not undergo the OGD event displayed — as expected (see Fig. 5c) — a significant decrease in luminescent signal at day 7, while this decrease was significantly higher following 6 h of OGD (p < 0.0001) (Table S3), as confirmed by six additional experiments (Fig. 7f and Table S4). Again, after 24 h of OGD virtually, all luminescent signal was lost (Fig. 6b and Table S3). Based on these results, we decided to apply 6 h of OGD to all further experiments since neurospheroids should retain a certain degree of viability when applying a therapeutic intervention.
Fig. 6.

Luminescent neurospheroids subjected to different durations of OGD. A Luminescence measurements of 1-week-old (1 W) neurospheroids subjected to 6 h OGD (n = 29), 24 h OGD (n = 30), or control conditions (n = 29). The RLU data post-OGD (i.e., day 7) of each condition were normalized to the mean of pre-OGD data of the corresponding condition, represented as “fold change” in the graph. A complete list of p values can be found in Table S3. B Luminescence measurements of 4-week-old (4 W) neurospheroids subjected to 6 h OGD (n = 30), 24 h OGD (n = 29), or control conditions (n = 30). The RLU data post-OGD (i.e., day 7) of each condition were normalized to the mean of pre-OGD data of the corresponding condition, represented as “fold change” in the graph. A complete list of p values can be found in Table S3. ****p < 0.0001
Fig. 7.

Luminescent neurospheroids subjected to OGD. Left: 1-week-old (1 W) neurospheroids (A–E). Right: 4-week-old (4 W) neurospheroids (F–J). A Luminescence measurements of 1 W neurospheroids subjected to 6 h OGD (n = 15–30) or control conditions (n = 19–30) from four experiments. The RLU data post-OGD (i.e., day 7) of each condition were normalized to the mean of pre-OGD data of the corresponding condition, represented as “fold change” in the graph. The box plots indicate median and interquartile range; whiskers indicate the minimum and maximum values of all four experiments. The dots indicate the median value of each independent experiment. A complete list of p values can be found in Table S4. B LDH levels in the culture supernatants of control (n = 14) vs. 6 h OGD (n = 14) neurospheroids after 4 h of reoxygenation. Values represent the measured absorbance at 490 nm corrected for the background absorbance of the culture medium after 20 min. C Representative image of control and 6 h OGD spheroids stained for EF5 adducts after incubation of neurospheroids with hypoxic marker EF5 during normoxic or ischemia-like conditions, respectively. Scale bar 100 µm. D Percentage of viable cells determined by flow cytometry at day 7 for control (n = 12–15) and 6 h OGD (n = 12–15) neurospheroids by two independent experiments. The box plots indicate median and interquartile range; whiskers indicate the minimum and maximum values of two independent experiments. The dots indicate the median value of each independent experiment. E Representative light microscopic images of HE-stained control and 6 h OGD neurospheroids at day 7. Scale bar 200 µm. F Luminescence measurements of 4 W neurospheroids subjected to 6 h OGD (n = 29–30) or control conditions (n = 28–30) from six experiments. The RLU data post-OGD (i.e., day 7) of each condition were normalized to the mean of pre-OGD data of the corresponding condition, represented as “fold change” in the graph. The box plots indicate median and interquartile range; whiskers indicate the minimum and maximum values of all 6 experiments. The dots indicate the median value of each independent experiment. A complete list of p values can be found in Table S4. G LDH levels in the culture supernatants of control (n = 15) vs. 6 h OGD (n = 12) neurospheroids after 2 days of reoxygenation. Values represent the measured absorbance at 490 nm corrected for the background absorbance of the culture medium after 15 min. H Representative image of control and 6 h OGD spheroids stained for EF5 adducts after incubation of neurospheroids with hypoxic marker EF5 during normoxic or ischemia-like conditions, respectively. Scale bar 200 µm. I Percentage of viable cells determined by flow cytometry at day 7 for control (n = 12–15) and 6 h OGD (n = 12–15) neurospheroids by three experiments. The box plots indicate median and interquartile range; whiskers indicate the minimum and maximum values of all 3 experiments. The dots indicate the median value of each independent experiment. J Representative light microscopic images of HE-stained control and 6 h OGD neurospheroids at day 7. Scale bar 200 µm. **p < 0.01, ****p < 0.0001
Next, we investigated whether the decrease in luminescent signal post-OGD was related to OGD-induced cytotoxicity. To this end, we first analyzed the culture supernatant of OGD neurospheroids after reoxygenation and demonstrate a significant increase in LDH activity as compared to the supernatant of control neurospheroids, both for 1-week-old (after 4 h, Fig. 7b) and 4-week-old (after 2 days, Fig. 7g) neurospheroids (p = 0.0036 and p = 0.0063, respectively). We further confirmed that the OGD-induced increase in LDH activity in the culture supernatant was indeed due to a hypoxic event as both 1- and 4-week-old neurospheroids displayed high immunoreactivity for the hypoxic marker EF5 when analyzed by ICC immediately after 6 h of OGD (Fig. 7c, h). Consequently, the early occurrence of OGD-induced cytotoxicity, as measured by LDH activity and EF5 immunoreactivity, indeed precedes the decreased luminescent signals detected at day 7 post OGD (Fig. 7a, f). Likewise, flow cytometric analysis confirms a significantly decreased cell viability within 1-week-old (Fig. 7d) and 4-week-old (Fig. 7i) neurospheroids at 7 days after OGD as compared to control neurospheroids (resp. 70% ± 18% versus 89% ± 3% and mean of 40% ± 6% versus 54% ± 9%, for both p < 0.0001). Also note the general difference in cell viability between 1- and 4-week-old neurospheroids, in agreement with our earlier results (Fig. 5e). The latter is also reflected by the loss of spheroid integrity especially for the 4-week-old neurospheroids at 7 days after OGD, visible as less defined edges by classical HE staining (Fig. 7e, j).
The Pan-caspase Inhibitor Z-VAD-FMK is Unable to Alleviate Overall OGD-mediated Neurotoxicity in Neurospheroids
An important future application for the generated luminescent human neurospheroid model is the evaluation of potential neuroprotective agents and/or therapeutic strategies. Here, we assessed the effect of administration of Z-VAD-FMK to the neurospheroid cultures during OGD. Z-VAD-FMK is a pan-caspase inhibitor that has previously been described to confer neuroprotection in rodent models for cerebral ischemia in vivo and in vitro [35–38]. Indeed, the addition of Z-VAD-FMK to the culture medium of 2D-cultured undifferentiated eGFP/Luc hiPSC-NSCs resulted in a beneficial effect at day 2 post-OGD, as reflected by the smaller decrease in luminescent signal for Z-VAD-FMK-treated cultures compared to the untreated counterpart (p = 0.0004) (Fig. 8). Following confirmation of the beneficial effect of Z-VAD-FMK on cell survival in 2D cultures under OGD, we evaluated this compound in the developed neurospheroid model. In a first experimental setup, Z-VAD-FMK was added to the culture medium of 1-week-old and 4-week-old neurospheroids at the start of OGD until day 2 after reoxygenation. However, neither luminescence analysis (Fig. 9a, e, and Table S5) nor flow cytometric analysis (Fig. 9b, f, and Table S6) could demonstrate a direct neuroprotective effect on human neurospheroids after OGD. Finally, we also investigated whether addition of Z-VAD-FMK to the culture medium of neurospheroids during the entire course of the experiment (i.e., until day 7 after reoxygenation) could exert a certain degree of neuroprotection. Despite prolonged exposure to Z-VAD-FMK, both luminescence (Fig. 9c, g, and Table S5) and flow cytometry (Fig. 9d, h, and Table S6) data did not reveal any neuroprotective effect. To investigate whether Z-VAD-FMK was able to interfere with apoptosis specifically, a caspase-3 activity assay and a subsequent western blot for cleaved caspase-3 (in monoplicate on the remaining lysate sample) were performed (Fig. 9i, j, m, and n). As can be appreciated from these assays, control neurospheroids of 1-week and 4-week old display active caspase-3 activity, indicating a basal level of apoptosis present in neurospheroids. Staurosporine (STS) treatment was used as a positive control for caspase-3 activity. This finding could additionally be confirmed by quantification of the cleaved caspase-3 immunostaining at day 7 post-reoxygenation (Fig. 9k, l, o, and p). Furthermore, Z-VAD-FMK is able to suppress the caspase-3 activity after OGD in both 1-week-old and 4-week-old neurospheroids, when compared to their untreated counterpart (for both p < 0.0001) (Fig. 9i, m). Similarly, western blot analysis (although not quantified) suggests reduced cleaved caspase-3 upon Z-VAD-FMK treatment (Fig. 9j, n). However, even though reduced caspase-3 activity was observed following Z-VAD-FMK treatment, it did not prevent overall OGD-induced cell death.
Fig. 8.
Evaluation of Z-VAD-FMK in 2D culture of eGFP/Luc NSCs. Luminescence measurements of eGFP/Luc NSCs under control (n = 30) or 6 h OGD treated with (n = 30) or without (n = 30) 25 µM Z-VAD-FMK during the OGD until day 2 after reoxygenation. The RLU data post-OGD (i.e., day 2) of each condition were normalized to the mean of pre-OGD data of the corresponding condition, represented as “fold change” in the graph. ***p < 0.001, ****p < 0.0001
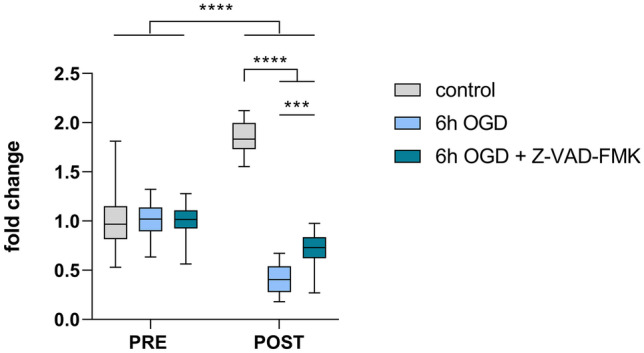
Fig. 9.

Evaluation of Z-VAD-FMK in luminescent neurospheroid model. Left and middle-left: 1-week-old (1 W) with single administration of Z-VAD-FMK and 1 W neurospheroids with daily administration. Middle-right and right: 4-week-old (4 W) neurospheroids with single administration and 4 W neurospheroids with daily administration of Z-VAD-FMK. A Luminescence measurements of 1 W neurospheroids under control conditions (n = 29) or 6 h OGD treated with (n = 30) or without (n = 29) 25 µM Z-VAD-FMK during the OGD until day 2 after reoxygenation. The RLU data post-OGD (i.e., day 7) of each condition were normalized to the mean of pre-OGD data of the corresponding condition, represented as “fold change” in the graph. A complete list of p values can be found in Table S5. B Percentage of viable cells determined by flow cytometry at day 7 for control (n = 12) and 6 h OGD neurospheroids treated with (n = 12) and without Z-VAD-FMK (n = 12) during the OGD until day 2 after reoxygenation. A complete list of p values can be found in Table S6. C Luminescence measurements of 1 W neurospheroids under control conditions (n = 29) or 6 h OGD treated with (n = 28) or without (n = 23) 25 µM Z-VAD-FMK during the OGD until day 7 after reoxygenation. The RLU data post-OGD (i.e., day 7) of each condition were normalized to the mean of pre-OGD data of the corresponding condition, represented as “fold change” in the graph. A complete list of p values can be found in Table S5. D Percentage of viable cells determined by flow cytometry at day 7 for control (n = 12) and 6 h OGD neurospheroids treated with (n = 12) and without Z-VAD-FMK (n = 12) during the OGD until day 7 after reoxygenation. A complete list of p values can be found in Table S6. E Luminescence measurements of 4 W neurospheroids under control conditions (n = 30) or 6 h OGD treated with (n = 30) or without (n = 30) 25 µM Z-VAD-FMK during the OGD until day 2 after reoxygenation. The RLU data post-OGD (i.e., day 7) of each condition were normalized to the mean of pre-OGD data of the corresponding condition, represented as “fold change” in the graph. A complete list of p values can be found in Table S5. F Percentage of viable cells determined by flow cytometry at day 7 for control (n = 12) neurospheroids and 6 h OGD neurospheroids treated with (n = 7) and without Z-VAD-FMK (n = 12) during the OGD until day 2 after reoxygenation. A complete list of p values can be found in Table S6. G Luminescence measurements of 4 W neurospheroids under control conditions (n = 30) or 6 h OGD treated with (n = 29–30) or without (n = 30) 25 µM Z-VAD-FMK during the OGD until day 7 after reoxygenation from two independent experiments. The RLU data post-OGD (i.e., day 7) of each condition were normalized to the mean of pre-OGD data of the corresponding condition, represented as “fold change” in the graph. The box plots indicate median and interquartile range; whiskers indicate the minimum and maximum values of all two experiments. The dots indicate the median value of each independent experiment. A complete list of p values can be found in Table S5. H Percentage of viable cells determined by flow cytometry at day 7 for control (n = 12) and 6 h OGD neurospheroids treated with (n = 11) and without Z-VAD-FMK (n = 12) during the OGD until day 7 after reoxygenation by two independent experiments. The box plots indicate median and interquartile range; whiskers indicate the minimum and maximum values of two independent experiments. The dots indicate the median value of each independent experiment. A complete list of p values can be found in Table S6. I Caspase-3 activity of lysates derived from 1 W neurospheroids under control, 6 h OGD or 6 h OGD + Z-VAD-FMK conditions at day 2 after reoxygenation using a fluorescent caspase-activity probe (DEVD-AMC). Lysate derived from staurosporine (STS)-treated 1 W neurospheroids was included as a positive control for caspase-3 activity. J Western blot for caspase-3 of lysates derived from 1 W neurospheroids under control, 6 h OGD, or 6 h OGD + Z-VAD-FMK conditions at day 2 after reoxygenation. Lysate derived from STS-treated 1 W neurospheroids was included as a positive control for cleaved caspase-3 (Cl. Casp-3). Image of the complete blot can be found in Fig. S3. K Representative immunofluorescent images (i.e., image with percentage coverage closest to the median value of the quantification data shown in L) of control and 6 h OGD 1 W neurospheroids stained for Cl. Casp-3. Second row represents a 100 × 100 µm inset at the selected region (white square) from upper row images. Scale bar 100 µm. L Quantification of Cl. Casp-3 staining, expressed in percentage coverage, i.e., the percentage of the complete neurospheroid area covered by cleaved caspase-3 staining, of 1 W neurospheroids under control or 6 h OGD conditions at day 7 after reoxygenation. Data are derived from two independent experiments with n = 4 for control and n = 5–6 for 6 h OGD neurospheroids per experiment. The box plots indicate median and interquartile range; whiskers indicate the minimum and maximum values of all two independent experiments. M Caspase-3 activity of lysates derived from 4 W neurospheroids under control, 6 h OGD, or 6 h OGD + Z-VAD-FMK conditions at day 2 after reoxygenation using a fluorescent caspase-activity probe (DEVD-AMC). Lysate derived from STS-treated 4 W neurospheroids was included as a positive control for caspase-3 activity. N Western blot for caspase-3 of lysates derived from 4 W neurospheroids under control, 6 h OGD, or 6 h OGD + Z-VAD-FMK conditions at day 2 after reoxygenation. Lysate derived from STS-treated 4 W neurospheroids was included as a positive control for Cl. Casp-3. Image of the complete blot can be found in Fig. S3. O Representative immunofluorescent images (i.e., image with percentage coverage closest to the median value of the quantification data shown in P) of control and 6 h OGD 4 W neurospheroids stained for Cl. Casp-3. Second row represents a 100 × 100 µm inset at the selected region (white square) from upper row images. Scale bar 100 µm. P Quantification of Cl. Casp-3 staining, expressed in percentage coverage, i.e., the percentage of the complete neurospheroid area covered by cleaved caspase-3 staining, of 4 W neurospheroids under control or 6 h OGD conditions at day 7 after reoxygenation. Data are derived from two independent experiments with n = 5 for control and n = 5–6 for 6 h OGD neurospheroids per experiment. The box plots indicate median and interquartile range; whiskers indicate the minimum and maximum values of all two independent experiments. *p < 0.05, **p < 0.01, ****p < 0.0001
Discussion
To date, effective therapy for acute ischemic stroke is limited to treatment with tissue plasminogen activator or thrombectomy, which can only be applied in a limited number of patients. The lack of significant progress in finding a neuroprotective therapy for stroke patients can in part be attributed to the absence of physiologically relevant human in vitro models. To bridge the translational gap and increase the success rate of potential new therapeutics, in vitro stroke research should be shifted from traditional rodent 2D cultures to more relevant human 3D cultures, including neurospheroids/organoids. Although brain organoids have already shown their relevance in modeling brain development, neurodevelopmental and neurodegenerative diseases, only a few articles have been published so far in which brain organoids were subjected to low oxygen tension [21–23], mainly investigating the effect of hypoxia on neurodevelopment and corticogenesis. In this study, we describe a human luminescent iPSC-derived neurospheroid model as the basis for the development of a new platform suitable for both basic and applied in vitro human stroke research. Although the development of brain organoids, in particular, is often associated with variations in size, shape, and cellular composition [19, 39, 40], the here developed neurospheroid model, based on the spontaneous self-assembling capacity of hiPSC-derived NSCs, showed high reproducibility in terms of size and differentiation. With the culture conditions used in this study, neurospheroids grew over the course of minimum 5 weeks with a growth pattern that is highly reproducible. It should be noted that as the spheroids grow beyond a diameter of 400 µm, a necrotic core is present in these models and may be reduced in future studies by means of optimized differentiation media supporting more the differentiation and less the proliferation of the NSC population in the neurospheroids. Nevertheless, the protocol applied here demonstrated that the neurospheroids had undergone reproducible spontaneous differentiation into neurons from as early as 2 weeks, as determined by their Tuj1, DCX, and NeuN immunoreactivity, staining both immature and mature neurons, respectively. Additionally, the proportion of NSCs and proliferative cells showed a consistent reduction over time, reflecting increasing differentiation of the neurospheroids. One current point of consideration is the lack of astrocytes in the present model. Considering the timeline of the appearance of neurons and astrocytes in the in vivo embryonic brain development, these time-points may have been too early for the neurospheroids to have spontaneously developed astrocytes under these specific culture conditions. Further supporting this hypothesis, preliminary experiments in which neurospheroids were grown up to 8 weeks of age did, however, reveal the appearance of GFAP + astrocytes (data not shown). Therefore, future experiments may require even longer periods of culture and/or optimization of the culture conditions to develop neurospheroids that more faithfully recapitulate the in vivo situation.
Of note, to characterize the neural spheroids developed here, we adapted an existing protocol for the simultaneous downstream histological processing of multiple spheroids [29]. We modified the protocol to obtain cryosections, making it compatible with spheroids labeled with fluorescence reporter proteins (e.g., eGFP) and omitting the need for the time-consuming (de) paraffinization and subsequent antigen retrieval steps. Techniques to analyze morphology and protein expression of 3D cultures were often considered slow and laborious [39], but with this spheroid microarray technology, the model is well-suited for possible high-throughput drug screening applications.
Common read-outs in different in vitro stroke experiments are viability and/or cytotoxicity, which are typically assessed by techniques, such as MTT assay, LDH assay, flow cytometric or microscopic detection of living, and/or apoptotic cells. A major drawback associated with these conventional analysis methods is the requirement of a single endpoint. However, to gain more insight into the pathophysiology and/or the effectiveness of candidate neuroprotective compounds, it may be of relevance to study the dynamics in viability and cytotoxicity of the same OGD-treated culture over time. Moreover, some of these methods, in particular flow cytometry, require disruption of the 3D structural organization for analysis. To overcome all aforementioned limitations, we equipped a human iPSC-derived neurospheroid model with intrinsic bioluminescence for an easy and longitudinal follow-up of their growth and overall viability over time. Although still limited, luminescent reporters have been used in 3D cultures for different purposes. Stably expressed luciferase was used before to quantify the outgrowth of mammary epithelial cells propagated within 3D matrices [41] or to determine the cytotoxicity of different hepatotoxicants in primary hepatocyte-derived spheroids over a long term [42]. Additionally, when placed under the control of a specific promoter, luminescence can be used to monitor the expression of a specific gene over time. Malik et al. [43] applied luminescence imaging to monitor mPer1 gene expression in mouse neurospheres to study circadian rhythms in adult neurogenesis.
When monitoring the luminescence of the neurospheroid culture over time, a dynamic pattern becomes evident. Initially, their produced luminescent signal exhibited an increase during the first 3 weeks (Fig. 5c), coinciding with growth of the neurospheroids (Fig. 5d). Although growth continued after 3 weeks of age, the luminescent signal they generated showed a stagnation and eventually a decrease when cultured for a longer time period. Different reasons might be at the root of this contradiction. First, as the eGFP/Luc hiPSC-NSC population used in this study was generated by lentiviral vector transduction, it cannot be excluded that a proportion of transduced cells underwent transgene silencing. The latter may be due to the site of integration being subjected to chromatin remodeling events/epigenetic changes associated with differentiation or due to promoter silencing, as was reported earlier for CMVie [44–46]. These issues may potentially be overcome using CRISPR-based genetic engineering strategies whereby the firefly luciferase reporter ORF is inserted in a ubiquitously active genomic region and/or by the use of other universal (non-viral) promoters (e.g., elongation factor 1α short (EFS) promoter) [47]. Considering the use of long-term cultured, more mature neurospheroids in future experiments, the use of a neuron-specific promoter could also be an interesting approach. Secondly, the increasing differentiation of the cells in the neurospheroids may have reduced the expression of firefly luciferase reporter, despite the use of a constitutive human CMVie promoter, as demonstrated for eGFP by flow cytometry (Fig. 5f). Finally, the increasing hypoxic core associated with growth of the neurospheroids, and the apoptotic events related to the transition of immature to more mature neurospheroids, may affect the overall viability of the neurospheroids, as determined by flow cytometry (Fig. 5e), thereby influencing the observed luminescent signals.
To obtain the proof-of-principle for the use of the aforementioned luminescent model system in in vitro stroke research, neurospheroids were subjected to an ischemia-like event, i.e., 6 h of oxygen and glucose deprivation. For both 1- and 4-week-old neurospheroids, incubation in an oxygen- and glucose-deprived environment caused a decrease in luminescence when compared to control conditions at day 7 after reoxygenation. This could be attributed to OGD-induced neurotoxicity, as confirmed by the LDH assay shortly after reoxygenation. However, despite the initial damage, the 1-week-old neurospheroids were able to recover and continued to grow over the course of 1 week, as demonstrated by a net increase in luminescence. In contrast, the OGD of older, more differentiated 4-week-old neurospheroids caused a damage that remained irreversible, at least without any (therapeutic) intervention as determined here. The ability of the 1-week-old neurospheroids to recover is most probably the result of the relatively high number of (proliferative) undifferentiated NSCs in the 1-week-old neurospheroids, while the reduced number of NSCs in 4-week-old neurospheroids renders them unable to regenerate (Fig. 4c, e). The latter however resembles a more physiological condition. Moreover, one of the future applications of this model would be the evaluation of neuroprotective compounds. This implies that in order to draw firm conclusions on the effectivity, any recovery or stabilization of deterioration should preferably solely and unambiguously be the result of the potential neuroprotective effect. Therefore, the use of older, more mature neurospheroids is preferred. Apart from the decrease in luminescent signal, flow cytometric analysis confirmed more cell death in OGD-treated neurospheroids at day 7 post-OGD as compared to control conditions, both for 1- and 4-week-old neurospheroids. While considering the recovery of 1-week-old neurospheroids, one might expect to see no difference in viability between control and OGD neurospheroids at day 7. We here hypothesize that initially died cells remained trapped in the neurospheroids by the absence of an immune component able to clear them. A future solution for this will be the use of immune-competent brain organoids containing microglia. Whereas most of the currently used brain spheroids and organoids only contain cells of neuroectodermal lineage, different microglia-containing brain organoids are recently being developed [48–50], creating a model mimicking the human brain even more closely. Moreover, as microglia have been assigned a key role in the secondary injury after stroke, the use of this model would allow to study both direct and microglia-mediated neurotoxicity after OGD and to evaluate candidate neuroprotective agents based on immunomodulation in the future.
Since the evaluation of candidate neuroprotective drugs is a major application of in vitro stroke models, we finally tested the potential neuroprotective pan-caspase inhibitor Z-VAD-FMK in the established luminescent neurospheroid model. As determined by the caspase-3 activity assay and western blot for cleaved caspase-3, Z-VAD-FMK was able to selectively suppress caspase-mediated apoptosis in human neurospheroids. However, this protective effect was not reflected by the luminescence and flow cytometric analysis measuring overall viability, irrespective of treatment duration. The reason for this discrepancy might be explained by other more prominent cell death mechanisms induced by OGD in this model that mask the attenuation of (ischemic) apoptosis by Z-VAD-FMK, as previously reported by Gottron et al. [38]. Moreover, as evident from the caspase-3 activity assay, corresponding western blot and quantification of cleaved caspase-3 staining, apoptosis present in OGD-treated neurospheroids is mainly the result of basal caspase-3 activity, as demonstrated for control neurospheroids. This suggests that other cell death mechanisms may be responsible for the OGD-mediated neurotoxicity observed by luminescence measurements and conventional analyses in this model. Further research is required to identify cell death types induced by OGD in this model.
Interestingly, when administered to a 2D culture of undifferentiated eGFP/Luc hiPSC-NSCs, Z-VAD-FMK did confer neuroprotection as demonstrated by a smaller decrease in luminescent signal after OGD. This exemplifies how increased complexity of spheroid or organoid models, in terms of cellular heterogeneity and/or dimensionality, may result in a different outcome when testing neuroprotective compounds. Further research is needed to identify the mechanisms, for instance, changed susceptibility to neurotoxic stimuli or elicited types of cell death, accounting for this difference in response. Nevertheless, these findings underscore the importance of the introduction of human-based 3D models in the preclinical stage of drug discovery and development, complementing 2D in vitro models and in vivo models.
Conclusion
We here present a luminescent human in vitro stroke model that can be applied to pathophysiological as well as therapeutic studies in the field of human stroke research. More specifically, the model enables both the study of OGD-associated neurotoxicity and the identification of potential neuroprotective agents by means of its easy read-out of neural survival and health. The high level of reproducibility, the 96-well format development, the easy neurotoxicity read-out, and downstream immunocytochemical processing all make this model readily applicable to high-throughput drug screening purposes, which hopefully will lead to the identification of new therapies for acute ischemic stroke patients in the future.
Supplementary Information
Below is the link to the electronic supplementary material.
Required Author Forms
Disclosure forms provided by the authors are available with the online version of this article.
Funding
This project has received funding from the Fund for Scientific Research Flanders (FWO-Vlaanderen) (G091518N, granted to PP; G034721N, granted to PP and PD; G049720N, granted to TVB; G0B3516N, granted to RG; FWO I003420N; FWO IRI I000321N to WDV), the University of Antwerp (IOF FFI170347, granted to PP, WDV, AW, PJ and JPT; GOA FFB16036, granted to BL; IOF FFI210239 granted to WDV; GOA FFB200404, granted to PP, WDV and BL; BOF IMARK, µNEURO granted to WDV), the Belgian Charcot Foundation (granted to PP) and the European Union’s Horizon 2020 research and innovation programme under the Marie Skłodowska-Curie grant agreement No 813263. EVB is holder of a PhD-fellowship provided by the University of Antwerp (DOCPRO mandate). AN (1S24317N) and AQ (1S11917N) held PhD-fellowships from the FWO-Vlaanderen. BH is holder of a postdoctoral-fellowship from FWO-Vlaanderen. Research in Vanden Berghe (TVB) lab is funded by Strategic Basic Research Foundation Flanders (IRONIX, S001522N); Excellence of Science CD-INFLADIS; Consortium of excellence at University of Antwerp INFLA-MED; Industrial research Fund from University of Antwerp; Foundation against cancer (FAF-C/2018/1250); Charcot Foundation; VLIRUOS (TEAM2018-01–137). We also thank Filip Desmet (Molecular Spectroscopy research group) for printing the mold-maker. Figures were created with Biorender.com.
Data Availability
All original data are available upon request.
Declarations
Competing Interests
The authors declare no competing interests.
Footnotes
The original version of this article was revised: Captions have been added to Supplementary file1, Supplementary file2, and Supplementary file3 since this article’s original publication.
Publisher's Note
Springer Nature remains neutral with regard to jurisdictional claims in published maps and institutional affiliations.
Change history
6/21/2022
A Correction to this paper has been published: 10.1007/s13311-022-01235-6
References
- 1.Benjamin EJ, Blaha MJ, Chiuve SE, et al. Heart disease and stroke statistics-2017 update: a report from the American Heart Association. Circulation. 2017;135(10):e146–e603. doi: 10.1161/CIR.0000000000000485. [DOI] [PMC free article] [PubMed] [Google Scholar]
- 2.Writing Group M. Mozaffarian D, Benjamin EJ, et al. Executive summary: heart disease and stroke statistics–2016 update: a report from the American Heart Association. Circulation. 2016;133(4):447–454. doi: 10.1161/CIR.0000000000000366. [DOI] [PubMed] [Google Scholar]
- 3.Holloway PM, Gavins FN. Modeling ischemic stroke in vitro: status quo and future perspectives. Stroke. 2016;47(2):561–569. doi: 10.1161/STROKEAHA.115.011932. [DOI] [PMC free article] [PubMed] [Google Scholar]
- 4.Antonic A, Sena ES, Donnan GA, Howells DW. Human in vitro models of ischaemic stroke: a test bed for translation. Transl Stroke Res. 2012;3(3):306–309. doi: 10.1007/s12975-012-0201-x. [DOI] [PubMed] [Google Scholar]
- 5.Hu X, Li P, Guo Y, et al. Microglia/macrophage polarization dynamics reveal novel mechanism of injury expansion after focal cerebral ischemia. Stroke. 2012;43(11):3063–3070. doi: 10.1161/STROKEAHA.112.659656. [DOI] [PubMed] [Google Scholar]
- 6.Datta A, Park JE, Li X, et al. Phenotyping of an in vitro model of ischemic penumbra by iTRAQ-based shotgun quantitative proteomics. J Proteome Res. 2010;9(1):472–484. doi: 10.1021/pr900829h. [DOI] [PubMed] [Google Scholar]
- 7.Tasca CI, Dal-Cim T, Cimarosti H. In vitro oxygen-glucose deprivation to study ischemic cell death. Methods Mol Biol. 2015;1254:197–210. doi: 10.1007/978-1-4939-2152-2_15. [DOI] [PubMed] [Google Scholar]
- 8.Goldberg MP, Choi DW. Combined oxygen and glucose deprivation in cortical cell culture: calcium-dependent and calcium-independent mechanisms of neuronal injury. J Neurosci Off J Soc Neurosci. 1993;13(8):3510–3524. doi: 10.1523/JNEUROSCI.13-08-03510.1993. [DOI] [PMC free article] [PubMed] [Google Scholar]
- 9.Ryou MG, Mallet RT. An in vitro oxygen-glucose deprivation model for studying ischemia-reperfusion injury of neuronal cells. Methods Mol Biol. 2018;1717:229–235. doi: 10.1007/978-1-4939-7526-6_18. [DOI] [PubMed] [Google Scholar]
- 10.Kaneko Y, Pappas C, Tajiri N, Borlongan CV. Oxytocin modulates GABAAR subunits to confer neuroprotection in stroke in vitro. Sci Rep. 2016;6:35659. doi: 10.1038/srep35659. [DOI] [PMC free article] [PubMed] [Google Scholar]
- 11.Wang JH, Wan D, Wan GR, Wang JH, Zhang JH, Zhu HF. Catalpol induces cell activity to promote axonal regeneration via the PI3K/AKT/mTOR pathway in vivo and in vitro stroke model. Ann Transl Med. 2019;7(23). [DOI] [PMC free article] [PubMed]
- 12.Davalos A, Castillo J, Serena J, Noya M. Duration of glutamate release after acute ischemic stroke. Stroke. 1997;28(4):708–710. doi: 10.1161/01.STR.28.4.708. [DOI] [PubMed] [Google Scholar]
- 13.Chang R, Algird A, Bau C, Rathbone MP, Jiang S. Neuroprotective effects of guanosine on stroke models in vitro and in vivo. Neurosci Lett. 2008;431(2):101–105. doi: 10.1016/j.neulet.2007.11.072. [DOI] [PubMed] [Google Scholar]
- 14.Nousiainen S. Developing an in vitro stroke model for studying adipose stem cells' paracrine effect on neuronal recovery after ischemia: Tampere Univeristy; 2019.
- 15.Zou YX, Liu YX, Ruan MH, Zhou Y, Wang JC, Chu ZY. Cordyceps sinensis oral liquid inhibits damage induced by oxygen and glucose deprivation in SH-SY5Y cells. Altern Ther Health Med. 2016;22(2):37–42. [PubMed] [Google Scholar]
- 16.Liu Y, Eaton ED, Wills TE, McCann SK, Antonic A, Howells DW. Human ischaemic cascade studies using SH-SY5Y cells: a systematic review and meta-analysis. Transl Stroke Res. 2018;9(6):564–574. doi: 10.1007/s12975-018-0620-4. [DOI] [PMC free article] [PubMed] [Google Scholar]
- 17.Werth JL, Park TS, Silbergeld DL, Rothman SM. Excitotoxic swelling occurs in oxygen and glucose deprived human cortical slices. Brain Res. 1998;782(1–2):248–254. doi: 10.1016/S0006-8993(97)01286-9. [DOI] [PubMed] [Google Scholar]
- 18.Marcoli M, Cervetto C, Castagnetta M, Sbaffi P, Maura G. 5-HT control of ischemia-evoked glutamate efflux from human cerebrocortical slices. Neurochem Int. 2004;45(5):687–691. doi: 10.1016/j.neuint.2004.03.004. [DOI] [PubMed] [Google Scholar]
- 19.Rothenbucher TSP, Martinez-Serrano A. Human cerebral organoids and neural 3D tissues in basic research, and their application to study neurological diseases. Futur Neurol. 2019;14(1).
- 20.Vagaska B, Gillham O, Ferretti P. Modelling human CNS injury with human neural stem cells in 2- and 3-Dimensional cultures. Sci Rep. 2020;10(1):6785. doi: 10.1038/s41598-020-62906-y. [DOI] [PMC free article] [PubMed] [Google Scholar]
- 21.Pasca AM, Park JY, Shin HW, et al. Human 3D cellular model of hypoxic brain injury of prematurity. Nat Med. 2019;25(5):784–791. doi: 10.1038/s41591-019-0436-0. [DOI] [PMC free article] [PubMed] [Google Scholar]
- 22.Kim MS, Kim DH, Kang HK, Kook MG, Choi SW, Kang KS. Modeling of hypoxic brain injury through 3D human neural organoids. Cells. 2021;10(2). [DOI] [PMC free article] [PubMed]
- 23.Daviaud N, Chevalier C, Friedel RH, Zou H. Distinct vulnerability and resilience of human neuroprogenitor subtypes in cerebral organoid model of prenatal hypoxic injury. Front Cell Neurosci. 2019;13:336. doi: 10.3389/fncel.2019.00336. [DOI] [PMC free article] [PubMed] [Google Scholar]
- 24.Li H, Durbin R. Fast and accurate long-read alignment with Burrows-Wheeler transform. Bioinformatics. 2010;26(5):589–595. doi: 10.1093/bioinformatics/btp698. [DOI] [PMC free article] [PubMed] [Google Scholar]
- 25.Picard toolkit. Broad Institute, GitHub repository. 2019. https://broadinstitute.github.io/picard/; Broad Institute. https://github.com/broadinstitute/picard. Accessed 9 Sept 2019.
- 26.Raman L, Dheedene A, De Smet M, Van Dorpe J, Menten B. WisecondorX: improved copy number detection for routine shallow whole-genome sequencing. Nucleic Acids Res. 2019;47(4):1605–1614. doi: 10.1093/nar/gky1263. [DOI] [PMC free article] [PubMed] [Google Scholar]
- 27.Sante T, Vergult S, Volders PJ, et al. ViVar: a comprehensive platform for the analysis and visualization of structural genomic variation. PloS One. 2014;9(12):e113800. [DOI] [PMC free article] [PubMed]
- 28.Yan Y, Shin S, Jha BS, et al. Efficient and rapid derivation of primitive neural stem cells and generation of brain subtype neurons from human pluripotent stem cells. Stem Cells Transl Med. 2013;2(11):862–870. doi: 10.5966/sctm.2013-0080. [DOI] [PMC free article] [PubMed] [Google Scholar]
- 29.Ivanov DP, Grabowska AM. Spheroid arrays for high-throughput single-cell analysis of spatial patterns and biomarker expression in 3D. Sci Rep. 2017;7:41160. doi: 10.1038/srep41160. [DOI] [PMC free article] [PubMed] [Google Scholar]
- 30.De Vos WH, Van Neste L, Dieriks B, Joss GH, Van Oostveldt P. High content image cytometry in the context of subnuclear organization. Cytometry A. 2010;77(1):64–75. doi: 10.1002/cyto.a.20807. [DOI] [PubMed] [Google Scholar]
- 31.Houthaeve G, Xiong R, Robijns J, et al. Targeted perturbation of nuclear envelope integrity with vapor nanobubble-mediated photoporation. ACS Nano. 2018;12(8):7791–7802. doi: 10.1021/acsnano.8b01860. [DOI] [PubMed] [Google Scholar]
- 32.Zack GW, Rogers WE, Latt SA. Automatic measurement of sister chromatid exchange frequency. J Histochem Cytochem. 1977;25(7):741–753. doi: 10.1177/25.7.70454. [DOI] [PubMed] [Google Scholar]
- 33.Geraerts M, Michiels M, Baekelandt V, Debyser Z, Gijsbers R. Upscaling of lentiviral vector production by tangential flow filtration. J Gene Med. 2005;7(10):1299–1310. doi: 10.1002/jgm.778. [DOI] [PubMed] [Google Scholar]
- 34.Ibrahimi A, Vande Velde G, Reumers V, et al. Highly efficient multicistronic lentiviral vectors with peptide 2A sequences. Hum Gene Ther. 2009;20(8):845–860. doi: 10.1089/hum.2008.188. [DOI] [PubMed] [Google Scholar]
- 35.Endres M, Namura S, Shimizu-Sasamata M, et al. Attenuation of delayed neuronal death after mild focal ischemia in mice by inhibition of the caspase family. J Cereb Blood Flow Metab. 1998;18(3):238–247. doi: 10.1097/00004647-199803000-00002. [DOI] [PubMed] [Google Scholar]
- 36.Wiessner C, Sauer D, Alaimo D, Allegrini PR. Protective effect of a caspase inhibitor in models for cerebral ischemia in vitro and in vivo. Cell Mol Biol (Noisy-le-grand). 2000;46(1):53–62. [PubMed]
- 37.Le DA, Wu Y, Huang Z, et al. Caspase activation and neuroprotection in caspase-3- deficient mice after in vivo cerebral ischemia and in vitro oxygen glucose deprivation. Proc Natl Acad Sci USA. 2002;99(23):15188–15193. doi: 10.1073/pnas.232473399. [DOI] [PMC free article] [PubMed] [Google Scholar]
- 38.Gottron FJ, Ying HS, Choi DW. Caspase inhibition selectively reduces the apoptotic component of oxygen-glucose deprivation-induced cortical neuronal cell death. Mol Cell Neurosci. 1997;9(3):159–169. doi: 10.1006/mcne.1997.0618. [DOI] [PubMed] [Google Scholar]
- 39.Pamies D, Barreras P, Block K, et al. A human brain microphysiological system derived from induced pluripotent stem cells to study neurological diseases and toxicity. Altex. 2017;34(3):362–376. doi: 10.14573/altex.1609122. [DOI] [PMC free article] [PubMed] [Google Scholar]
- 40.Fang Y, Eglen RM. Three-dimensional cell cultures in drug discovery and development. SLAS Discov. 2017;22(5):456–472. doi: 10.1177/1087057117696795. [DOI] [PMC free article] [PubMed] [Google Scholar]
- 41.Wendt MK, Schiemann WP. Longitudinal bioluminescent quantification of three dimensional cell growth. Bio Protoc. 2013;3(23). [DOI] [PMC free article] [PubMed]
- 42.Yasunaga M, Fujita Y, Saito R, Oshimura M, Nakajima Y. Continuous long-term cytotoxicity monitoring in 3D spheroids of beetle luciferase-expressing hepatocytes by nondestructive bioluminescence measurement. BMC Biotechnol. 2017;17(1):54. doi: 10.1186/s12896-017-0374-1. [DOI] [PMC free article] [PubMed] [Google Scholar]
- 43.Malik A, Jamasbi RJ, Kondratov RV, Geusz ME. Development of circadian oscillators in neurosphere cultures during adult neurogenesis. PloS One. 2015;10(3):e0122937. [DOI] [PMC free article] [PubMed]
- 44.Mehta AK, Majumdar SS, Alam P, Gulati N, Brahmachari V. Epigenetic regulation of cytomegalovirus major immediate-early promoter activity in transgenic mice. Gene. 2009;428(1–2):20–24. doi: 10.1016/j.gene.2008.09.033. [DOI] [PubMed] [Google Scholar]
- 45.Prosch S, Stein J, Staak K, Liebenthal C, Volk HD, Kruger DH. Inactivation of the very strong HCMV immediate early promoter by DNA CpG methylation in vitro. Biol Chem Hoppe Seyler. 1996;377(3):195–201. doi: 10.1515/bchm3.1996.377.3.195. [DOI] [PubMed] [Google Scholar]
- 46.Hsu CC, Li HP, Hung YH, et al. Targeted methylation of CMV and E1A viral promoters. Biochem Biophys Res Commun. 2010;402(2):228–234. doi: 10.1016/j.bbrc.2010.09.131. [DOI] [PubMed] [Google Scholar]
- 47.Hoffmann D, Schott JW, Geis FK, et al. Detailed comparison of retroviral vectors and promoter configurations for stable and high transgene expression in human induced pluripotent stem cells. Gene Ther. 2017;24(5):298–307. doi: 10.1038/gt.2017.20. [DOI] [PubMed] [Google Scholar]
- 48.Song L, Yuan X, Jones Z, et al. Functionalization of brain region-specific spheroids with isogenic microglia-like cells. Sci Rep. 2019;9(1):11055. doi: 10.1038/s41598-019-47444-6. [DOI] [PMC free article] [PubMed] [Google Scholar]
- 49.Ormel PR, Vieira de Sa R, van Bodegraven EJ, et al. Microglia innately develop within cerebral organoids. Nat Commun. 2018;9(1):4167. [DOI] [PMC free article] [PubMed]
- 50.Abreu CM, Gama L, Krasemann S, et al. Microglia increase inflammatory responses in iPSC-derived human BrainSpheres. Front Microbiol. 2018;9:2766. doi: 10.3389/fmicb.2018.02766. [DOI] [PMC free article] [PubMed] [Google Scholar]
Associated Data
This section collects any data citations, data availability statements, or supplementary materials included in this article.
Supplementary Materials
Data Availability Statement
All original data are available upon request.