

Abstract
Objective
Leukaemia is one of the most common cancers and may be associated with exposure to environmental carcinogens, especially outdoor air pollutants. The objective of this study was to investigate the association of ambient air pollution and leukaemia in Tehran, Iran.
Design
In this retrospective cohort study, data about the residential district of leukaemia cases diagnosed from 2010 to 2016 were inquired from the Ministry of Health cancer database. Data from a previous study were used to determine long-term average exposure to different air pollutants in 22 districts of Tehran. Latent profile analysis (LPA) was used to classify pollutants in two exposure profiles. The association between air pollutants and leukaemia incidence was analysed by negative binomial regression.
Setting
Twenty-two districts of Tehran megacity.
Participants
Patients with leukaemia.
Outcome measures
The outcome variables were incidence rate ratios (IRR) of acute myeloid and lymphoid leukaemia across the districts of Tehran.
Results
The districts with higher concentrations for all pollutants were near the city centre. The IRR was positive but non-significant for most of the air pollutants. However, annual mean NOx was directly and significantly associated with total leukaemia incidence in the fully adjusted model (IRR (95% CI): 1.03 (1.003 to 1.06) per 10 ppb increase). Based on LPA, districts with a higher multiple air-pollutants profile were also associated with higher leukaemia incidence (IRR (95% CI): 1.003 (0.99 to 1.007) per 1 ppb increase).
Conclusions
Our study shows that districts with higher air pollution (nitrogen oxides and multipollutants) have higher incidence rates of leukaemia in Tehran, Iran. This study warrants conducting further research with individual human data and better control of confounding.
Keywords: Leukaemia, EPIDEMIOLOGY, Epidemiology
Strengths and limitations of this study.
This is the first study for estimating the simultaneous effect of single and multiple ambient air pollutants on the incidence of leukaemia in Iran.
We included potential confounding covariates at area level based on administrative survey data.
However, control for confounding variables was not done at the individual level.
We were not able to adjust for human relocation or migration.
Background
Leukaemia is one of the most common haematological malignancies among adults and children.1 In 2020, leukaemia was among the 15 more common cancers worldwide and contributed to 2.5% of all new cases of cancer and 3.1% of all cancer death. Worldwide, the age standardised incidence and mortality rates of leukaemia are 6.3 per 100 000 and 4.0 per 100 000 for men and 4.5 per 100 000 and 2.7 per 100 000 in women, respectively. In countries with low and medium human development index, the age-standardised incidence and mortality rates of leukaemia are, respectively, 3.8 per 100 000 and 3.0 per 100 000 for men, and 2.9 per 100 000 and 2.0 per 100 000 for women.2 In Iran where cancer is the third leading cause of death after cardiovascular disease mortality and traffic accidents, leukaemia is the sixth most common cancer in men with age standardised rates of 8.32 per 100 000, and the fifth in women with age-standardised rates of 5.40 per 100 000.3
Outdoor air pollution may have serious adverse effects on human health, including cancer.4 It has been proven that some environmental factors including ambient air pollution are carcinogenic to humans.5
The aetiology of leukaemia remains mostly unknown. Some studies have reported that adverse gene-environment interactions may lead to leukaemia.1 A recent meta-analysis on the association between outdoor air pollution and childhood leukaemia showed a positive linear association between benzene exposure and risk of childhood leukaemia, particularly for acute myeloid leukaemia (AML), among children under 6 years of age, and nitrogen dioxide at high levels was associated with leukaemia.6
In the current study, we aimed to examine the association between estimates of district level averages of multiple ambient air pollutants and acute leukaemia incidence across Tehran districts using LPA method. LPA is a robust technique, mainly used to identify subtypes of homogeneous latent classes or subgroups within a large heterogeneous group. This iterative process clusters similar profiles together to generate distinct subgroups/classes.7
Methodology
Research location
The present retrospective cohort study was carried out based on annual mean air pollution levels in 22 districts of Tehran megacity, which is the capital of Iran. According to the World Population Review report, Tehran’s 2021 population was estimated to be 9.2 million inhabitants. Tehran includes 22 districts in which each include from 174 239 to 9 19 001 residents according to the latest 2016 census.8 Population density is higher in the central, western and southern regions.9 Tehran suffers from severe ambient air pollution as documented by numerous studies.9–12 The central districts with higher population densities (five districts of 2, 6, 10, 11 and 12 in central Tehran) have more air pollution.9
Data sources
Leukaemia data
Information about patients with leukaemia (acute lymphoblastic leukaemia (ALL) and AML residing in Tehran, diagnosed between 2010 and 2016 and their residential address (on a district basis) were obtained from the Ministry of Health’s Cancer Registry.
Exposure assessment
The annual mean concentrations of several pollutants in the 22 districts of Tehran were obtained from land use regression models developed in previous studies, for PM10, SO2, NO, NO2 and NOX in Tehran, which were based on measurements conducted at 23 regulatory network monitoring sites in 2010.10 11 Data about volatile organic compounds (VOCs) were taken from a previous study.12 The average of sampling site estimates for each pollutant, in each district was determined and included in the analyses of this study.
Covariates
District level data including urban green space per capita, life expectancy and socioeconomic status were extracted from the Urban Health Equity Assessment and Response Tool (Urban HEART-2), which has been conducted in the 22 districts of Tehran. A detailed description of the Urban HEART-2 study can be found elsewhere.13 The socioeconomic indicators of the 22 districts of Tehran was extracted from a study conducted by Sadeghi et al.14
Statistical analyses
This study used LPA to investigate the patterns of multiple air pollutants exposure. LPA is a statistical method to identify unobserved subgroups (profile) within populations based on observed variables. LPA has several advantages over traditional methods, such as cluster analysis, for example, it does not require researchers to specify the number of profiles in advance, which is more suitable for addressing research questions that are exploratory in nature. Moreover, unlike cluster analysis that assigns individuals to clusters absolutely, LPA assigns individuals to subgroups probabilistically.15
LPA as a person-centred approach can be used to examine the patterns of multiple air pollutants. LPA is a statistical method for identifying unobserved subgroups within populations based on observed indicators. In contrast to traditional methods, such as cluster analysis, LPA has several advantages. LPA does not require researchers to determine the number of profiles beforehand, and this is more suitable to answer research questions that are exploratory in nature. Also, empirical indicators are available to determine the optimal number of profiles. In addition, LPA allocates individuals to subgroups probabilistically, taking into account the rate of classification uncertainty, and uses multiple statistical indices for determining the optimal number of subgroups.
Most air pollutants in this study had a skewed distribution and were transformed by natural logarithm before LPA, except PM10 and SO2. Several latent profile models were performed, ranging from two to five latent profiles. The most appropriate number of subgroups was identified based on statistical criteria and profile interpretability. The statistical criteria included the Akaike’s Information Criterion (AIC), the Bayesian Information Criterion (BIC) and the sample-size adjusted Bayesian information criterion (a-BIC), the Lo-Mendell-Rubin likelihood ratio test (LMR-LRT) and the Vuong-Lo-Mendell-Rubin likelihood ratio tests (VLMR-LRT). Smaller values of the AIC, BIC and aBIC indicate a better fit model.16
A significant p value of the LMR LRT and VLMR LRT (ie, p<0.05) indicates a significant improvement in model fit in the k-class model compared with the (k − 1)-class model and thus rejects the (k − 1)-class model and suggests choosing a model with k classes.
In other words, each number of classes (or profiles, shown as k) is compared with the number of classes which is 1 unit less (k − 1), and if the VLRT and LMRT values are not significant for higher classes, the model with less classes (k− 1) is preferred and will get chosen.17
Data preparation was done in Stata V.14. LPA was conducted using Mplus V.7.4. One-way analysis of variance and posthoc follow-up tests were used to investigate the differences between profiles of multiple pollutions in terms of each component of air pollution. Management of missing data and other statistical preparation details have been mentioned in our previous publication.8
Kolmogorov-Smirnov test was used to test the normality of the pollutants data and because the data were not normally distributed, Spearman’s correlation test was used to estimate the correlation between pollutants. As the number of leukaemia cases was overdispersed, negative binomial (NB) regression was performed to estimate the incidence rate ratios (IRR) and their 95% CI for each air pollutant and multiple pollution profiles, adjusted for age, sex and district level (by using them as a covariate). Statistical analyses were performed using Mplus V.7.4 and Stata V.14 (Stata; College Station, Texas, USA). ArcGIS V.10.8 was used for exposure assignment to districts and data visualisation.
Patient and public involvement
Patients and the public were not involved in the design and conduct of this research.
Results
Summary statistics of patients, air pollutants and information about the area under study are shown in table 1. The total number of leukaemia cases in 2010–2016 in all districts of Tehran was 3237. The distribution of patients with leukaemia in different districts of Tehran is shown in figure 1. The highest numbers of patients with leukaemia per 100 000 people were in districts 6, 3, 7 and 2, respectively (figure 1).
Table 1.
Description of characteristics of patients, air pollution and district-level covariates
| Individual-level variables | |
| Number of patients with leukaemia patients | 3237 |
| Age of patients (year) | |
| Median (1st–3rd quartile range) | 55 (16–69.1) |
| Gender of patients (male) | |
| Per cent (number) | 59.7 (1934) |
| Grading | |
| I | 4.8 (156) |
| II | 33.2 (1076) |
| III | 2.8 (90) |
| IV | 1 (32) |
| Unknown | 58.2 (1883) |
| Topography | |
| Lymphoid | 68.9 (2231) |
| Myeloid | 31.1 (1006) |
| Air pollutants | Median (1st–3rd quartile range) |
| PM10 (μg/m3) | 101.32 (82.35–123.82) |
| SO2 (ppb) | 52.42 (26.38–77.19) |
| NO2 (ppb) | 46.43 (39.95–55.74) |
| NO (ppb) | 78.13 (44.47–118.84) |
| NOX (ppb) | 112.12 (83.24–158.49) |
| Benzene (μg/m3) | 8.12 (7.02–9.85) |
| Toluene (μg/m3) | 24.96 (20.85–29.45) |
| Ethylbenzene (μg/m3) | 5.90 (4.97–6.94) |
| p-xylene (μg/m3) | 5.71 (4.88–6.52) |
| o-xylene (μg/m3) | 5.84 (4.86–7.46) |
| m-xylene (μg/m3) | 10.71 (9.06–12.81) |
| TBTEX (μg/m3) | 60.57 (52.29–70.15) |
| District-level variables | Median (1st–3rd quartile range) |
| Number of districts | 22 |
| Total population (persons) | 319 443 (263 536-421 225) |
| Urban green space, per capita (m2 per 1000 people) | 13.9 (10.7–18) |
| Life expectancy (year) | 75.9 (75.4–76.7) |
| Socioeconomic status * | 49.95 (44.21–53.34) |
*Socioeconomic status score according to the 16 variables mentioned in the Method section. This variable does not have a unit. The lowest value of this score was 36.6 and the highest was 67.4.
Figure 1.
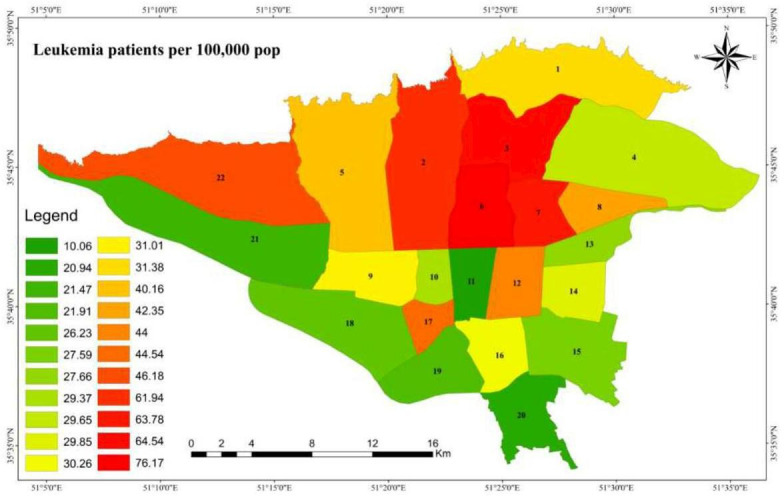
Spatial distribution of patients with leukaemia (number of cases in 100 000) in different areas of Tehran in 2014–2016 (the labels on the map are district numbers).
As shown in figure 2, there was a strong correlation between pollutants, most notably for VOCs (benzene, toluene, m-xylene, p-xylene, o-xylene and TBTEX) (p<0.001). The positive correlation between NO and NOx was weaker (r=0.56).
Figure 2.
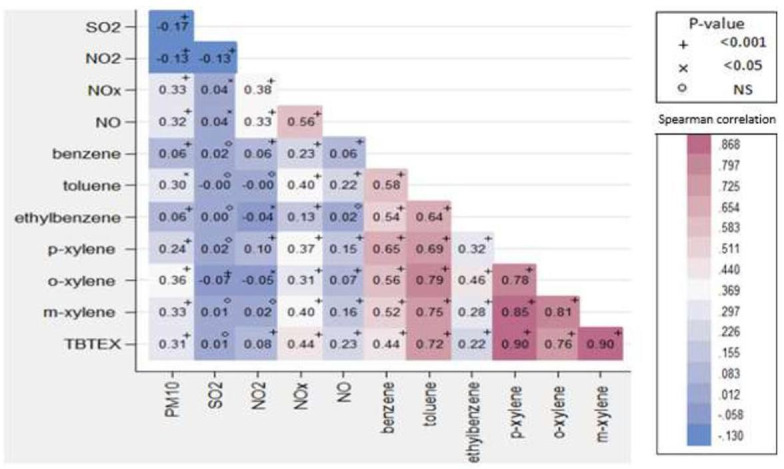
Spearman correlation matrix of air pollutants in the 22 districts of Tehran, Iran, in 2014–2016.
Fit indices for the different LPA models are displayed in table 2. Several latent profile models were considered. Although the AIC, BIC and a-BIC of the two-profile were more than other models, the LMR of LRT (Lo-Mendell-Rubin likelihood ratio test) and VLMR (Vuong-Lo-Mendell-Rubin likelihood ratio test) were significant in the two-profile model.
Table 2.
Fit indices for different latent profile models with number of profiles ranging from 2 to 5
| Profile | Log-likelihood | AIC | BIC | a-BIC | LMR-LRT | VLMR-LRT | Entropy |
| 2 profile | −35505.2 | 71 084.5 | 71 309.6 | 71 192 | 13 725.8* | 13 856.4* | 0.908 |
| 3 profile | −31630.4 | 63 360.8 | 63 665 | 63 506.1 | 7676.6 | 7749.6 | 0.941 |
| 4 profile | −29593.4 | 59 312.9 | 59 696.1 | 59 495.9 | 4035.5 | 4073.9 | 0.951 |
| 5 profile | −27590.1 | 55 332.2 | 55 794.5 | 55 553 | 3968.9 | 4006.7 | 0.968 |
*P<0.001.
Models with a significant Lo-Mendell-Rubin likelihood ratio test and Vuong-Lo-Mendell-Rubin likelihood ratio test were preferred. The bolded fit indices indicate that profile 2 was the optimal latent profile model.
a-BIC, sample size adjusted BIC; AIC, Akaike’s Information Criterion; BIC, Bayesian Information Criterion; LMR-LRT, Lo-Mendell-Rubin likelihood ratio test; VLMR-LRT, Vuong-Lo-Mendell-Rubin likelihood ratio test.
Figure 3 shows the multipollution profiles. Profile 1 had the lowest scores for all pollutants including (PM10, SO2, NO, NO2, NOX, benzene, toluene, ethylbenzene, m-xylene, p-xylene, o-xylene and TBTEX). We labelled this profile as ‘low multiple-pollution’. Summary statistics for each pollutant in different profiles are shown in table 3. There was a significant difference between the means of all pollutants in the two profiles, except for SO2.
Figure 3.

Standard mean values of pollutants in the two latent profiles in different areas of Tehran, Iran, in 2014–2016.
Table 3.
The mean of air pollutants in different profiles
| Pollutant | Profile | Mean | SD | T | P value |
| PM10 (μg/m3) | Profile 1 | 87.2 | 38.3 | −21.6 | <0.001 |
| Profile 2 | 114.2 | 31.1 | |||
| SO2 (ppb) | Profile 1 | 54.8 | 45.7 | −0.32 | 0.74 |
| Profile2 | 55.3 | 53.7 | |||
| NO2 (ppb) | Profile1 | 48.4 | 18.2 | −3.84 | <0.001 |
| Profile 2 | 50.7 | 15.7 | |||
| NO (ppb) | Profile 1 | 68.9 | 51.6 | −19.8 | <0.001 |
| Profile 2 | 108.9 | 63.5 | |||
| NOX (ppb) | Profile 1 | 91.6 | 38.8 | −33.55 | <0.001 |
| Profile 2 | 163.8 | 80.7 | |||
| Benzene (μg/m3) | Profile 1 | 8.9 | 3.2 | −26.3 | <0.001 |
| Profile 2 | 10.1 | 3.6 | |||
| Toluene (μg/m3) | Profile1 | 19.6 | 3.5 | −56.9 | <0.001 |
| Profile 2 | 30.2 | 6.8 | |||
| Ethylbenzene (μg/m3) | Profile 1 | 4.7 | 1.1 | −17.4 | <0.001 |
| Profile 2 | 7.3 | 6.1 | |||
| p-xylene (μg/m3) | Profile 1 | 4.7 | 0.6 | −49.9 | <0.001 |
| Profile 2 | 6.7 | 1.5 | |||
| o-xylene (μg/m3) | Profile 1 | 4.8 | 0.8 | −53.8 | <0.001 |
| Profile 2 | 7.4 | 1.7 | |||
| m-xylene (μg/m3) | Profile 1 | 8.6 | 1.5 | −57.1 | <0.001 |
| Profile 2 | 13.2 | 2.9 | |||
| TBTEX (μg/m3) | Profile 1 | 49.5 | 7.8 | −53.1 | <0.001 |
| Profile 2 | 72.9 | 16.5 |
Table 4 shows the IRR estimates and 95% CI by single-pollutant and multiple-pollutant multivariable NB regression models, adjusted for age, gender, socioeconomic status and life expectancy.
Table 4.
The estimated incidence rate ratios using negative binomial regression analyses for the effect of each 10 unit increase in air pollutants on total leukaemia incidence across the districts of Tehran
| Model 1 | Model 2 | Model 3 | ||||
| IRR (95% CI) | P value | IRR (95% CI) | P-value | IRR (95% CI) | P value | |
| Pollutant | ||||||
| Single-pollutant | ||||||
| Annual PM10 (μg/m3) | 0.95 (0.87 to 1.05) | 0.352 | 0.92 (0.82 to 1.03) | 0.165 | 1.03 (0.95 to 1.12) | 0.376 |
| Annual SO2 (ppb) | 0.99 (0.89 to 1.09) | 0.901 | 0.99 (0.98 to 1.01) | 0.775 | 0.97 (0.91 to 1.05) | 0.575 |
| Annual NO2 (ppb) | 1.35 (1.11 to 1.64) | 0.002 | 1.35 (1.11 to 1.64) | 0.002 | 1.19 (0.99 to 1.43) | 0.062 |
| Annual NO (ppb) | 1.02 (0.98 to 1.07) | 0.238 | 1.03 (0.97 to 1.08) | 0.235 | 1.02 (0.99 to 1.06) | 0.130 |
| Annual NOX (ppb) | 1.04 (1.01 to 1.08) | 0.003 | 1.07 (1.03 to 1.11) | <0.001 | 1.03 (1.003 to 1.06) | 0.029 |
| Benzene (μg/m3) | 0.97 (0.85 to 1.11) | 0.696 | 0.97 (0.85 to 1.11) | 0.965 | 0.92 (0.83 to 1.02) | 0.119 |
| Toluene (μg/m3) | 1.11 (0.78 to 1.56) | 0.550 | 1.14 (0.71 to 1.85) | 0.570 | 1.11 (0.85 to 1.44) | 0.436 |
| Ethylbenzene (μg/m3) | 1.08 (0.27 to 4.28) | 0.906 | 0.97 (0.19 to 4.91) | 0.974 | 1.09 (0.38 to 3.16) | 0.865 |
| p-xylene (μg/m3) | 1.23 (0.14 to 10.23) | 0.844 | 1.002 (0.04 to 22.77) | 0.999 | 1.24 (0.23 to 6.42) | 0.797 |
| o-xylene (μg/m3) | 0.48 (0.09 to 2.57) | 0.397 | 0.29 (0.04 to 2.03) | 0.214 | 0.77 (0.21 to 2.84) | 0.705 |
| m-xylene (μg/m3) | 1.14 (0.48 to 2.72) | 0.760 | 1.11 (0.28 to 4.36) | 0.876 | 1.20 (0.61 to 2.34) | 0.589 |
| TBTEX (μg/m3) | 1.04 (0.89 to 1.23) | 0.561 | 1.07 (0.84 to 1.36) | 0.575 | 1.03 (0.91 to 1.17) | 0.564 |
| Multipollutant | ||||||
| Profile 1 (low pollution) | Ref | Ref | Ref | |||
| Profile 2 (high pollution) | 1.003 (0.99 to 1.009) | 0.227 | 1.005 (0.99 to 1.01) | 0.168 | 1.003 (0.99 to 1.007) | 0.168 |
Model 1: Adjusted for age and gender.
Model 2: Adjusted for age, gender and urban green space per capita (m2 per 1000 people).
Model 3: Adjusted for age, gender, socioeconomic status, life expectancy.
The incidence rate ratio of leukaemia is estimated for each 10 unit increase in pollutants.
Statistically significant IRRs are bolded.
IRR, incidence rate ratio.
In single-pollutant models, NO2 and NOx were significantly associated with increased leukaemia incidence in model 1 (adjusted for age and gender) and also in model 2 (adjusted in addition for urban green space per capita) with IRR (95% CI) of model 2, respectively, 1.35 (1.11–1.64) and 1.07 (1.03–1.11) per 10 ppb increase in pollutants. In model 3, after adjustment for age, gender, socioeconomic status and life expectancy, only NOX was significantly associated with increased leukaemia incidence with an IRR (95% CI) of 1.03 (1.003–1.06) per 10 ppb increase in NOx. However, NO2 was borderline significantly associated with increased leukaemia incidence (IRR=1.19, CI 95%=0.99–1.43) in this model.
In multipollutant models, the high multiple-air-pollutants profile was associated with higher leukaemia incidence when compared with the low multiple-air-pollutants profile, but this association did not reach significance.
Tables 5 and 6 show the IRR (95% CI) estimates by single-pollutant and multiple-pollutant multivariable NB regression models for acute myeloid and lymphoid leukaemia incidence, respectively. NO, NO2 and NOx were related to acute increased lymphoid leukaemia incidence, while NO2 and TBTEX were related to increased AML incidence.
Table 5.
The estimated incidence rate ratios using negative binomial regression analyses for the effect of each 10 unit increase in air pollutants on acute myeloid leukaemia incidence in the districts of Tehran
| Model 1 | Model 2 | Model 3 | ||||
| RR (95% CI) | P value | RR (95% CI) | P value | RR (95% CI) | P value | |
| Pollutant | ||||||
| Single-pollutant | ||||||
| Annual PM10 (μg/m3) | 0.97 (0.88 to 1.06) | 0.547 | 0.94 (0.82 to 1.08) | 0.542 | 1.01 (0.89 to 1.14) | 0.846 |
| Annual SO2 (ppb) | 1.004 (0.88 to 1.13) | 0.949 | 1.008 (0.88 to 1.15) | 0.904 | 1.01 (0.91 to 1.11) | 0.814 |
| Annual NO2 (ppb) | 1.35 (1.11 to 1.63) | 0.002 | 1.35 (1.11 to 1.63) | 0.002 | 1.22 (0.98 to 1.52) | 0.068 |
| Annual NO (ppb) | 1.02 (0.98 to 1.07) | 0.260 | 1.03 (0.98 to 1.09) | 0.172 | 0.99 (0.94 to 1.05) | 0.966 |
| Annual NOX (ppb) | 0.96 (0.93 to 1.001) | 0.057 | 0.95 (0.92 to 0.99) | 0.035 | 0.97 (0.939 to 1.01) | 0.240 |
| Benzene (μg/m3) | 1.71 (0.44 to 6.66) | 0.436 | 4.93 (0.60 to 40.17) | 0.136 | 1.46 (0.38 to 5.47) | 0.574 |
| Toluene (μg/m3) | 1.19 (0.83 to 1.71) | 0.334 | 1.71 (0.97 to 3.02) | 0.061 | 1.23 (0.85 to 1.77) | 0.254 |
| Ethylbenzene (μg/m3) | 1.52 (0.27 to 8.53) | 0.634 | 4.59 (0.25 to 82.81) | 0.301 | 1.68 (0.31 to 9.03) | 0.545 |
| p-xylene (μg/m3) | 1.08 (0.87 to 1.35) | 0.454 | 23.75 (0.55 to 102.3) | 0.099 | 1.78 (0.18 to 17.66) | 0.620 |
| o-xylene (μg/m3) | 0.81 (0.15 to 4.31) | 0.804 | 0.77 (0.06 to 8.66) | 0.837 | 0.71 (0.13 to 3.87) | 0.701 |
| m-xylene (μg/m3) | 1.63 (0.61 to 4.31) | 0.324 | 3.03 (0.78 to 11.69) | 0.107 | 1.83 (0.74 to 4.52) | 0.190 |
| TBTEX (μg/m3) | 1.11 (0.92 to 1.31) | 0.255 | 1.41 (1.07 to 1.85) | 0.014 | 1.09 (0.91 to 1.32) | 0.314 |
| Multipollutant | ||||||
| Profile 1 (low pollution) | Ref | Ref | Ref | |||
| Profile 2 (high pollution) | 1.003 (0.99 to 1.01) | 0.265 | 1.003 (0.99 to 1.01) | 0.259 | 1.004 (0.99 to 1.01) | 0.113 |
Model 1: Adjusted for age and gender.
Model 2: Adjusted for age, gender and urban green space per capita (m2 per 1000 people).
Model 3: Adjusted for age, gender, socioeconomic status, life expectancy.
The incidence rate ratio of leukaemia is estimated for each 10 unit increase in pollutants.
Statistically significant IRRs are bolded.
IRR, incidence rate ratio.
Table 6.
The estimated incidence rate ratios using negative binomial regression analyses for the effect of each 10 unit increase in air pollutants on acute lymphoid leukaemia incidence in the districts of Tehran
| Model 1 | Model 2 | Model 3 | ||||
| RR (95% CI) | P value | RR (95% CI) | P value | RR (95% CI) | P value | |
| Pollutant | ||||||
| Single-pollutant | ||||||
| Annual PM10 (μg/m3) | 0.94 (0.87 to 1.02) | 0.207 | 0.91 (0.83 to 1.01) | 0.096 | 0.99 (0.91 to 1.07) | 0.822 |
| Annual SO2 (ppb) | 1.08 (0.96 to 1.21) | 0.181 | 1.08 (0.96 to 1.22) | 0.172 | 1.03 (0.95 to 1.12) | 0.428 |
| Annual NO2 (ppb) | 1.29 (1.07 to 1.55) | 0.006 | 1.29 (1.07 to 1.54) | 0.006 | 1.07 (0.90 to 1.27) | 0.425 |
| Annual NO (ppb) | 1.03 (0.98 to 1.08) | 0.157 | 1.04 (0.99 to 1.10) | 0.101 | 1.04 (0.99 to 1.08) | 0.052 |
| Annual NOX (ppb) | 1.04 (1.01 to 1.08) | 0.010 | 1.06 (1.02 to 1.10) | 0.002 | 1.01 (0.98 to 1.05) | 0.310 |
| Benzene (μg/m3) | 1.21 (0.36 to 4.01) | 0.754 | 1.33 (0.27 to 6.48) | 0.722 | 0.46 (0.17 to 1.24) | 0.129 |
| Toluene (μg/m3) | 1.01 (0.72 to 1.41) | 0.949 | 1.006 (0.65 to 1.54) | 0.978 | 0.92 (0.71 to 1.21) | 0.585 |
| Ethylbenzene (μg/m3) | 0.84 (0.33 to 2.13) | 0.723 | 0.78 (0.27 to 2.24) | 0.658 | 0.69 (0.32 to 1.46) | 0.336 |
| p-xylene (μg/m3) | 0.41 (0.04 to 3.51) | 0.422 | 0.21 (0.01 to 3.13) | 0.258 | 0.28 (0.05 to 1.42) | 0.126 |
| o-xylene (μg/m3) | 0.36 (0.08 to 1.57) | 0.175 | 0.23 (0.04 to 1.26) | 0.091 | 0.32 (0.10 to 1.03) | 0.058 |
| m-xylene (μg/m3) | 0.83 (0.31 to 2.16) | 0.705 | 0.64 (0.16 to 2.55) | 0.533 | 0.58 (0.28 to 1.20) | 0.144 |
| TBTEX (μg/m3) | 1.001 (0.85 to 1.17) | 0.988 | 0.99 (0.80 to 1.23) | 0.971 | 0.95 (0.84 to 1.08) | 0.433 |
| Multipollutant | ||||||
| Profile 1 (low pollution) | Ref | Ref | Ref | |||
| Profile 2 (high pollution) | 1.002 (0.99 to 1.009) | 0.427 | 1.003 (0.99 to 1.01) | 0.343 | 0.99 (0.99 to 1.004) | 0.884 |
Model 1: Adjusted for age and gender.
Model 2: Adjusted for age, gender and urban green space, per capita (m2 per 1000 people).
Model 3: Adjusted for age, gender, socioeconomic status life expectancy.
The incidence rate ratio of leukaemia is estimated for each 10 unit increase in pollutants.
Statistically significant IRRs are bolded.
IRR, incidence rate ratio.
Tables 7 and 8 show the IRR (95% CI) estimates by single-pollutant and multiple-pollutant multivariable NB regression models for total acute leukaemia incidence, respectively, in children and adults. Increase in all single pollutants except SO2 and high multiple pollutants were related to increased acute leukaemia incidence in children (≤14 years old), while nitrogen oxides, toluene, ethylbenzene, o-xylene and TBTEX were related to increased acute leukaemia incidence among adults.
Table 7.
The estimated incidence rate ratios using negative binomial regression analyses for the effect of each 10 unit increase in air pollutants on total leukaemia incidence in children (≤14 years old) across the districts of Tehran
| |
Model 1 | Model 2 | Model 3 | |||
| IRR (95% CI) | P value | IRR (95% CI) | P value | IRR (95% CI) | P value | |
| Pollutant | ||||||
| Single-pollutant | ||||||
| Annual PM10 (μg/m3) | 0.87 (0.84 to 0.92) | <0.001 | 0.78 (0.74 to 0.82) | <0.001 | 1.11 (1.03 to 1.18) | 0.003 |
| Annual SO2 (ppb) | 0.95 (0.91 to 0.99) | 0.036 | 0.96 (0.92 to 1.008) | 0.106 | 0.99 (0.95 to 1.04) | 0.712 |
| Annual NO2 (ppb) | 1.45 (1.32 to 1.61) | <0.001 | 1.45 (1.31 to 1.60) | <0.001 | 1.21 (1.08 to 1.35) | 0.001 |
| Annual NO (ppb) | 0.93 (0.91 to 0.96) | <0.001 | 0.90 (0.88 to 0.93) | <0.001 | 1.05 (1.02 to 1.09) | 0.005 |
| Annual NOX (ppb) | 1.04 (1.02 to 1.07) | <0.001 | 1.04 (1.01 to 1.07) | 0.004 | 1.08 (1.05 to 1.10) | <0.001 |
| Benzene (μg/m3) | 0.49 (0.23 to 1.05) | 0.068 | 0.30 (0.14 to 0.67) | 0.003 | 5.87 (2.43 to 14.16) | <0.001 |
| Toluene (μg/m3) | 0.75 (0.63 to 0.89) | 0.001 | 0.63 (0.52 to 0.76) | <0.001 | 1.77 (1.42 to 2.22) | <0.001 |
| Ethylbenzene (μg/m3) | 0.17 (0.07 to 0.42) | <0.001 | 0.06 (0.02 to 0.16) | <0.001 | 21.78 (6.02 to 78.85) | <0.001 |
| p-xylene (μg/m3) | 0.14 (0.05 to 0.43) | 0.001 | 0.02 (0.01 to 0.08) | <0.001 | 17.83 (4.22 to 75.29) | <0.001 |
| o-xylene (μg/m3) | 0.11 (0.05 to 0.24) | 0.001 | 0.04 (0.01 to 0.08) | <0.001 | 19.89 (5.19 to 76.24) | <0.001 |
| m-xylene (μg/m3) | 0.37 (0.24 to 0.58) | <0.001 | 0.20 (0.12 to 0.33) | <0.001 | 4.08 (2.13 to 7.80) | <0.001 |
| TBTEX (μg/m3) | 0.89 (0.82 to 0.97) | 0.007 | 0.79 (0.73 to 0.87) | <0.001 | 1.29 (1.16 to 1.44) | <0.001 |
| Multipollutant | ||||||
| Profile 1 (low pollution) | Ref | Ref | Ref | |||
| Profile 2 (high pollution) | 1.003 (1.001 to 1.006) | 0.001 | 1.004 (1.001 to 1.007) | 0.016 | 1.008 (1.005 to 1.01) | <0.001 |
Model 1: Adjusted for age and gender.
Model 2: Adjusted for age, gender and urban green space per capita (m2 per 1000 people).
Model 3: Adjusted for age, gender, socioeconomic status, life expectancy.
The incidence rate ratio of leukaemia is estimated for each 10 unit increase in pollutants.
Statistically significant IRRs are bolded.
IRR, incidence rate ratio.
Table 8.
The estimated incidence rate ratios using negative binomial regression analyses for the effect of each 10 unit increase in air pollutants on total leukaemia incidence in adults across the districts of Tehran
| Model 1 | Model 2 | Model 3 | ||||
| IRR (95% CI) | P value | IRR (95% CI) | P value | IRR (95% CI) | P value | |
| Pollutant | ||||||
| Single-pollutant | ||||||
| Annual PM10 (μg/m3) | 0.92 (0.90 to 0.95) | <0.001 | 0.89 (0.87 to 0.92) | <0.001 | 1.01 (0.97 to 1.05) | 0.479 |
| Annual SO2 (ppb) | 0.96 (0.94 to 0.99) | 0.012 | 0.97 (0.95 to 1.01) | 0.109 | 0.98 (0.96 to 1.02) | 0.390 |
| Annual NO2 (ppb) | 1.21 (1.14 to 1.27) | <0.001 | 1.19 (1.13 to 1.26) | <0.001 | 1.10 (1.03 to 1.18) | 0.003 |
| Annual NO (ppb) | 0.98 (0.97 to 0.99) | 0.028 | 0.97 (0.95 to 0.98) | <0.001 | 1.03 (1.01 to 1.05) | 0.005 |
| Annual NOX (ppb) | 1.02 (1.00 to 1.03) | 0.008 | 1.01 (0.99 to 1.02) | 0.338 | 1.03 (1.01 to 1.04) | <0.001 |
| Benzene (μg/m3) | 0.66 (0.42 to 1.05) | 0.078 | 0.44 (0.27 to 0.72) | 0.001 | 1.44 (0.87 to 2.40) | 0.158 |
| Toluene (μg/m3) | 0.87 (0.78 to 0.97) | 0.017 | 0.79 (0.71 to 0.89) | <0.001 | 1.19 (1.05 to 1.37) | 0.008 |
| Ethylbenzene (μg/m3) | 0.36 (0.19 to 0.67) | 0.001 | 0.20 (0.11 to 0.38) | <0.001 | 2.28 (1.05 to 4.94) | 0.037 |
| p-xylene (μg/m3) | 0.39 (0.19 to 0.80) | 0.010 | 0.14 (0.06 to 0.30) | <0.001 | 1.98 (0.86 to 4.55) | 0.106 |
| o-xylene (μg/m3) | 0.33 (0.19 to 0.55) | <0.001 | 0.22 (0.13 to 0.37) | <0.001 | 3.03 (1.36 to 6.74) | 0.006 |
| m-xylene (μg/m3) | 0.59 (0.44 to 0.78) | <0.001 | 0.43 (0.31 to 0.58) | <0.001 | 1.39 (0.95 to 2.02) | 0.085 |
| TBTEX (μg/m3) | 0.94 (0.89 to 0.99) | 0.042 | 0.88 (0.83 to 0.94) | <0.001 | 1.08 (1.01 to 1.15) | 0.019 |
| Multipollutant | ||||||
| Profile 1 (low pollution) | Ref | Ref | Ref | |||
| Profile 2 (high pollution) | 1.002 (1.00 to 1.003) | 0.017 | 0.99 (0.99 to 1.001) | 0.892 | 1.003 (1.001 to 1.005) | <0.001 |
Model 1: Adjusted for age and gender.
Model 2: Adjusted for age, gender and urban green space per capita (m2 per 1000 people).
Model 3: Adjusted for age, gender, socioeconomic status, life expectancy.
The incidence rate ratio of leukaemia is estimated for each 10 unit increase in pollutants.
Statistically significant IRRs are bolded.
IRR, incidence rate ratio.
Discussion
The findings of our study show that exposure to air pollutants, such as nitrogen oxides and VOCs, may be associated with the incidence of leukaemia. Our study was the first to investigate the effect of single and multiple ambient air pollutants on leukaemia in Iran.
Leukaemia is one of the most common cancers in children and adults. The cause of leukaemia is currently unknown.18 However, some sources have suggested that genetic and transgenic mutations due to environmental factors may contribute to leukaemia.1 19 A study in Shanghai, China showed that air pollution from industrial waste gas emissions was associated with the incidence of several cancers including leukaemia.20
Many experimental studies have shown that air pollutants may be carcinogenic by causing DNA damage and mutations.21–26
A review indicated that exposure to air pollutants is associated with leukaemia stronger than other cancers.18 Carlos-Wallace et al also conducted a meta-analysis and reported associations between childhood leukaemia and benzene exposure. They indicated that in studies that evaluated benzene versus all solvents, the pooled RR (relative risk from meta-analysis) was higher for maternal exposure compared with paternal exposure. For NO2, an excess risk was reported in concentration-response meta-analysis from 40 µg/m3 to 60 µg/m3; however, the increase was not statistically significant and was mainly related to ALL.6
Our study showed some associations between benzene and leukaemia incidence among children. Similarly, a study in the UK revealed that there was an increased risk of leukaemia from low-level exposure to benzene from smoking and that benzene may contribute to up to a third of smoking-induced leukaemia. The contribution of benzene to smoking-induced leukaemia was estimated to be between 9% and 24%. For AML, this contribution was estimated as 11%–30%.27 Janitz et al conducted a case-control study between 1997 and 2012 including 307 patients with acute leukaemia from the Oklahoma Central Cancer Registry and 1013 controls matched on week of birth from birth certificates and showed no association between benzene and childhood leukaemia, in Oklahoma. However, based on the analysis of quartiles, they indicated that there was a positive concentration-response relation between benzene and AML.28
Our study indicated that NO2 increased the incidence of acute lymphoid leukaemia, and total leukaemia among children and adults. Similarly, findings of the population-based study by Ribeiro et al in São Paulo, Brazil has shown that NO2 and traffic density were associated with Hodgkin lymphoma and lymphoid leukaemia in children; and the variations in the IRR in gender and SES groups may be because of differences in underlying risk and exposure profiles.29 In addition, Raaschou-Nielsen et al conducted a nationwide case-control study in Denmark and indicated that long-term exposure to traffic-related air pollutants (NOx and NO2) was associated with AML, but not other subtypes of leukaemia, in the general population.30 Our study revealed that NO, NO2 and NOx are related to increased acute lymphoid leukaemia incidence, while NO2 and TBTEX are related to increased AML incidence, while a Canadian population-based case-control study revealed a weak association between all forms of leukaemia only at low concentrations of NO2. The study showed an ‘n-shaped’ response function between exposure to NO2 and all forms of leukaemia. The OR was 1.20 (95% CI 0.97 to 1.48) from the 10th percentile (4.51 ppb) to the median (14.66 ppb), then the OR decreased to 0.79 (95% CI 0.68, 0.93) from the 75th percentile (22.75) to the 90th (29.7 ppb) range.31 Some differences in results may be attributable to differences in settings and population characteristics.
In a large nationwide population-based case-control study in Denmark, Taj et al showed a high risk for overall leukaemia in association with secondary inorganic aerosols including nitrate (NO3) and that AML was associated with NO3,32 which was similar to our findings.
Studies focusing on the association between childhood leukaemia and exposure to air pollutants have had inconsistent results. Ghosh et al in California revealed that prenatal exposure to traffic-related air pollution was associated with the risk of ALL.33 A population-based study from Canada suggested that exposure to ambient air pollution during the first trimester of pregnancy may cause astrocytoma and ALL.34 However, Peckham-Gregory et al conducted a population-based case-control study in Texas to evaluate the association between maternal residential proximity to major roadways and developing ALL and AML in children, and reached different results. They indicated that mothers who lived closer than 500 m to a major roadway and mothers who lived in high roadway density areas were not more likely to have a child with ALL or AML.35
Although many studies have shown a possible relation between air pollution and leukaemia, there is still a need for more high-quality studies with higher sample sizes, and better control of confounders.
Strengths and limitation
In this study, we estimated the simultaneous effect of several different air pollutants on the incidence of leukaemia. However, our study had several limitations. We did not use individual-level data; thus, we were not able to control for confounding variables at individual-level, such as blood group, family history of cancer, taking medicine during pregnancy, parents’ job, history of radiation, smoking and other factors such as genetics, nutrition status, cultural context and behavioural patterns. But we did include potential confounding covariates at regional level.
The other major limitation of this study is our estimates of exposure. First, our study used some more recent air pollution data, not past life-time exposure estimates, because we did not have a better option. In addition, we did not have data on the length of residence of patients in the study regions, and life-time relocation or migration. Second, we assigned the same exposure concentrations to all people living in the same area. Although the mean area level values may well reflect the average exposure levels of the inhabitants, our approach ignored within-area variation, which has been demonstrated in previous studies in Tehran.10–12
Conclusion
This is the first study to examine the association between multiple air pollutants and leukaemia incidence in Iran. Our findings suggest that exposure to VOCs, nitrogen oxides and/or multiple ambient air pollutants may be associated with increased leukaemia incidence in Tehran. Further research with individual data and better control of confounding covariates is needed to confirm the role of air pollution in human leukaemia.
Supplementary Material
Acknowledgments
The authors thank the Cancer Department of the Iranian Ministry of Health and the Tehran Air Quality Control Company (AQCC), which provided the data for this project.
Footnotes
Contributors: ZKh, NKh and MR: studied the design. ZKh, NKh, MP: conceptualization.ZKh, MR and MP: data cleaning. KE, MEA, HA, SMT-Sh, NK: data management and statistical analysis and statistical inference. ZKh, MR, MP, HA, ME, NKh and MR: writing the original draft. ZKh, NKh, MP, MR, MEA, KE, SMT-S, NK, HA: review and editing. All authors participated in revision of the final draft and agreed on the final content.
Funding: This study was financially supported by the Cancer Research Center of Shahid Beheshti University of Medical Sciences, Tehran by Grant No. 25544. HA is supported by Novo Nordisk Foundation Challenge Programme: Harnessing the Power of Big Data to Address the Societal Challenge of Aging (NNF17OC0027812).
Competing interests: None declared.
Patient and public involvement: Patients and/or the public were not involved in the design, or conduct, or reporting, or dissemination plans of this research.
Provenance and peer review: Not commissioned; externally peer reviewed.
Data availability statement
Data are available on reasonable request. This data are not publicly available but can be inquired by formal request in aggregated and/or anonymous form from the Ministry of Health of Iran.
Ethics statements
Patient consent for publication
Not applicable.
References
- 1.Lien S-YA, Young L, Gau B-S, et al. Meta-prediction of MTHFR gene polymorphism-mutations, air pollution, and risks of leukemia among world populations. Oncotarget 2017;8:4387–98. 10.18632/oncotarget.13876 [DOI] [PMC free article] [PubMed] [Google Scholar]
- 2.Sung H, Ferlay J, Siegel RL, et al. Global cancer statistics 2020: GLOBOCAN estimates of incidence and mortality worldwide for 36 cancers in 185 countries. CA Cancer J Clin 2021;71:209–49. 10.3322/caac.21660 [DOI] [PubMed] [Google Scholar]
- 3.Roshandel G, Ghanbari-Motlagh A, Partovipour E, et al. Cancer incidence in Iran in 2014: results of the Iranian national population-based cancer registry. Cancer Epidemiol 2019;61: :50–8. 10.1016/j.canep.2019.05.009 [DOI] [PubMed] [Google Scholar]
- 4.Turner MC, Andersen ZJ, Baccarelli A. Outdoor air pollution and cancer: an overview of the current evidence and public health recommendations. CA Cancer J Clin 2020. 10.3322/caac.21632. [Epub ahead of print: 25 Aug 2020]. [DOI] [PMC free article] [PubMed] [Google Scholar]
- 5.Ou JY, Kirchhoff AC, Hanson HA. Air pollution across the cancer continuum: extending our understanding of the relationship between environmental exposures and cancer. Cancer Epidemiol Biomarkers Prev 2020;29:1876–9. 10.1158/1055-9965.EPI-19-1588 [DOI] [PMC free article] [PubMed] [Google Scholar]
- 6.Filippini T, et al. , Association between Outdoor Air Pollution and Childhood Leukemia . A systematic review and dose-response meta-analysis. Environ Health Perspect 2019;127:46002. [DOI] [PMC free article] [PubMed] [Google Scholar]
- 7.Fernández RS, Crivelli L, Guimet NM, et al. Psychological distress associated with COVID-19 quarantine: latent profile analysis, outcome prediction and mediation analysis. J Affect Disord 2020;277:75–84. 10.1016/j.jad.2020.07.133 [DOI] [PMC free article] [PubMed] [Google Scholar]
- 8.Khorrami Z, Pourkhosravani M, Rezapour M, et al. Multiple air pollutant exposure and lung cancer in Tehran, Iran. Sci Rep 2021;11:1–11. 10.1038/s41598-021-88643-4 [DOI] [PMC free article] [PubMed] [Google Scholar]
- 9.Ghaedrahmati S, Alian M. Health risk assessment of relationship between air pollutants’ density and population density in Tehran, Iran. Human and Ecological Risk Assessment: An International Journal 2019;25:1853–69. 10.1080/10807039.2018.1475217 [DOI] [Google Scholar]
- 10.Amini H, Taghavi-Shahri SM, Henderson SB, et al. Land use regression models to estimate the annual and seasonal spatial variability of sulfur dioxide and particulate matter in Tehran, Iran. Sci Total Environ 2014;488-489:343–53. 10.1016/j.scitotenv.2014.04.106 [DOI] [PubMed] [Google Scholar]
- 11.Amini H, Taghavi-Shahri S-M, Henderson SB, et al. Annual and seasonal spatial models for nitrogen oxides in Tehran, Iran. Sci Rep 2016;6:1–11. 10.1038/srep32970 [DOI] [PMC free article] [PubMed] [Google Scholar]
- 12.Amini H, Schindler C, Hosseini V, et al. Land use regression models for alkylbenzenes in a middle Eastern megacity: Tehran study of exposure prediction for environmental health research (Tehran SEPEHR). Environ Sci Technol 2017;51:8481–90. 10.1021/acs.est.7b02238 [DOI] [PubMed] [Google Scholar]
- 13.Asadi-Lari M, Vaez-Mahdavi MR, Faghihzadeh S, et al. Response-oriented measuring inequalities in Tehran: second round of UrbanHealth equity assessment and response tool (urban HEART-2), concepts and framework. Med J Islam Repub Iran 2013;27:236. [PMC free article] [PubMed] [Google Scholar]
- 14.Sadeghi R, Zanjari N. The inequality of development in the 22 districts of Tehran Metropolis. Social Welfare Quarterly 2017;17:149–84. [Google Scholar]
- 15.Mindrila DL. A typology of child school behavior: Investigation using latent profile analysis and cluster analysis. Psychol Sch 2016;53:471–87. 10.1002/pits.21917 [DOI] [Google Scholar]
- 16.Nylund KL, Asparouhov T, Muthén BO. Deciding on the number of classes in latent class analysis and growth mixture modeling: A Monte Carlo simulation study. Structural Equation Modeling: A Multidisciplinary Journal 2007;14): :535–69. 10.1080/10705510701575396 [DOI] [Google Scholar]
- 17.Tein J-Y, Coxe S, Cham H. Statistical power to detect the correct number of classes in latent profile analysis. Struct Equ Modeling 2013;20:640–57. 10.1080/10705511.2013.824781 [DOI] [PMC free article] [PubMed] [Google Scholar]
- 18.Pourvakhshoori N, Khankeh HR, Stueck M, et al. The association between air pollution and cancers: controversial evidence of a systematic review. Environ Sci Pollut Res Int 2020;27:38491–500. 10.1007/s11356-020-10377-z [DOI] [PubMed] [Google Scholar]
- 19.Gao Y, Zhang Y, Kamijima M, et al. Quantitative assessments of indoor air pollution and the risk of childhood acute leukemia in Shanghai. Environ Pollut 2014;187:81–9. 10.1016/j.envpol.2013.12.029 [DOI] [PubMed] [Google Scholar]
- 20.Cong X. Air pollution from industrial waste gas emissions is associated with cancer incidences in Shanghai, China. Environ Sci Pollut Res Int 2018;25:13067–78. 10.1007/s11356-018-1538-9 [DOI] [PubMed] [Google Scholar]
- 21.Smith MT. Advances in understanding benzene health effects and susceptibility. Annu Rev Public Health 2010;31:133–48. 10.1146/annurev.publhealth.012809.103646 [DOI] [PMC free article] [PubMed] [Google Scholar]
- 22.Whysner J, Vijayaraj Reddy M, Ross PM, et al. Genotoxicity of benzene and its metabolites. Mutation Research/Reviews in Mutation Research 2004;566:99–130. 10.1016/S1383-5742(03)00053-X [DOI] [PubMed] [Google Scholar]
- 23.Mondrala S, Eastmond DA. Topoisomerase II inhibition by the bioactivated benzene metabolite hydroquinone involves multiple mechanisms. Chem Biol Interact 2010;184:259–68. 10.1016/j.cbi.2009.12.023 [DOI] [PubMed] [Google Scholar]
- 24.Yang J, Zuo X, Bai W, et al. Pten methylation involved in benzene-induced hematotoxicity. Exp Mol Pathol 2014;96:300–6. 10.1016/j.yexmp.2014.03.008 [DOI] [PubMed] [Google Scholar]
- 25.Koehler C, Thielen S, Ginzkey C, et al. Nitrogen dioxide is genotoxic in urban concentrations. Inhal Toxicol 2013;25:341–7. 10.3109/08958378.2013.788104 [DOI] [PubMed] [Google Scholar]
- 26.Kampa M, Castanas E. Human health effects of air pollution. Environ Pollut 2008;151:362–7. 10.1016/j.envpol.2007.06.012 [DOI] [PubMed] [Google Scholar]
- 27.Fiebelkorn S, Meredith C. Estimation of the leukemia risk in human populations exposed to benzene from tobacco smoke using epidemiological data. Risk Anal 2018;38:1490–501. 10.1111/risa.12956 [DOI] [PubMed] [Google Scholar]
- 28.Janitz AE, Campbell JE, Magzamen S, et al. Benzene and childhood acute leukemia in Oklahoma. Environ Res 2017;158:167–73. 10.1016/j.envres.2017.06.015 [DOI] [PMC free article] [PubMed] [Google Scholar]
- 29.Ribeiro AG, Vermeulen R, Cardoso MRA. Residential traffic exposure and lymphohematopoietic malignancies among children in the city of São Paulo, Brazil: an ecological study. Cancer Epidemiol 2021;70:101859. 10.1016/j.canep.2020.101859 [DOI] [PubMed] [Google Scholar]
- 30.Raaschou-Nielsen O, Ketzel M, Harbo Poulsen A, et al. Traffic-Related air pollution and risk for leukaemia of an adult population. Int J Cancer 2016;138:1111–7. 10.1002/ijc.29867 [DOI] [PubMed] [Google Scholar]
- 31.Winters N, Goldberg MS, Hystad P, et al. Exposure to ambient air pollution in Canada and the risk of adult leukemia. Sci Total Environ 2015;526:153–76. 10.1016/j.scitotenv.2015.03.149 [DOI] [PubMed] [Google Scholar]
- 32.Taj T, Poulsen AH, Ketzel M, et al. Exposure to PM2.5 constituents and risk of adult leukemia in Denmark: A population-based case-control study. Environ Res 2021;196:110418. 10.1016/j.envres.2020.110418 [DOI] [PubMed] [Google Scholar]
- 33.Ghosh JKC, Heck JE, Cockburn M, et al. Prenatal exposure to traffic-related air pollution and risk of early childhood cancers. Am J Epidemiol 2013;178:1233–9. 10.1093/aje/kwt129 [DOI] [PMC free article] [PubMed] [Google Scholar]
- 34.Lavigne Éric, Bélair M-A, Do MT, et al. Maternal exposure to ambient air pollution and risk of early childhood cancers: a population-based study in Ontario, Canada. Environ Int 2017;100:139–47. 10.1016/j.envint.2017.01.004 [DOI] [PubMed] [Google Scholar]
- 35.Peckham-Gregory EC, Ton M, Rabin KR, et al. Maternal residential proximity to major Roadways and the risk of childhood acute leukemia: a population-based case-control study in Texas, 1995-2011. Int J Environ Res Public Health 2019;16. 10.3390/ijerph16112029. [Epub ahead of print: 07 06 2019]. [DOI] [PMC free article] [PubMed] [Google Scholar]
Associated Data
This section collects any data citations, data availability statements, or supplementary materials included in this article.
Supplementary Materials
Data Availability Statement
Data are available on reasonable request. This data are not publicly available but can be inquired by formal request in aggregated and/or anonymous form from the Ministry of Health of Iran.