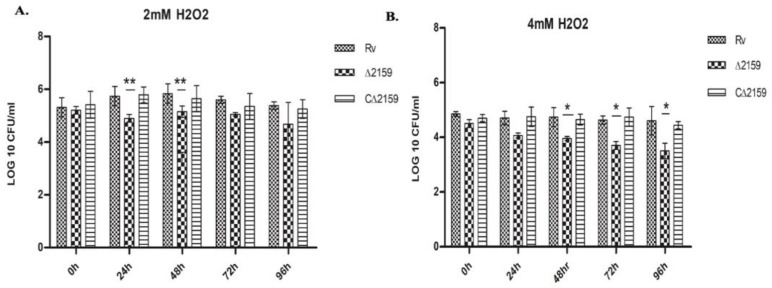
Figure 2.
Effect of oxidative stress on the growth of MtbΔ2159. (A). CFU enumeration of M. tuberculosis strains treated with 2mM H2O2. The graphs representing log10 CFUs of wild type H37Rv, MtbΔ2159 and CΔ2159 strains treated with 2 mM H2O2 displaying sensitivity per/mL of total culture. (B). CFU of M. tuberculosis strains treated with 4 mM H2O2. The bar graphs represent the log10 CFUs of strains treated with 4 mM H2O2, the CFU data are presented per ml of total culture. Two-way ANOVA was using Bonferroni post-test was employed to identify the significance between the strains. Error bars indicate mean ± SD and significant at ** significant at p < 0.01 and * p < 0.1.

