

Abstract

This is a critical review of artificial intelligence/machine learning (AI/ML) methods applied to battery research. It aims at providing a comprehensive, authoritative, and critical, yet easily understandable, review of general interest to the battery community. It addresses the concepts, approaches, tools, outcomes, and challenges of using AI/ML as an accelerator for the design and optimization of the next generation of batteries—a current hot topic. It intends to create both accessibility of these tools to the chemistry and electrochemical energy sciences communities and completeness in terms of the different battery R&D aspects covered.
1. Introduction
The latest reports on climate change from the United Nations show that humanity has a few years’ budget of CO2 emissions at the present rate to keep the temperature rise below 1.5 °C by 2100.1 This remains true despite the temporary slight decrease in global CO2 emissions due to the COVID-19 pandemic.2,3 In order to mitigate this and limit the damages, urgent and massive deployment of emissionless energy sources, such as nuclear and renewable, is required. Renewable energy sources are fluctuating, and hence, their deployment has to be accompanied by efficient energy storage, where rechargeable batteries are at the forefront for short- to medium-term storage, due to operation efficiency and flexibility. Among them, lithium-ion batteries (LIBs) constitute one of the most influential technologies of the modern society, which has enabled the wide emergence of portable electronics devices and which is triggering the growth of the electric vehicle (EV) market.4,5 Even if LIBs have been very significantly improved, by more than 200% in energy density since the first LIB cells were successfully commercialized by Sony in 1991,6 their massive deployment for EV or stationary applications requires them to be even further optimized in terms of performance, durability, safety, cost, as well as reducing their CO2 footprint and increasing their reusability and recyclability. This is true for both current LIBs and any next generation batteries currently being developed or produced.
Several international initiatives have been created to develop novel tools and protocols for reducing the number of experiments in battery research by a factor of 3,7 and, more generally, for boosting the pace of material discovery for energy applications by a factor of ∼10.8 Artificial intelligence (AI), and particularly its fruitful branch known as machine learning (ML), stands out as a promising approach that could lead to a paradigm shift in the way we do battery R&D,9 hopefully enabling us to overcome the major challenges dealing with a vast number of variables and large quantity of data:
Battery R&D is a complex multivariable problem, where very different properties, such as performance, life-cycle analyses, safety, cost, environmental effects, and resource issues, are contained. Furthermore, the overall battery circular economy should eventually be included—from the mining, production, and assembly stage via the long usage phase to the final reuse and recycling processes. The present research workflow, however, relies heavily on a forward trial-and-error approach and is largely materials centered: synthesizing materials, manufacturing electrolytes and electrodes, assembling cells, and finally assessing performance. Even considering only these aspects, there are >10100 possibilities to synthesize active materials and prepare electrolytes,10 almost an infinite number of possibilities for choosing the electrode manufacturing parameters and dozens of possible cell formats, which is far greater than what a human brain can handle. This makes difficult the emergence of inverse design tools enabling the prediction of the battery component properties needed for a given performance target and cell format.
The amount of battery R&D data grows exponentially, following the world data-sphere trend.11 For example, BASF, the second largest chemical producer in the world, recently announced that they produce >70 million battery characterization data points per day,12 and in an academic context, as an example, the French Network on Electrochemical Energy Storage (RS2E) with its 17 academic partners13 generates ca. 1 petabyte of battery data per year. These enormous data sets are currently not accessible to the scientific community as a whole, but actions have been taken toward establishing open and FAIR14 battery databases.15−17 Furthermore, there is already a massive amount of data spread out in scientific publications: almost 30,000 LIB publications already exist, and this number is growing rapidly.18 A researcher reading 200 papers per year will need nearly 150 years to read all of the LIB publications available today.
AI and ML will thus need to assist researchers to efficiently solve the parameters and data challenges of LIBs19 as well as assist the R&D of battery technologies beyond LIBs—such as Na-ion, all-solid-state, and Li–S batteries—and electrochemical capacitors (supercapacitors). For this to become true, several challenges need to be tackled, for instance, defining widely accepted standards in battery R&D combined with systematic data disclosure,20 the identification of the most suited descriptor(s) for a certain ML model, or the determination of the associated error, among others. In addition, different battery technologies bring different challenges and AI- and ML-based approaches can be already helpful in many aspects, as ML-assisted operando imaging techniques aiming to study Li dendrite formation and growth for all-solid-state batteries (ASSBs). Other examples could be the increase in time and length scales of current physics-based simulations or the development of innovative multiscale approaches.21−23
This Review aims at providing a comprehensive, authoritative, and critical, yet easily understandable, review about AI and ML of general interest to the chemistry and electrochemical energy sciences community. It addresses the concepts, approaches, tools, outcomes, and challenges of using them as an accelerator for the design and optimization of batteries. Making the booming and highly dynamic AI-related literature more accessible to the battery community as a whole is critical. To move AI applied to batteries from hype to reality, a strong collaboration between experimentalists, modeling specialists, and AI experts is needed; thus, AI and ML must be properly explained and reviewed in a way suitable for a broad audience. We aim here to create better accessibility of these tools and completeness in terms of the different battery R&D aspects currently covered.
In addition, the multitude of battery R&D fields in which AI and ML are being applied lead to heterogeneity in the terminology used and a lack of clarity on both the direction that AI/ML applied to batteries is undertaking and the main challenges that need to be overcome. Reviews in the field have so far focused either on battery diagnosis of, e.g., LIBs or solely on materials, with few examples at the full battery level.24−29 No review so far has provided an overview of applications across the full range of battery R&D across multiple scales (from materials to cells), as we aim to do here.
The aim of this first section is offering to researchers with no or little knowledge on the topic a simplified but easily understandable idea of how AI (and more specifically ML) works. We hope this can assist them in reading in a critical way modern scientific literature where AI or ML are applied to battery research, as well as easing the collaboration between AI/ML experts and other researchers in the field. Readers interested in more detailed discussions on AI/ML in general can refer to the many excellent books already published on the topic.30−40Subsection 1.1 defines AI and ML, giving a short historical perspective. Then, the importance of data (subsection 1.2) and the differences between supervised and unsupervised (subsection 1.3) ML methods are discussed, together with the importance of their hyperparameters (subsection 1.4). Afterward, we describe in an accessible way the working principles behind the most widely used ML techniques (subsection 1.5) and the programming languages and software available to develop them (subsection 1.6). Finally, the outline of the rest of the Review (next sections) is presented (subsection 1.7).
1.1. What Is AI?
AI is ubiquitous in our modern world, equipping many modern digital devices.41 AI equips Internet search engines like Google to learn from our search habits and suggest the most relevant results to us. It is implemented in social networks, like Facebook or Twitter, and Amazon for personalizing news feeds, recognizing people or objects in photos, offering machine translations, or detecting inappropriate content, among other uses. Online video-on-demand services, like Netflix, use AI to personalize movie offerings, and our cell phones use AI as personal assistants (e.g., Siri, Google Now, and Bixby). Other widely adopted AI applications have capabilities spanning from sorting spam and performing speech recognition to making personalized sales offers in e-commerce, among others. Another widely known example of application is gaming, whose major breakthroughs are the chess-playing computer Deep Blue,42 AlphaGo,43 and Watson.44 AI is also at the heart of the development of modern robotics,45 autonomous driving,46 and smart power grids.47 Chemistry fully follows this trend. Aiming to decrease the cost and increase the quality of their products, chemical industries are investing in AI and digitalization to accelerate their R&D,48 while academics intend to use AI and ML to accelerate research on materials, pharmaceuticals, catalysts, and more.49−52
In spite of this, for the vast majority of its history, AI was not as widely accepted as it is today.53−55 Even if typically associated with the fields of informatics and computer science, the concept of AI also belongs to fields like philosophy and psychology, interrogating on the relationships between human beings and machines. From the beginning of human history, the development of new machines and tools guaranteed the survival of humankind, resulting in a strong relationship between humans and machines since early times. An example of this can be found in the Egyptian society, in which the announcement of the next pharaoh was indicated to the population by the God Amon’s statue, through a mechanically moveable arm.56,57 However, the emergence of the AI concept and the development of computers, both originating from the English mathematician Alan Turing, triggered a revolution in this relationship. For the first time in human history, the question about the capability to develop machines able to reason as humans raised from the ground, as formalized in the philosophical question “Can machines think?” by Alan Turing himself.58 In his publication of 1950, he proposed a test, today known as the Turing test, whose aim is to verify if a human being, who is asked to interact with either a human or a machine through a few questions and without knowing her/his/its identity, is capable of distinguishing machines from humans.59 Despite the limitations of such a test,30 it enabled Turing to speculate about a time in which machines will become smart enough to reproduce human intelligence, giving birth to the era of modern AI.
The idea of Turing rapidly attracted the interest of the scientific community, leading to the Dartmouth AI summer research conference in 1956, widely considered as the founding event of the field and where the term artificial intelligence was first proposed. The aim of this conference was defined by its organizer, John McCarthy, who stated: “Every aspect of learning or any other feature of intelligence can in principle be so precisely described that a machine can be made to simulate it”.60 Considering this as the starting point of the field, it is not surprising that the first attempts to develop AI algorithms aimed to simulate the human brain behavior.61,62
Historically, AI has been defined as making machines think humanly, act humanly, think rationally, or act rationally.30 The Turing test discussed above required the machine to act humanly, for instance. However, clearly the definition of what is acting or thinking humanly/rationally is in constant evolution, and it is not linked to computer science alone. It is rather interconnected to other disciplines such as philosophy, psychology, neurobiology, logic, and mathematics, just to cite a few.30 AI could also be defined as “the science and engineering of making computers behave in ways that, until recently, we thought required human intelligence”.63 However, similarly to the previous case, which behaviors we classify as requiring human intelligence or not are time and society dependent. Some decades ago, it would have been believed by many that playing games or interpreting human behaviors to send personalized feeds would require human intelligence, while today these are tasks that we recognize machines can do.43,64 All the above makes AI a moving target, whose exact definition is not trivial. However, the majority of AI systems in current use have in common the capability of learning from experience. The most widely adopted approach to make machines doing so is through algorithm architectures known as ML,30 which are the ones employed nowadays in battery R&D and will be the main subject of this Review. These algorithms have tremendous capabilities to assess multidimensional data sets (i.e., data sets containing multiple variables), discover patterns in data, and unlock applications that are difficult to exploit by using other approaches.23,27,65−67 This is of high relevance for the fields of battery material discoveries or battery manufacturing optimization, in which a multitude of parameters should be considered simultaneously.68 The discovery capabilities of modern ML algorithms rely on the quantity, quality, and veracity of data. Therefore, the first step for any ML-based approach is to build a suitable and complete enough data set.27 Afterward, the ML model should be trained and, when possible, evaluated. In the most common case (supervised models), this is achieved by using a part of the data set to train the algorithm (training step), whose predictive capability is assessed by comparing values predicted by the model and data that were not used for the training step. This is generally referred to as a test step. If the so-obtained model proves to be trustable along this step, the supervised ML algorithm is ready to be used (Figure 1).
Figure 1.

Overall working principles of a ML approach for supervised/unsupervised and classification/regression methods. For simplicity, here classification is represented as the only application of unsupervised ML, despite other applications, for instance dimensionality reduction, existing.
ML algorithms can be classified as supervised, unsupervised, or semisupervised methods.69,70 Supervised approaches employ data sets that are pretreated to define certain variables as inputs and others as outputs. This prior information is missing for the case of unsupervised ML algorithms, whose goal is to find patterns in the data set. Within supervised ML, it is possible to distinguish between regression and classification, where the latter indicates a ML approach analyzing the data set in terms of classes, while the former analyzes it in terms of continuous values. The classes used for a supervised ML can come from the operator or from an unsupervised ML. Semisupervised approaches are somewhere in between the two and utilize data sets containing both labeled and unlabeled data. Besides the type used, classical ML algorithms rely on data and are rather agnostic to physics, meaning that they could aim, for instance, to determine the relationship between different variables interpolating the training data, rather than offering any physical interpretation of such a relationship. However, physical-informed ML approaches exist, for example, when using ML algorithms to solve or discover partial differential equations,71−73 among others.74−76
1.2. About the Importance of Data and Good Practices
All ML algorithms rely on data, which are vital to develop accurate ML models. As widely known, the amount of data is critical, and it is typically believed that higher amounts of data leads to more accurate ML models. Even though this is generally true, the data quality is not a negligible factor and it should be considered, as well. Data sets containing too little data or containing poor quality data (e.g., data difficult to reproduce or affected by significant errors) can lead to wrong ML predictions, biasing the associated result interpretation. In this context, the first step to develop a reliable ML model is building a data set representative of the problem under analysis. Good experimental practices in terms of both design of experiments77 and experimental procedures78,79 are needed to ensure the reliability of data sets and ML results. Defining effective experimental strategies is even more critical when applying ML-driven methods to rare failure scenarios, as recently highlighted by Finegan et al.80 In terms of variables to be considered, it is a good practice to consider as many variables as possible to have a global perspective on the problem under study. However, to simplify the ML model development for the case of multivariable problems, unsupervised techniques, such as principal component analysis (PCA), can be used. In particular, PCA is able to project the original data onto a low-dimensional subspace identified by convenient axes, also known as principal components, arising from linear combinations of the original variables, ordered by the variance they represent in the data set. Once the principal components accounting for the vast majority of the variance are identified, the ML model can be trained using these instead of the original variables, leading to a dimensionality reduction.81
Similar to experimental measurements, AI algorithms themselves should be subjected to good standards and protocols to ensure that no bias is made during data processing and predictions. For instance, the data set and how the quality of the trained model was evaluated (if this was possible) should be systematically disclosed. The latter is relatively easy for the case of supervised models (the most commonly employed ones in the battery field), but evaluating the quality of unsupervised ones can be rather challenging, as it will be shortly discussed in the next subsection. Taking the case of supervised methods, the model accuracy can be assessed by comparing the outputs predicted by the ML model when considering inputs not used during the training step and the real outputs, which were previously measured. The data set used to carry out this procedure is typically known as a test set. If the results predicted by the ML algorithm are equal, or close enough, to the real outputs, the model can be considered correct and can be used for predictions. A simple way to quantify this is through regression plots, which are obtained by plotting the data in the test set (true results) and the predictions coming from the trained ML model (predicted results). The predictive accuracy of the model can be quantified as the R-square82 of the points obtained when compared to the first bisector (true results = predicted results) of the regression plot. As is intuitive, an R-square ranging from 0 to 1 stands for a predictive accuracy ranging from 0 to 100%. However, the use of only the R-square as a metric to evaluate the predictive accuracy could lead to errors in certain cases. An example of this is when using a ML algorithm to predict the energy of a molecule (section 2) while the energy of the system is shifted for instability (or others) reasons, which could lead to high R-square and high mean-squared error (that, on the contrary, should be minimized). Therefore, other metrics, such as the root-mean-square error or the mean absolute error, can be substituted for or can be associated with the R-square, in order to better verify the predictive accuracy of the model. In addition, it should be stressed here that each model has a limit of validity that should be taken in mind. Indeed, if the model is used to predict results associated with inputs that are significantly different from the ones used for the training and test steps, it is likely that the predictions will not be as accurate as desired. For a more detailed discussion on the importance of good practices in machine learning, the interested readers are referred to ref (83).
1.3. Supervised and Unsupervised Methods
Supervised ML algorithms aim to
identify the relationships between
inputs and outputs building a numerical model based on the data used
during the training process. The algorithm architecture used to develop
such a model varies as a function of the ML method used (as will be
discussed more in detail afterward), but the result of any supervised
ML approach is a numerical model linking some outputs  to certain inputs (
 ). Both inputs and output(s) can be either
continuous values or classes. This distinguishes supervised ML algorithms
as classification (classes) or regression (continuous) methods, as
schematized in the right column of Figure 1.
). Both inputs and output(s) can be either
continuous values or classes. This distinguishes supervised ML algorithms
as classification (classes) or regression (continuous) methods, as
schematized in the right column of Figure 1.
To better understand the philosophy behind this approach, it is useful to compare how ML algorithms learn and how the human brain learns. Typically, humans learn through examples. In other words, the brain collects information from the external environment through the sensory apparatus. It elaborates this information in order to identify patterns, which are stored to use this knowledge when needed. As an example, learning that a wild animal is dangerous allows one to react as fast as possible when such an animal is in your proximity, increasing the chances to escape and survive. Similarly, ML algorithms learn through examples that are given in the form of data. These data are used to numerically identify patterns and develop a numerical model able to describe these patterns. Once that model is obtained, it is possible to use this knowledge to predict new results. However, these predictions can lead to errors from time to time. How often, and then how trustable the model is, depends on the model accuracy, discussed in the previous subsection.
Several regression methods were applied in the LIB literature up to date. The most known and widely adopted approaches are briefly discussed in subsection 1.5, but some of them were excluded for the sake of shortness. This small paragraph aims to offer a short list of the approaches not discussed in detail, allowing the readers to recognize these techniques when cited in the Review and offering references where the interest readers can find more detailed information. As mentioned above, regression-based methods aim to fit the training high-dimensional data (xi) and the output (y) by searching an approximation of the relationship between the two. In that sense, this process can be simplified as searching an appropriate functional form (herein called f), where y ≈ f(x). Several famous techniques are based on this approach, such as multiple linear regression84 (MLR) or multivariate curve resolution alternating least squares85 (MCR-ALS), least absolute shrinkage and selection operator86 (LASSO), and ridge and kernel ridge regression87 (KRR). The differences between these approaches rely on the underlying mathematical approach used to find the best functional to describe the data set provided. Other approaches able to deal with high-dimensional data sets are least-angles regression88 (LAR) and sure independent screening and sparsifying operators89 (SISSO), based on linear and nonlinear regression, respectively. Lastly, other approaches do not fit the complete training data with a certain functional, but they divide the data set into different pieces and fit each of them with a certain functional. An example of this is the multivariate adaptive regression splines90 (MARS) model.
Contrary to supervised ML methods, unsupervised ones use unlabeled data sets. These methods are typically used for: (i) identifying groups of data (also called clustering methods) or (ii) dimensionality reduction to identify the most relevant/impactful variables. In that sense, the difference between unsupervised classification (i.e., clustering) and its supervised counterpart is that the former does not require indicating in the data set what is input and what is output. However, the advantage of using approaches that do not require any previous knowledge about the relationship between data is counterbalanced by the lack of information about the nature of the clusters identified and the difficulty to assess the quality of the trained model. In other words, after the clustering through unsupervised ML, it is up to the human operator to assign each identified cluster its physicochemical meaning, and the quality assessment of the clustering or dimensionality reduction performed largely depends on the specific scope for which unsupervised ML is used and it is not always possible. An example in which quality evaluation is possible is clustering, where the distance between elements of the same cluster (intracluster distance) and the distance between different clusters (intercluster distance) can be used as metrics. If using such a metric, the higher the intercluster distance and the lower the intracluster distance (i.e., the clusters are well-defined and separated), the better the model.
As mentioned in the Introduction of this Review, the amount of human-produced data is growing exponentially. However, the majority of these data are not preprocessed, making unsupervised ML particularly suited for their analysis. An example of this is text mining applied to material discovery, for which unsupervised ML methods can be used to classify texts based on similarities between words and sentences.91,92
1.4. Hyperparameters
The reliability of any ML approach depends not only on the method employed but also on its hyperparameters (HPs), which are controllable by the operator and specific to each ML architecture. HPs are defined as parameters influencing the training process, which ultimately affect the model reliability. Therefore, HPs should be optimized for the specific model developed to avoid both underfitting and overfitting. Underfitting refers to a ML model that it too simplistic for the problem under analysis, such as a model not trained enough, while overfitting refers to a model that is too specific, e.g., describing correctly the training data only and having low predictive capability.30,93 A classic example of HP is the number of layers in a neural network (NN), affecting the error propagation in the NN architecture during the training step. In order to optimize the model’s HPs, optimization techniques as particle swarm optimization94 (PSO), artificial bee colony95 (ABC), and genetic algorithms96 (GAs) can be used. The algorithm architectures behind these approaches differ; however, the basic idea behind them is similar and typically relies on minimizing a cost function (linked to the model error) by changing the HP value. In addition, cross-validation (CV) is a useful procedure to assess the quality of the HPs employed. CV is typically based on the k-folds approach,97 which splits the training data set into k subsets. Afterward, the model is trained k times by using k – 1 subsets and tested on the remaining one, where at each iteration the subsets used for the training and test change in order to consider all of the possible combinations. This approach allows testing deeply the prediction capability of the ML model, minimizing the risk of underfitting or overfitting. Even if based on the same principle, it should be mentioned that other CV approaches have been developed, such as stratified k-fold CV98 or leave-one-out CV.68
1.5. Most Used Machine Learning Methods
In the following, we describe the working principles of the most used ML methods in battery R&D. All of these methods are referred to in the application sections 2, 3, 4, 5, and 6.
1.5.1. Neural Networks
A NN algorithm architecture reproduces in silico the working principles of a human brain.31,99−101 Each neuron contains just a small piece of the global information, which is shared between the different neurons through their interconnections (synapses) and transmitted through electrical pulses. Similarly, the NN algorithm architecture relies on interconnected “neurons,” hereafter referred to as nodes, each of them storing just one small piece of the global information. The nodes are divided into layers, which can be classified as input, output, or hidden layers. The number of nodes in the input layer is equal to the number of model inputs, while the output layer consists of one node for each output. The hidden layer(s) are composed by n nodes. The number of hidden layers and the number of nodes for each layer are HPs that have to be optimized for the case under study.
The training procedure of a generic NN algorithm (Figure 2a) can be described as follows. The value of each node (except for the input ones) is defined as the sum of the value of each node belonging to the previous layer multiplied by a coefficient, which is specific to each node and is adjusted during the training. Each node has a value associated to it that depends on the sum of the value of each node belonging to the previous layer(s) multiplied by a coefficient (except for the input ones). This coefficient is specific to each node and is adjusted throughout the training. This value is then used as argument of the activation function (one HP of the model), which outputs the final value associated to this specific node. This operation is accomplished for all the nodes, going from the input to the output ones. Once the output node values are calculated by the NN, they are compared to the output values in the training data set. Following a back-propagation process, the difference between the predicted and real results is used to modify the coefficient matrix, i.e., the coefficient associated to each node. This process is performed n times (where n is a HP) in order to find the optimal coefficient matrix that numerically describes the relationships between inputs and outputs. The values of the coefficients at the beginning of the training process are chosen randomly, while the values associated with the input nodes are the values associated with the inputs in the training data set.
Figure 2.

Workflows of some of the most common ML techniques: (a) neural network; (b) decision tree; (c) support vector machine; (d) k-nearest neighbors (k-NN).
In the following, we discuss briefly the most used NN architectures in the battery field. However, it should be stressed that different definitions with respect to the ones discussed here can be found in the literature, as the nomenclature of different NN techniques is not well standardized among the ML community. The simplest NN model is known as the perceptron NN, containing several inputs and only one output and without any hidden layer. If only one or more hidden layer(s) is (are) used, the method is generally referred to as artificial neural network (ANN) or multi-layer perceptron (MLP) and deep neural network (DNN), respectively. The difference between MLP and DNN is that MLP use only “classical” nodes in its hidden layers (the ones discussed above), while DNN is more generic and can encompass more complex mechanisms, for instance convolutional layers, which are discussed below. In addition, all the nodes can be connected (i.e., they share information with other nodes) or not. The procedure used to “disconnect” (typically randomly) certain nodes is generally referred to as dropout.
A special class of NNs, of particular interest for image analysis, is the convolutional neural network (CNN). The main difference between CNN and other NNs is the use of convolutional layers (CLs) together with classical hidden layers. CLs are able to recognize specific patterns in images, which makes them particularly suited for tasks as object recognition. The pattern identification is performed through filters embedded in the nodes of the CLs. These filters are constituted of matrixes of dimension n × m, and, instead of analyzing the image pixel by pixel, the CLs analyze blocks of n × m pixels. Thanks to these characteristics, if the filter is well developed and trained, it can be used to recognize automatically specific patterns in images, enabling, for instance, distinguishing between different phases (as active material, carbon-binder domain, and pores) in electrode tomography images, automatizing and easing the segmentation procedure. An alternative to classical CNN is the Bayesian convolutional neural network102 (BCNN), which offers information about the error on the predicted output. Another NN method of interest is known as wavelet neural network103 (WNN), whose main characteristic is that its inputs are curves and not multivariate data.
Even more complex NN architectures can be developed. For instance, recurrent neural network104 (RNN) and long–short-term memory105 (LSTM) were conceived to “remember” information during the training step. The first difference between these two approaches and the ones discussed above is that the inputs can be linked, meaning that they are not independent, as in Figure 2a. An example could be the use of RNN for reproducing texts, in which one word and the following one are linked. Concerning LSTM, this technique is more suited to time-dependent data, which can be of interest for operando applications. Lastly, another approach of interest is the extreme learning machine (ELM), which is a NN using a single hidden layer with better generalization performance than the classical back-propagation NN.106
1.5.2. Decision Tree, Random Forest, Boosting, and Bagging Approaches
The basic idea of a decision tree (DT) is to divide a complex problem into n smaller ones through a treelike structure. In this representation, each node of the tree represents one small subproblem, while the tree as a whole constitutes the solution to the overall problem.36 At the beginning of the training process, the data contained in the data set is injected in the root, i.e., the first node in the upper part of the DT (top of Figure 2b). Afterward, the algorithm searches for the input that best discriminates between the outputs. In other words, it searches which value (ci) of which variables splits the initial data set in such a way to separate as many outputs as possible, minimizing the associated error in the meantime. This leads to the bifurcation of the node (and of the data set) into two “paths”, one for values of the selected inputs lower than ci and the second one for values higher than ci. Iterating this procedure leads to a series of paths linking each possible input to a certain output, resulting in the tree shape reported in Figure 2b. One of the main advantages of this approach is that it produces a self-speaking and easy-to-understand representation of the links between inputs and output (X and Y in Figure 2b). However, this approach is often too simplistic to allow reaching high prediction accuracy. For this reason, the random forest (RF) method was developed to combine the simplicity of DT with an improved predictive capability. The idea behind RF is that, if a single DT is not enough to obtain stable/accurate results, the results obtained averaging the outputs of a multitude of DTs can lead to more trustable predictions. This results in a significant increase of the prediction accuracy, which makes RF-suited to solve complex problems.70,99,107
Boosting and bagging approaches are based on the same idea as RF, i.e., using several DTs to reduce the bias and the variance of the model while improving its predictive accuracy. The main difference between RF and boosting/bagging is the sampling method used,108 while the bagging and boosting approaches are differentiated by the procedure adopted for the training step.
1.5.3. Support Vector Machine
Support vector machine (SVM) aims at finding the best hyperplane(s) (i.e., multidimensional plane) to separate the inputs as a function of their associated output(s).70 In other words, SVM identifies which hyperplanes better separate the hyperspace of inputs and outputs in n zones (where n depends on the number of initial classes), while minimizing the associated model error and maximizing the probability that each zone is well separated from the others (Figure 2c). The degree of separation of these zones can be modulated by some HPs of the SVM method, typically referred to as cost, gamma, and the kernel used.98 During the last decades, different methods based on SVMs were developed, as for example the multikernels support vector machine109 (MSVM), which does not use one single kernel but a linear combination of kernels. Other examples could be the support vector regression110 (SVR), applied for quantitative supervised learning, and least squares support vector machines111 (LSSVMs) or relevance vector machines112 (RVMs), that were specifically developed to solve linear equations and to use Gaussian kernels, respectively.
1.5.4. k-Nearest Neighbors
k-Nearest neighbors (kNN) is a well-known ML method applied for both regression and classification, relying on variable similarity in the data set.70 This is quantified by calculating the distances between the raw data points in the multidimensional feature space, i.e., the space defined by each input feature. Data that are close enough in the feature space are grouped together, which allows identifying clusters of data. Once the different groups are defined through the training data set, this method allows predicting the class or the output associated with new inputs by comparing them to the “k” nearest neighbors in the multidimensional feature space. As an example, for the case of a classification algorithm that uses a k value of 3, the three nearest neighbors will be considered, and if at least two out of three nearest neighbors belong to a certain class, the new input is classified accordingly (Figure 2d). The optimal value of k is typically identified by maximizing and minimizing the intergroup and intragroup variance, respectively, aiming to obtain well separated clusters.
1.5.5. Probabilistic-Based Approaches
The most known and most used probabilistic models
are the ones based
on Bayesian approaches. These approaches use the a priori probability on the distribution of the training data (in a certain
sense, the error associated with the data) to calculate the a posteriori probability (related to the error of the output)
to enhance the output prediction and offer information on its associated
variance. Therefore, Bayesian models offer an estimation of the error
associated to the predicted outputs, which is rare in the ML field
and extremely valuable for assessing the limit of validity of the
ML model. The theoretical baseline of this approach relies on the
Bayes theorem, which links the a priori and a posteriori probability. The simplest approach is generally
referred to as naive Bayes113 (NB), which
simplifies the calculation of the a posteriori probabilities
by considering that the a priori probabilities of
the inputs are independent. A more complex approach is known as Bayesian
Monte Carlo114 (BMC), in which no approximations
are done. In this case, the resolution of the integrals arising from
the lack of any approximation is simplified through a Monte Carlo
approach. Another important approach is the Gaussian process115 (GP), typically applied to regression. The
working principle of this approach is similar to the Bayesian one,
but it approximates as Gaussian the a priori probability
distribution. An example of predicted function is plotted for six
observations (red points) in Figure 3. The predicted function does not only aim to fit the
data (observations); it also offers a measure of the error (light
gray zone) associated to the predicted function. The prior information
about the GP is usually specified in terms of a kernel function k(x1, x2), which gives the covariance between two data points (x1 and x2). Generally
speaking, kernel approaches refer to a feature transformation of the
initial data in a specific feature space. They allow dot products
of vectors and are often called generalized dot products. In simplified
words, kernel functions are mathematical functions applied to vectors
(as the training data), which are used for data processing. For the
sake of offering a practical example to the readers, a useful example
is the case of an exponential kernel. This uses two vectors (x1 and x2) and outputs
a numerical value that is equal to  (i.e., k(x1, x2) =
  ), where e is
Euler’s
number and σ is linked to the variance of the input data (training
data set). Several other kernel types exist, which could lead to more
complex mathematical transformations, but the overall idea is the
one exemplified above. In terms of the most used kernels, the squared
exponential (SE) kernel is a popular choice for vectorial inputs,
while, for molecular data (section 2), the smooth overlap of atomic positions (SOAP) kernel116 is widely employed, among many other possible
alternatives.117
), where e is
Euler’s
number and σ is linked to the variance of the input data (training
data set). Several other kernel types exist, which could lead to more
complex mathematical transformations, but the overall idea is the
one exemplified above. In terms of the most used kernels, the squared
exponential (SE) kernel is a popular choice for vectorial inputs,
while, for molecular data (section 2), the smooth overlap of atomic positions (SOAP) kernel116 is widely employed, among many other possible
alternatives.117
Figure 3.

Example of GP regression. The standard deviation refers to the error associated with the predictions.
Another probabilistic-based approach of interest is known as Bayesian optimization118 (BO), which does not only output a certain function and the associated probability distribution after the training process, but it also aims to identify the “optimal values” of that function, making it particularly suited for optimization purposes.
Lastly, other methods using probabilistic theory are discriminant analysis—such as linear discriminant analysis (LDA), quadratic discriminant analysis (QDA), partial least squares discriminant analysis (PLS-DA), or shrinkage discriminant analysis (SDA)119—and logistic regression120 (LR).
1.5.6. Generative Models and Inverse Design
Generative models are a class of unsupervised ML algorithms that can be used to generate data similar to the ones used for the training. As an example, given a data set of electrode material crystal structures, the trained generative model can be queried to generate more examples that look like the materials in the data set. Similarly, it is possible to use electrode mesostructures121−123 or, in principle, any other battery-related information, instead of crystal structures. This is a useful alternative to high-throughput screening where it can be inefficient, or even impossible, to consider all the possible material candidates even when using cheap surrogate (i.e., simplified) physical models. Traditionally, hand-coded rules or genetic algorithms have been used to generate new material crystals or nanoparticles,124 but in recent years there has been a shift toward deep learning models, particularly variational autoencoders (VAEs),125,126 adversarial autoencoders (AAEs), generative adversarial networks (GANs),121−123,127,128 and reinforcement learning (RL), shown schematically in Figure 4. In a VAE, one tries to learn an encoder and a decoder, which are both DNN models that map, for example, battery active material crystals into a (latent) vector space and from this space back into the original space, respectively. To generate new material crystals, it is possible to sample new points from the latent space and map them back to the input representation. In a GAN, the generator network gets a sample and is asked to generate a “fake” one that looks real. Another network (the discriminator) is trained to distinguish between real and fakes, forcing the generator to make more and more realistic its “fake” samples. In the context of batteries, the samples can be, upon others, electrode microstructures or crystal structures, as will be presented in sections 2 and 4. The AAE combines the idea of VAE and GAN and uses a discriminator to inform whether the encoded sample comes from the prior distribution or from the encoder. Finally, in a RL setting, a sample is thought as being produced by a number of steps taken by an agent. After the creation of the material crystal, the agent is provided with a reward or penalty based on the properties of the generated sample.
Figure 4.

Deep learning architectures for generative modeling.
The generative architectures described above are often used for inverse design purposes (Figure 5), where the goal is to identify the conditions, such as the material to use or manufacturing/cycling protocol to implement, needed to obtain a desired property.129,130 In RL, one can directly incorporate the desired property in the reward signal given to the generating agent, while VAEs, GANs, and AAEs link the latent space to the sample of interest (crystal structure, microstructures, etc.). Then, it is possible to map the latent space searching for a desired optimum. Some of the most popular search methods for this application are gradient descent and Bayesian optimization. It is also possible to train a generator to be directly conditioned on a property.
Figure 5.

Inverse design with deep learning models.
1.6. Programming Languages and Platforms
All of the ML examples discussed above need to be built by using a programming language. In this subsection, the most used programming languages are discussed together with their advantages and disadvantages in terms of developing a ML algorithm.
Python: Widely used open-source language, particularly appreciated by the AI/ML community due to several dedicated easy-to-implement libraries. Created in 1989 in reference to the famous Monty Python’s Flying Circus British TV show,131 this programming language offers many tools to easily manipulate big data sets, displaying results, etc. In addition to these basic features, several Python libraries are specifically devoted to ML algorithms, as Scikit-Learn, Tensorflow, or Keras, just to mention a few. Another advantage of Python is its popularity, thanks to which many dedicated forums and Web sites on the topic are already available.500−502 Generally, Python algorithms are executed under cross-platforms called integrated development environments (IDEs), such as Spyder, Pycharm, and Jupyter Notebook. The last one is attracting increasing attention due to its friendly interface and the possibility of interacting with several other programming languages.
R: Developed during the last decade of the 20th century, R is particularly popular in statistics science. Compared to Python, R is less used to build ML algorithms. However, it offers fully dedicated statistical libraries such as MASS, stats, fdata, car, or glmnet. In addition, the Comprehensive R Archive Network132 (CRAN) reports all the details needed to help users understand how to utilize each specific library/package.
C++ and FORTRAN: Considered as the modern pioneers of programming languages, they are widely used as high-performance languages. The implementation of ML codes by using C++ and FORTRAN is typically more difficult compared to R or Python, and it requires taking care of the memory management (contrary to Python, which is already optimized for it). Nevertheless, famous C++ libraries for ML, such as SHARK or MLPACK, exist.
In terms of computational resources, they are becoming more affordable thanks to platforms created by computer giants like Google Cloud ML Engine,133Microsoft Azure Machine Learning,134 and IBM Watson Machine Learning,135 which allow launching in cloud ML algorithms requiring extensive training. In addition, those platforms offer “ready to use” codes that can be particularly useful for nonexpert users or companies.
1.7. Outline/Scope
The first section presented the concepts of AI and ML, briefly introduced some key points of their history, and discussed in an accessible manner the most used ML techniques in the battery field. Numerous applications in battery research exist, which are discussed in detail in the following sections, covering the following aspects: materials design and synthesis (section 2), electrode and cell manufacturing (section 3), electrode architecture and materials characterization (section 4), battery cell diagnosis and prognosis (section 5), and surrogate modeling, recycling, second-life, and text mining (section 6). Each of these sections can be read on its own or in combination with the others, allowing modulation of the reading as a function of the readers' interests. In addition, Figure 6 shows that the battery community did not grant the same attention to each of them, with prognosis/diagnosis (∼40%) and materials design and synthesis (∼27%) being the most studied ones, followed by material and electrode characterization (∼17%) and manufacturing (∼6%), while the rest (∼10%) is accounted for by other applications. Lastly, section 7 presents the overall conclusions and indicates challenges and opportunities for further application of AI/ML in the battery field.
Figure 6.

Percentage of reviewed articles applying AI or ML to the different battery-related topics discussed in this Review. This analysis was performed on ∼200 scientific articles.
2. Application to Materials Design and Synthesis
In this section, we review current advances on the intersection between AI techniques (mainly from the subdomain of ML) and the design and synthesis of battery materials. We first provide in subsection 2.1 a brief overview on recent efforts to develop appropriate materials descriptors, which are often the first difficulty toward implementing meaningful and accurate ML models. Then, we present a variety of examples where ML-based studies are contributing to accelerate the screening and prediction of new battery materials with specific targeted properties. The examples are classified in three main groups: (i) active electrode materials, (ii) solid electrolytes, and (iii) liquid electrolytes. In subsection 2.2, we discuss how ML algorithms are also creating new opportunities for materials simulations, by helping to tackle increasingly complex chemistries, larger length and time scales, and multiscale modeling. In ssubection 2.3, we move to the synthesis of new materials and, in particular, how AI can be applied to effectively plan experiments and mitigate the combinatorial explosion problem associated with the exhaustive rendering of chemical and physical spaces in typical high-throughput (HT) approaches. In this context, we show how ML algorithms are applied to identify relations between variables and to speculate about the outcome of new experiments. Finally, in subsection 2.4, we provide perspectives and identify key future challenges on the use of AI/ML for materials design and synthesis.
2.1. Materials Discovery
Informatics-aided materials discovery and optimization is becoming a powerful tool to analyze experimental and theoretical data and extract key structure–property relationships of functional materials, in general, and battery materials, in particular (recent review articles on the topic include refs (129, 136−145)). Current approaches in this direction typically combine HT screening and ML, aiming to find new active electrode and electrolyte materials for next generation batteries. Common ML methods include DTs, BO, SVM, and ANNs, among others (Figure 7); for a brief and accessible description of the applicability of these methods within the wider domain of materials science, the interested reader can consult refs (136, 137, 146, and 147).
Figure 7.

Infographic on the ML methods recently used in the literature to search for new battery materials with specific target properties, including the corresponding nature (calculated vs experimental data) of the employed databases.
Based on the utilization of high-fidelity data from physical-based simulations, experiments, or both, ML methods are used to find complex nonlinear relationships among a relatively large number of variables. This ultimately helps classify materials with similar characteristics or predict target properties in new materials.
In the case of active electrode materials, typical properties of interest are discharge capacity, capacity retention, volume change, Coulombic efficiency, voltage profile, or redox potential. In the case of electrolytes, current efforts are focused on the search of inorganic solid-state ion conductors with high ionic conductivities and good mechanical properties. A table is provided in the Supporting Information (Table S1) which summarizes recent works in the literature for different materials, data sources, target properties, and employed ML methods. This provides a quick overview of the current research efforts in the area that will be described in detail in the following.
Access to sufficient reliable training data is the first obvious bottleneck for implementing any ML model. Not only does the size of the data set significantly impact the accuracy, but the quality of the data is also paramount. In particular, it is crucial to have properly sanitized data that does not introduce errors in the training process which could prevent a correct fitting of the data or that may later affect the performance of the model. No matter the source of the data, curation is therefore crucial and sine qua non condition for creating an as objective as possible correct database.148,149 High-quality data implies that the real world target property needs to be accurately reproduced by the corresponding experiment or simulation (high fidelity). However, high-fidelity data is often scarce because it is costly to obtain. Moreover, in contrast with scientists’ tendency to report in the literature only the best performing materials, there is also a general need for including poorly performing materials or failed experiments in databases in order to enrich the training sets.
Another key element in ML methods applied to materials science is the underlying mathematical description of different compounds, which needs to be sufficiently rigorous to enable the comparison of different structures and chemistries across large data sets. A critical challenge to apply ML models to a materials science problem is precisely the selection of appropriate descriptors that lead to sufficiently accurate predictions of the intended target property.150 In fact, poor descriptors unrelated to target properties often lower the prediction accuracy of a given ML model. Proposals of materials descriptors are abound in the literature (see, for example, Figure 8): histogram descriptors,151 fingerprints,152 Coulomb matrix,153 atom–atom radial distribution functions,154 and substructure fragmenting based on Voronoi-cell local partitioning,155 among others. However, complete atomic representations of broad chemical spaces are currently a work in progress and finding universal representations that work for all properties remains elusive.126
Figure 8.

Eight different material descriptors to represent a 9,10-antraquinone-2,7-disulfonic acid (AQDS) molecule used in organic redox flow batteries.126 Figure reproduced with permission from ref (126). Copyright 2018 American Association for the Advancement of Science.
It is also germane to point out that AI-aided materials discovery is a rapidly growing field, with several potential research directions ahead. One of those is inverse design to accelerate the discovery of ultrahigh-performance batteries. The so-called Battery Interface Genome (BIG) and the Materials Acceleration Platform (MAP) are promising initiatives in this quest.129 By combining data from multiple experimental techniques and simulation methods, BIG-MAP aims at deploying deep generative models126 capable of generating new data with the target property and, specifically, enable inverse design of high-performance interphases in batteries.
2.1.1. Active Electrode Materials
Min et al. considered an experimental data set and ML-aided analysis to establish optimal synthesis parameters and fulfill target specifications for Ni-rich NMC cathode materials (Figure 9).156 Input variables included, among others, calcination temperatures, Ni content, primary particle size, coating materials, and washing conditions, whereas output variables were initial capacity, cycle life, and amount of residual Li after synthesis. The authors assessed the performance of a range of different ML models (SVM, DT, RF, ridge regression (RR), ERT, and ANN), concluding that extremely randomized tree (ERT) yielded the smallest errors for predicting all of the output variables. In addition, the authors proposed optimal experimental parameters by conducting inverse design, which they successfully validated with additional experiments. In a more recent study, Kireeva and Pervov also considered experimental data sets to identify synthesis and electrochemical property relationships in Li-rich layered oxide cathodes using a SVM model.157 In this case, input variables included composition, synthesis method, Li and transition metal sources, Li excess, temperature, and time of calcination and sintering; whereas initial discharge capacity and Coulombic efficiency were set as output variables. ML analysis allowed for identifying key parameters affecting tailored characteristics such as some processing conditions, Li excess, or the ratio between Li and transition metals.
Figure 9.

Schematic representation of the procedure followed by Min et al. to establish optimal synthesis parameters for Ni-rich NMC cathode materials.156 Figure adapted with permission from ref (156). Copyright 2018 Springer.
Using density-functional-theory (DFT)-calculated lattice constants for fully lithiated and delithiated structures and aiming at designing low-strain cathode materials, Wang et al. built a partial least squares (PLS) model for predicting the percentage of volume change of spinel- and layered-type oxides.158 They found that the most important descriptors to predict accurate volume changes were the radius of transition metal ions and transition metal octahedron distortion. Using DFT-calculated voltages reported in the Materials Project (MP) database, Joshi et al. targeted the prediction of voltage profiles of a broad range of active electrode materials for Li-, Mg-, Ca-, Al-, Zn-, and Y-ion batteries (Figure 10).159 In this case, the considered materials descriptors included the nature and concentration of the intercalation cation, the crystal lattice type, and space group numbers as well as other elemental properties of the atomic constituents in each particular compound. The study helped identify potential new electrode materials for Na- and K-ion batteries when considering known Li-based active electrode materials that were not yet proposed for other chemistries.
Figure 10.

Schematic representation of the working procedure followed by Joshi et al.159 and some examples of results. Figure adapted with permission from ref (159). Copyright 2019 American Chemical Society.
In the search of organic electrode materials, Allam et al. constructed a DFT-based database for a selected set of different organic molecules.160 The authors considered both computed electronic properties and optimized geometrical information as input variables for a ANN-based prediction of redox potentials. Using linear correlation analysis based on calculating Pearson correlation coefficients (capturing how linear is the correlation between two variables), 10 main input variables were identified: electron affinity, highest occupied molecular orbital (HOMO), lowest unoccupied molecular orbital (LUMO), HOMO–LUMO gap, and the number of H, C, B, O, and Li atoms and aromatic rings in the molecule. The approach showed a good capability for predicting accurate redox potentials with respect to DFT-computed values when considering molecules not included in the training set.
ML can also be used to classify data sets into specified classes (supervised learning). In this context, Attarian Shandiz et al. considered several algorithms (LDA, QDA, SDA, ANN, SVM, kNN, RF, and ERT) and data from the Materials Project to predict the type of crystal system (monoclinic, orthorhombic, and triclinic) of Li-ion silicate-based cathodes containing Mn, Fe, and Co.161 It was found that RF and ERT classifiers yielded the lowest overall errors and that the crystal volume, number of sites, formation energy, energy above hull, and band gap were the most relevant descriptors.
2.1.2. Solid Electrolytes
The application of ML models to screen battery materials is particularly active in the domain of solid electrolytes. One of the first studies, in 2012, combined computed data with PLS analysis to propose novel olivine-type oxide solid electrolytes with low ionic conductivity.162 Specifically, the authors used the nudged elastic band (NEB) method to compute with DFT Li+ migration energies for a range of ordered LiMXO4 structures within the main group M2+–X5+ and M3+–X4+ pairs. By predicting the existence of materials with Li+ migration energies lower than 0.3 eV, several promising new compositions were proposed, as for example Mg–As, Sc–Ge, In–Ge, and Mg–P as well as Al–X, Ga–X, In–X, and Ca–X pairs, in general. Using instead an ANN model, Jalem et al. also investigated tavorite-type LiMTO4F (with M3+–T5+ and M2+–T6+ pairs) solid electrolytes.163 Predicted compositions with low migration energies included, for example, LiMgSeO4F, LiMgSO4F, or LiGaPO4F. Follow-up studies have shown that BO-based models are a very effective search algorithm to screen fast ion conductors (Figure 11), including Li- and Na-containing tavorite-type compounds164 as well as other Li- and Zn-containing oxides.150 Moreover, in this last study, the authors applied bond-valence-force-field (BVFF)-based calculations instead of DFT to generate the computed database; as compared with DFT, BVFF-based calculations are much less computationally expensive, which facilitates the massive screening of large data sets.165
Figure 11.

Schematic workflow of a BO-based model to search for DFT-computed Li- and Na-ion migration energies (Eb) in tavorite AMXO4Z compounds.164 Figure reproduced with permission from ref (164). Copyright 2018 Springer.
Alternatively, Kireeva and Pervov considered a diverse set of experimental data of garnet-type oxide solid electrolytes, including total Li-ion conductivities and associated activation energies, synthesis parameters, pellet densities, among others.166 Using a SVM model, the authors targeted the prediction of the ionic conductivity of compounds with general formula A3B2(XO4)3. By combining theoretical and experimental data sets, Fujimura et al. directly assessed the ionic conductivity of Li8–cAaBbO4 LISICONs using the SVM method.167 The authors identified several compositions with higher ionic conductivities than known to date LISICONs. In this case, the theoretical data was also obtained at the DFT level, including formation energies and diffusion coefficients extracted from molecular dynamics (MD) simulations, whereas the experimental data involved ionic conductivity measurements at different temperatures. Considering instead an unsupervised learning approach, Zhang et al.168 employed agglomerative hierarchical clustering to group materials in the ICSD with similar experimental X-ray data representations of anion structures and successfully trained the model to cluster compounds into groups of high and low Li-ion conductivity. In another example, combining theoretical data from the Materials Project database with experimental data reported in the literature, Sendek et al. used a classification LR analysis to distinguish between superionic and non-superionic Li-containing solid electrolytes.169 Special attention was paid to assess the predictive power offered by a range of simple atomistic descriptors and combinations of them, concluding that only multidescriptor schemes achieved good enough predictive accuracy. In addition, a follow-up data-driven analysis170 revealed nontrivial correlations between different performance metrics and properties (ionic conductivity, electrochemical stability window, band gap, oxidation potential, reduction potential, materials cost, and anion electronegativity) in a diverse range of solid electrolytes, which highlights the need to tackle the complex problem of battery materials design from different perspectives to successfully identify high-performance outliers.
All of the previously discussed studies focus on ion mobility (migration energies or conductivities) as a target property. However, this is not the only important facet of applicable solid electrolytes; suppressing dendrite growth is an additional requirement that needs to be considered. In this regard, Ahmad et al. conducted a DFT-based computational screening of thousands of inorganic solids assessing their potential ability to suppress dendrite initiation in contact with Li metal.171 To this end, the authors trained the crystal graph convolutional neural network (CGCNN) and KRR models on calculated shear and bulk moduli as well as elastic constants. They found that promising candidates capable of suppressing dendrite growth are generally soft and highly anisotropic, with large mass density, ratio of Li, and sublattice bond ionicity.
2.1.3. Liquid Electrolytes
Liquid electrolytes are, unlike solid electrolytes, highly disordered, making ML studies of energies and electronic and structural properties less straightforward. Hence, there are significantly fewer papers using ML methods on liquid electrolytes. Nevertheless, ML methods can be useful for a variety of purposes also for liquid electrolytes, and in the following, we highlight a few cases. Nakayama et al.172 considered a range of commercially available organic solvent molecules and applied the exhaustive search with a GP (ES-GP) method to predict the cation–solvent interaction energies within liquid electrolytes for LIBs. The interaction energy is a convenient proxy for the Li-ion transport in the electrolytes, as solvation and desolvation of Li-ions at the electrolyte–electrode interfaces are key processes often limiting the overall mass transport. Additionally, Sodeyama et al., using an exhaustive search with linear regression (ES-LiR) model, included the melting point as a target property, which is an important parameter in terms of a wide LIB operating temperature window.173 While the ES-LiR model provided a good balance between prediction accuracy and computational cost as compared to the multiple linear regression (MLR) and least absolute shrinkage and selection operator (LASSO) approaches,173 the ES-GP method is significantly more accurate than ES-LiR.172
A less direct approach is to use ML methods to accelerate the search of the sampling space, for example, ML-enhanced MD simulations to allow simulation of more extreme types of liquid electrolytes. One particular use is when dipole polarization plays a major role for the dynamics, for example, highly concentrated electrolytes (HCE) and ionic-liquid (IL)-based electrolytes. The most direct approach implemented is to learn the polarization term in a cost efficient way by NNs, e.g., refs (174 and 175), but also the surrounding neighborhood can be used to give an atom wise description of the system in order to evaluate the forces acting on a particle (as, for instance, a molecule) using Deep Tensor NN.176,177 This provides an efficient way to generate data, with the caveat that information on the physical interactions is lost. Similar approaches have been used to study electrolytes of Zn2+ in water showing that it is possible to apply ANN to learn an effective physical potential even for highly disordered systems.178 However, it is yet to be proven how this method performs when the system complexity is increased by including both anions and cations, as well as solvent(s). Preliminary results from the Johansson group (Chalmers University of Technology, Sweden) working together with the MIT group176,177,179 indicate that the method works well. They have trained the network on a HCE of LiTFSI in ACN. The network data presented in Figure 12 show a small mean average error (MAE) of 1.2 kcal mol–1 Å–1, which is small, but a larger training data set is needed to comfort the results before publication.
Figure 12.

Preliminary results of an ANN trained on HCE LiTFSI in ACN by Johansson’s and MIT groups.176,177,179
Even if too often forgotten, ML can be applied to electrolyte studies not only from the computational point of view but also from the experimental one. There are several ways ML can be used to aid or enhance experimental studies of electrolytes, ranging from ANN to be applied to interpreting spectroscopy data to (ideas of) fully automated laboratories.180−182 This approach indeed opens up for more efficient experimental studies of liquid electrolytes as well as a solution to many of the problems with simulating complex electrolytes and comparisons with experimental data.
2.2. Accelerated Multiscale Modeling of Materials
From a physical-based modeling viewpoint, first-principles methods from quantum mechanics (e.g., DFT) are the most accurate simulation approaches. These methods are very useful to elucidate specific molecular-scale mechanisms, which we could only speculate on when addressed through experimental techniques. However, the application regime of these methods is nowadays limited to systems consisting of a small number of atoms, mainly due to high computational cost associated with first-principles calculations. First-principles methods are essentially limited in terms of accounting for the length and time scales of relevant phenomena affecting cell performance (e.g., space charge layer formation, interfacial ion transport, degradation reactions, defects formation, etc.). Steady advances in computational power will help to partially mitigate this issue in the future, and simulating larger length and time scales than possible today will eventually be affordable.141 This should enable the consideration of more realistic materials models, ultimately capable of accounting for the underlying chemical and physical mechanisms that often operate at multiple scales simultaneously in battery materials and associated phenomena such as interphase formation and evolution (Figure 13) or ionic transport in composite electrodes.
Figure 13.

Complexity of a typical battery solid electrolyte interphase (SEI) increases continuously, from the molecular level to the macroscale. Assessing the state of the interphase requires therefore the combination of a range of simulation (blue), electrochemical (orange), and characterization (green) approaches.129 Figure reproduced with permission from ref (129). Copyright 2019 Elsevier.
However, accurate first-principles methods will probably be still too computationally costly to be routinely and timely applied and a much less computationally intensive alternative, the so-called interatomic potentials, which are sets of parametrized functions, are available. Interatomic potentials depend on several parameters that need to be fitted empirically to available experimental or high-level quantum mechanical calculations. However, two main limitations of interatomic potentials are their low transferability and nonreactivity. Essentially, this means that a given interatomic potential set is only valid and accurate for the specific model system for which it was fitted. Extending the use of existing interatomic potentials to other systems of interest (even of the same chemical composition) should always require thorough validation and re-parametrization, which is not always possible because of a lack of available experimental or accurate theoretical data. In addition, depending on the functional form used in the interatomic potentials, including chemical reactions may not always be feasible.
The implementation of ML techniques in materials science workflows50 can certainly help accelerate current computational efforts. In particular, ML-assisted approaches could help improve the representation of the local chemical environment used in many-body interatomic potentials.129 In this context, Deringer and Csányi proposed a Gaussian approximation potential (GAP) model to construct interatomic potentials from a ML representation of DFT potential energy surfaces.183 They applied the method to MD simulations of liquid and amorphous carbon materials, including the study of high-temperature surface reconstructions. With an overall performance somehow between DFT and state-of-the-art interatomic potentials, the proposed GAP model showed therefore promising capabilities for large-scale atomistic simulations of amorphous simple materials. Engaged in similar efforts, Li et al. trained an ANN potential using tens of thousands of DFT-computed Li3PO4 structures.184 The resulting ANN potential yielded accurate predictions of Li vacancy formation energies, Li+ migration energies, and diffusion coefficients of crystalline and large-scale amorphous Li3PO4, with predicted activation energies in very good agreement with experimental measurements. In spite of the success of these two studies, it is important to remark that long-ranged electrostatics in ionic systems still remain a challenge for interatomic potentials machine-learned from local structural descriptors. During a recent effort to solve this issue, Deng et al. introduced a new approach that combined a so-called spectral neighbor analysis potential (SNAP) formalism with electrostatic interactions, which the authors named eSNAP.185 Taking as a case study a Li superionic conductor, Li3N, the study showed that the eSNAP model yields significantly better predictive power than traditional Coulomb–Buckingham interatomic potentials when assessing multiple properties, such as lattice constants, elastic constants, phonon dispersion curves, as well as long-time, large-scale Li ionic kinetics. In liquid electrolytes, Shao et al. showed that the ANN potential enables MD simulations of concentration-dependent ionic conductivity in alkaline electrolyte solutions, which are otherwise not feasible with brute-force DFT/MD simulations. In particular, they showed how the ion transport changes from the structural diffusion (Grotthuss mechanism) at the low concentration to the vehicular mechanism at the high concentration.186
The previously discussed studies certainly demonstrate the ability of ML potentials to enable large-scale simulations of complex compounds such as amorphous materials. However, ML-potential-assisted sampling requires evaluating a large amount of reference data points, especially when increasing the number of different chemical species to be considered and dealing at the same time with highly disordered or amorphous structures. Trying to mitigate this issue, Artrith et al. proposed a specific ML potential trained on a much reduced set of DFT calculations that were used to sample exclusively low-energy atomic configurations with a ANN-potential-assisted genetic algorithm.187 For the case study of amorphous LixSi alloys, the authors showed that such an approximated sampling approach was able to accurately reproduce a fully first-principles phase diagram, reducing the number of training first-principles data points by at least 2 orders of magnitude with respect to the construction of a completely converged general ML potential (Figure 14).
Figure 14.

Schematic workflow of an ANN-potential-assisted genetic algorithm used to construct the phase diagram of amorphous LixSi.187 Figure reproduced with permission from ref (187). Copyright 2018 AIP publishing.
ML-assisted development of interatomic potentials has also been applied to estimate the local properties of active electrode materials through cluster expansion (CE) methods. ML is particularly useful to increase the sampling efficiency (smaller clusters) when compared to conventional CE Hamiltonians of complex multibody interactions, as Natarajan and Van der Ven demonstrated by implementing a ANN model to reproduce DFT site energies of Li-vacancies in disordered LiTiS2.188 Similarly, Chang et al. have also integrated ML techniques into the general purpose CE code CLEASE.503 This approach is, in principle, generalizable to the prediction of any scalar property (e.g., formation energy, volume, bulk moduli, etc.) of multicomponent systems as a function of site occupation distribution, making it particularly useful to describe alloys and disordered intercalation compounds.
Jørgensen et al. have developed DeepDFT, a deep learning model formulated as a neural message passing on a graph, consisting of interacting atom vertices to predict the charge density of large systems very fast but still achieve QM accuracy. The model has been tested for NMC cathodes (with any level of Ni:Mn:Co ratio and varying level of lithiation) as well as liquid electrolyte (EC).189
Finally, ML techniques can also help analyze and interpret results of conventional MD simulations. To this end, unsupervised learning methods are particularly suitable. For example, Chen et al. developed a density-based clustering of trajectories (DCT) method to elucidate complex Li diffusion mechanisms from MD simulations of Li7La3Zr2O12 solid electrolyte.190 By calculating nuclear densities from MD trajectories, the DCT was able to recognize lattice sites, classify them into different types, and identify Li+ hopping events. Further spatiotemporal correlation analysis revealed the existence of long-ranged diffusivity or dominance of back-and-forth jumps as a function of the crystal structure (cubic or tetragonal) and Li-vacancy concentration. This information was relevant to identify the uncorrelated (correlated) Li diffusion in cubic (tetragonal) Li7La3Zr2O12.
2.3. Experimental Planning, Materials Screening, and Synthesis
While computational HT battery materials screening is developing at a sustained pace, experimental validation has become the main bottleneck for materials discovery. The traditional experimental process, based on researchers’ chemical intuition and trial-and-error single-batch experiments scheme, is inherently slow and economically expensive. To overcome this limitation, several groups have proposed to use HT synthesis methods—most of them consisting of combinatorial approaches—to screen both compositional spaces and synthesis conditions. Examples of combinatorial screenings of battery materials include exploration of composition ranges in negative electrode Si–M (M = Cr, Ni, Fe, Mn) thin films using physical vapor deposition methods,191 investigation of different preparation conditions on LiNi1/3Mn1/3Co1/3O2,192 mapping of the phase diagrams of the systems Li–Ni–Mn–Co–O,193−195 Na–Fe–Mn–O,196 and Li–Fe–M–PO4 (M = Mg, Mn),197,198 and using sol–gel ceramic synthesis routes. This shift from single-batch to parallel synthesis requires designing alternative synthesis setups, ideally operating automatically, but it also requires a paradigm shift in terms of sample handling and characterization, as well as data analysis. HT experimental approaches enable production of large and complex experimental data sets, which can be analyzed to extract correlations between synthesis conditions, and sample chemical nature, purity and properties. ML models can be used for this purpose, even though they are not yet widely applied in the battery field. Similarly, robotics combined with AI or ML is a promising candidate for autonomous material synthesis and electrode/cell optimization. However, few examples of this approach have been reported so far in the battery field,182,199 calling for further studies in this direction.
Beal and co-workers produced thin-film sample libraries of Li-ion electrolyte material Li3xLa2/3–xTiO3 solid solution and surrounding compositional space on different substrates.200 They used HT physical vapor deposition (PVD) with off-axis evaporator sources to obtain thin films with gradient compositions. Crystalline materials were obtained after thermal treatment. Samples were analyzed combining laser ablation inductively coupled plasma mass spectroscopy (LA-ICP-MS), spectroscopic ellipsometry, spectroscopic impedance, and X-ray diffraction (XRD). XRD data were analyzed by PCA and MCR-ALS to determine the crystalline phase distribution diagrams of thin films as a function of composition. The authors first employed a data-mining technique to get an overview of the large data set (6276 fields): recursive partition analysis enabled one to produce a DT classifying the importance of synthetic parameters (substrate, thickness deposition, and annealing temperatures) and elemental composition. Then, an ANN including a model data matrix (MDM) was used to analyze the influence of eight parameters on the impedance behavior and enabled it to determine the composition presenting the optimum total ionic conductivity (Figure 15).
Figure 15.

(A) Recursive partitioning analysis of the effect of synthetic parameters (elemental compositions, annealing, and deposition temperatures) on the percentage of Li3xLa2/3–xTiO3 observed within the samples deposited. (B) NN-based predicted total ionic conductivities in Li3xLa2/3–xTiO3 as a function of composition using empirical results as a training data set. Figure reproduced with permission from ref (200). Copyright 2011 American Chemical Society.
Alternatively, literature data (or text) mining is another AI-aided approach that can contribute to improve knowledge about materials synthesis. In a project not specifically focused on but including battery materials, Ceder’s group examined the synthesis conditions for various metal oxides and sulfides across tens of thousands journal articles.201 In each selected paper, the experimental sections were analyzed using parse trees, from which synthesis step parameters were extracted thanks to NN word labeling. The resulting text-mined synthesis conditions database is publicly available at ref (202). A simple analysis of this database enabled the authors to show the relationships between synthesis temperature and the compositional complexity of the metal oxides. For instance, quaternary lithium manganese nickel oxides are statistically produced at a higher annealing temperature than binary oxides such as alumina. The authors then used feature selection and classification techniques to identify the key factors that drive synthesis outcomes. They trained a DT across 22,065 journal articles on titania nanotube synthesis over 27 synthesis variables, and they showed for example that the NaOH precursor concentration is a determinant parameter in the hydrothermal synthesis of titania nanotubes. Finally, they compared a nonlinear Gaussian kernel SVM to a linear heuristic classifier in the prediction of the tetragonal phase formation in BaTiO3 and BiFeO3 and on the 2D-like morphology of ZnS and CdS. However, the authors of this study pointed out the necessity to improve ML models to retrieve information from the whole articles, including all sections of the main manuscript but also tables, figures, and Supporting Information; the lack of standardization on the presentation of the results is a big challenge for text mining. The general disregard for negative result reports is also a considerable limitation for the development of this approach; failed syntheses and unexceptional materials properties measurements would indeed constitute valuable data for literature data-mining-driven syntheses.136 Additional discussions in relation to text mining can be found in section 6 of this Review.
2.4. Perspectives and Challenges
The traditional experimentation process is based on a researcher’s chemical intuition and trial-and-error testing. However, this approach is inherently slow and economically expensive. HT experimentation, where a pool of candidates are first synthesized massively and then characterized, can mitigate in part this issue, especially when candidate materials are selected for experimental validation upon previous fast computational screening. However, the compositional space offered by the periodic table for the search for new battery materials is colossal. And the applicability of HT approaches is limited because of their inherent systematic search of chemical spaces, which often yields a combinatorial explosion and makes impractical the exhaustive rendering of a given candidate space.
AI-aided approaches can help overcome this issue. The central idea of this emerging new methodology is moving from pure HT exploration to navigating the candidate space in a selective manner and, by so doing, significantly reducing the number of required experiments or intensive computations. In other words, bring down the test matrix from many options to a select number of options and, therefore, provide unprecedented time reduction on current trial-and-error approaches in battery materials research. Essentially, this new paradigm reformulates the traditional discovery process as an optimization problem, where unbiased data-driven algorithms intend to emulate the researcher’s chemical intuition.
If successful, this new paradigm will allow the overall design of materials toward next battery generations in a quicker, cheaper, and more reproducible way than with conventional HT methods. In this section, we reviewed a representative number of recent examples of how AI-based techniques can indeed contribute to battery materials discovery. However, important challenges remain and will certainly be the focus of future work:
-
(1)
Universal materials descriptors. The efficiency and, ultimately, the success of a ML model relies on the selection of appropriate descriptors. Descriptors that encode as much as possible of relevant physics tend to generalize better. However, despite progress in recent years,203 automatic schemes capable of providing universal descriptors suitable for any arbitrary target property are still far from systematic. Solving this problem will certainly require large doses of creativity.
-
(2)
Data scarcity. While the number of descriptors in ML procedures can be large, the size of training data sets could be relatively small. This unbalance might, in general, lead to overfitting issues. To mitigate this, future research directions should consider the development of ML algorithms specifically geared for small data sets (e.g., hierarchical ML, reinforced learning, sequential learning, etc.). A useful additional strategy could be the use of transfer learning by incorporating theoretical data to experimental data, applying experimental-based corrective factors to computed data (e.g., bias learning).
-
(3)
Immature representation. AI methods do not incorporate physical laws governing complex materials attributes, and therefore, error propagation within the models is uncertain. Cross-validation of different ML models can help quantify such uncertainty by, for example, performing extensive calibration tests considering experimental or computational campaigns based on the same benchmark data. However, any training and cross-validation scheme requires a sample that is representative of the full chemical space under exploration. Truly representative samples are indeed very difficult to obtain, and in general, we need better methods to assess the error bars and transferability of ML models.
-
(4)
A lack of standardization. Missing agreed-upon data standards in materials not only hinder data to be shared and mined but also hamper data curation and interoperability, which is crucial to improve the predictive power of ML models and their efficient training. There is therefore a general need for convening working groups to address this issue and promulgate data standards among as diverse as possible stakeholders. Additionally, the proposal and consolidation of standardized theoretical and experimental test sets could be highly beneficial to help users identify the best ML method for each specific task as well as aid experts in developing new algorithms against established approaches.
3. Application to Electrode and Cell Manufacturing
Battery electrode and cell manufacturing constitute an emerging field of application for ML-based approaches, and it constitutes the focus of this section. In subsection 3.1, we recall the constitutive elements of traditional industrial-scale manufacturing process of LIBs. Then, in subsection 3.2, we review the main approaches that have been proposed for data recovery, with particular attention to the industrial scale, in the context of building trustable and big enough data sets to be analyzed through ML algorithms. Afterwards, in subsection 3.3 we present the current applications of ML algorithms in the field of battery manufacturing (schematic overview in Figure 16). Lastly, subsection 3.4 offers a perspective on future applications of AI/ML in the context of advanced manufacturing processes and industry 4.0.
Figure 16.

Infographic on the ML methods recently used in the literature to optimize and/or better understand manufacturing processes, including the corresponding nature (simulated vs experimental data) of the employed databases.
3.1. Traditional Manufacturing Processes
The main drivers for the development and improvement of LIB electrode manufacturing processes are the need of higher energy densities and lower costs to meet rising consumer demands. From a practical point of view, this lies mostly on the ability to significantly increase the electrode volume ratio of active materials (AMs) and thickness. To reach this goal, the manufacturing processes as a whole should be optimized to produce electrode architectures, assuring good electrical and ionic conductivities and adhesion with the current collector despite low additive volume ratio. Current LIB electrodes are usually manufactured by mixing the electrode components together with a solvent, forming a particle suspension called a slurry that is coated onto a metallic current collector (copper and aluminum for the anode and cathode, respectively). The coating process is followed by a drying step to remove the solvent and a calendering step to compress the electrodes to the desired thickness/porosity (Figure 17).
Figure 17.

Schematic of typical LIB electrode and cell manufacturing processes.205 Reprinted with permission from “The Future of Battery Production for Electric Vehicles”. Copyright 2018 The Boston Consulting Group Inc. All rights reserved.
Homogeneous coating requires a stable and processable slurry, for which the slurry formulation, mixing procedure and rheological properties are of paramount importance. Rheology measurements, for instance, shear-rate viscosity curves, can give a good indication of both slurry stability and processability.204 On the one hand, high viscosity for low shear rate (static condition) is desirable, because a highly viscous medium hampers particle aggregation and precipitation, which are the main reasons of slurry instability. On the other hand, the slurry viscosity should be as low as possible for the range of shear rates applied during coating, typically tens to hundreds of Hz, which eases the slurry processability. The electrode drying is a complex process involving solvent evaporation, additive migration, and particle sedimentation. The calendering (roll-pressing) step aims to reduce electrode thickness/porosity, promoting electronic conductivity, enhancing thickness homogeneity, and increasing electrode volumetric energy density, but at the cost of decreasing the active surface (AM surface in contact with the electrolyte) and electrode ionic conductivity.
With regard to the cell assembly, once the electrodes have been slit, calendered, and further dried to minimize moisture and leftover solvent, the electrodes are cut to match the shape of the desired cell format (Figure 17). This cutting step usually leaves some uncoated tabs that will serve to make electrical connections within the cell, usually carried out by ultrasonic or laser welding. Three cell formats are typically employed: pouch, cylindrical, and prismatic. The main advantages of pouch and cylindrical cells are the low production costs and high energy density at the cell level. By contrast, the prismatic cell format can lead to advantages in terms of energy density at the pack level.
Once the electrodes are packaged into the cell housing, the liquid electrolyte is added under a weak vacuum in extremely dry conditions and tightly controlled temperatures. During the filling process, metering precision, foaming, and the proportion of electrolyte evaporation should be considered to guarantee a homogeneous distribution of the electrolyte within the cell. Next, the housing is sealed and the batteries are stored under temperature-controlled conditions to enhance wetting and gas diffusion.
LIB electrode and cell manufacturing relies on highly complex processes with many parameters to be optimized: electrode and slurry formulation, chemical nature of AM(s), additive(s) and solvent(s), times and speed of the powders premixing and slurry mixing, coating speed and comma gap, evaporation time and temperature, calendering pressure, types of machinery used, formation protocol, etc. In addition, manufacturing optimization is further complicated by the lack of fundamental knowledge on the underlying physics behind some manufacturing processes and their interconnections. As an example, the viscosity of electrode slurries could be one of the critical parameters affecting coating and drying processes. All the above suggest that LIB electrode and cell manufacturing optimization is difficult and highly costly in terms of time and resources for both well-known and new chemistries. In this context, ML-based approaches have strong potential to accelerate and guide manufacturing optimization, as they can handle multidimensional data sets and provide a better understanding of manufacturing parameter interdependencies.206
3.2. Data Collection
The first step for developing a data-driven approach consists of the implementation of suitable data acquisition and data management (data warehouse) systems, allowing valuable data sets to be built, e.g., using autonomous workflows. The data can then be analyzed through ML algorithms aiming to disclose hidden trends and build new knowledge, which can ease battery manufacturing understanding and optimization. However, as briefly discussed above, battery manufacturing is an extremely complex and multivariable problem, where electrochemical performances should be considered together with safety, cost, life-cycle analysis, environmental footprint, and raw material supply chain, among other factors. To address this complexity through ML-based approaches, it is not possible to rely only on data quantity, but particular emphasis should be placed on data quality and veracity. Indeed, a wrong definition of the problem or the use of incomplete/not suited data sets could easily lead to wrong ML predictions. A statistical tool particularly suited to avoid this is design of experiments (DoE),77,207 whose aim is to define an experimental plan that both maximizes the statistical relevance of the so-obtained data and minimizes the number of experiments to be performed. Rynne et al. recently discussed this approach in detail for the case of electrode formulation, showing the potential of this technique in terms of building valuable LIB manufacturing data sets, which can be analyzed through classical statistical tools or ML algorithms.77 Particularly, by combining DoE and statistical analytical tools, the authors of the aforementioned works identified the best formulations, in terms of mass percentage of AM, electronic conductive additive, and binder, for high power applications. This was performed for two different AM chemistries (LFP and LTO) and considering two different electronic conductive additives (C65 and carbon nanofibers) and binders (PVdF and TPE), as illustrated in Figure 18. Overall, this work shows the potential of DoE, as claimed by the authors, in the context of LIB manufacturing optimization and calls for an upgraded version of this approach combining DoE and ML tools to disclose complex nonlinear relationships between manufacturing processes and electrode properties.
Figure 18.

Electrode capacity at 15C vs formulation for (top) 0 wt %, (middle) 10 wt %, and (bottom) 20 wt % of carbon black (C65). LiFePO4 (LFP) formulations are reported on the first and second columns, while Li4Ti5O12 (LTO) formulations are reported on the third and fourth ones. Polyvinylidene fluoride (PVdF) is used as a binder in the first and third columns, while polyethylene-co-ethyl acrylate-co-maleic anhydride (TPE), in the second and fourth ones. The lines are iso-capacities with values given in mAhg–1, where the electrode weight without the current collector is used to normalize the capacity. The empty areas are out of the study boundaries.77 Figure reproduced with permission from ref (77). Copyright 2020 American Chemical Society.
Even if DoE is a valid tool for both academia and industries, the complexity of data recovering and the amount of data produced are significantly higher for the case of industries. The rising demand for large-format lithium-ion cells will lead to expansion and new developments of manufacturing capacities, as well as to an increasing pressure to provide high-quality cells at low cost.208 However, the complexity of LIB process chain and the unknown interdependencies between process parameters, intermediate product properties, and quality characteristics are likely to lead to high scrap rates and great efforts for quality control.30 In particular, the cumbersome formation and aging procedures before final quality check contributes significantly to the manufacturing costs.209 Therefore, the identification of quality relevant parameters is crucial for cell manufacturers and plant engineering. Even if expert-based methods for quality parameter identification have been successfully applied to the ramp-up of battery production facilities,210 fundamental evidence on the relevant interdependencies in battery manufacturing can only be gained by experimental validation211−213 and data-driven methods.214,215 Due to the large number of processes and interactions in LIB process chain, a comprehensive experimental analysis of the production process is likely to be particularly challenging.39 In contrast, data mining methods have already demonstrated to be an efficient tool to improve manufacturing processes, for example in the semiconductor industry.216,217 In this context, Turetskyy et al. recently developed and reported a data-driven concept to automatically or manually acquire relevant data along the production line, process, store, and efficiently manage this data and finally analyze it through ML algorithms, as summarized in Figures 19 and 20.107 It should be underlined that the aforementioned work was focused on product quality criteria, but their procedure can be applied to other relevant industrial challenges, for instance, reducing energy consumption, environmental footprints, and costs. In addition, other critical aspects of industrial data recovery, management, and analysis link to the prosperous fields of sensor technologies, cyber-physical systems (CPS) and industrial internet of things (IIoT), as will be discussed in more detail afterward.
Figure 19.

Schematic of a LIB manufacturing process chain utilizing a data-driven approach.107 Figure reproduced with permission from ref (107). Copyright 2020 Wiley.
Figure 20.

Concept of a LIB factory data warehouse and its connection to data mining.107 Figure reproduced with permission from ref (107). Copyright 2020 Wiley.
Another critical aspect that should be considered when discussing data recovery and analysis of battery manufacturing is the uncertainty on the process parameters. Schmidt et al.218 proposed a model to describe and evaluate uncertainties along battery production, showing that manufacturing uncertainties significantly impact battery performance. Besides the results achieved by the aforementioned work, it is of interest to underline here the importance of uncertainties in battery manufacturing and the difficulty to consider them explicitly in classical ML models as NNs. Indeed, these models often use numerical values (typically the average ones) without explicit consideration of the associated error. This clearly points out a limit of classic ML-based approaches, which should be taken in mind when they are used. To tackle this limit, there are mainly two possible strategies: (i) work with data as accurate as possible, i.e., trustable data characterized by low error and high statistical significance, or (ii) implement more complex algorithm architectures to consider data uncertainties. (i) necessitates systematic repetitions of experiments, while (ii) requires the developments of probabilistic models as the ones based on Bayesian inference or ML models trained and built to output the average and the associated error.219 If none of these approaches is used, the limits of validity and the reliability of the ML model should be carefully assessed prior to its use.
3.3. Current Application
The first work addressing the use of ML for LIB electrode manufacturing at the laboratory/prototyping scale was reported by Cunha et al.220 In their work, the performance of three ML algorithms (DT, SVM, and DNN) in terms of predicting electrode properties as a function of manufacturing parameters is compared. The authors analyzed the impact of the slurry main characteristics (its active material weight ratio (wt %), solid content—here referred to as solid-to-liquid [S-to-L] ratio—and viscosity at the applied shear rate) over the dried electrode mass loading and porosity. The slurries considered were made of LiNi0.33Mn0.33Co0.33O2 (NMC), PVdF, and carbon black in NMP solvent. It was found that SVM combines high accuracy with a straightforward graphical analysis of the results, allowing to easily identify trends between electrode features and fabrication parameters. In particular, several trends linking the electrode mass loading and porosity to the slurry characteristics were disclosed, and all of them were explained in terms of the slurry viscoelastic behavior. Some examples of results are shown in Figures 21 and 22.
Figure 21.

SVM classification in terms of the dried electrode mass loading levels (low, medium, or high) as a function of the slurry viscosity and S-to-L ratio for different AM amounts: (A) 92.7%, (B) 94%, (C) 95%, and (D) 96%.220 Figure reproduced/adapted with permission from ref (220). Copyright 2020 Wiley.
Figure 22.

SVM classification in terms of the dried electrode porosity (low, medium, or high) as a function of the slurry viscosity and S-to-L ratio for different AM (NMC) weight contents: (A) 92.7%, (B) 94%, (C) 95%, and (D) 96%. Panels A′ and D′ provide the interpretation on the lack of low porous electrodes in panel A and their existence in panel D, respectively.220 Figure reproduced/adapted with permission from ref (220). Copyright 2020 Wiley.
The results reported in Figure 22 offer the possibility to briefly discuss an aspect of major importance in terms of manufacturing optimization through ML. Indeed, the trends disclosed for the electrode mass loading (Figure 21) can be easily explainable considering the effect of slurry viscosity and composition on the coating process, and the trends observed through the ML algorithm can be easily noted by using the raw experimental data, as well, while this was not the case for the electrode porosity. The mismatch between the trends observed through ML and through 2D plots of the raw experimental data leads to a deeper study of the slurry rheological properties by means of oscillation measurements. This leads to the understanding that the trends observed through the ML-based approach were correct and that they were linked to the effect of slurry storage and loss modulus on the electrode porosity. It is of interest to mention that, if from one side devoted experimental measurements were needed to confirm the trends disclosed by the SVM model, such trends would have been unnoticed if using the raw experimental data only. In addition, the high accuracy reached by using a small data set (82 data points) suggests that, if the data quality is high enough, it is possible to get reliable information from a ML algorithm trained with a small data set. In the case above, for example, all of the data used to train the ML model were obtained by averaging several experimental repetitions, all performed by the same expert operator.
The data set developed and freely provided by Cunha et al.220 was recently used by Liu et al.221 In their work, Liu et al. focused on the effect of the active material wt %, solid content, viscosity, and comma gap (i.e., the gap used during the coating process) on the electrode mass loading after the evaporation step. This study was carried out through Gaussian process regression (GPR) models (subsection 1.5.5) by using four different kernels. The main differences compared to Cunha et al. are that (i) they used regression algorithms instead of classification ones, (ii) they were not interested in analyzing the effect of manufacturing parameters on the electrode properties (as in Figures 21 and 22) but rather in disclosing the relative importance of the analyzed manufacturing parameters on the mass loading (i.e., which parameter affects the mass loading the most ) in a quantitative manner. In terms of accuracy, the exact predictive accuracy was not disclosed, but it can be observed from the figures reported in their publication that a high (most likely >90%) predictive accuracy was obtained. In terms of results, they showed that the comma gap is the key parameter controlling the mass loading, as expected. However, they also showed that the solid content affects the mass loading slightly more that the active material wt % for all four kernels used. This stresses once more the crucial role of the amount of solvent used during LIB electrode manufacturing.
A similar approach was recently proposed by Chen et al.222 to study the manufacturing of thin solid-state electrolytes, which are promising candidates to avoid the risk of cell flammability. In this context, principal components analysis, k-means clustering, and SVM (F1-score = 0.94) were used to automatically guide the manufacturing of Li6PS5Cl electrolytes. Similarly to the case of Cunha et al.,220 2D graphs were used as a metric to understand how formulation, amount, and kind of solvent affects the electrolyte ionic conductivity and film uniformity/homogeneity, guiding toward the optimal manufacturing conditions. This approach has led to the manufacturing of LiNi0.8Co0.1Mn0.1O2 ∥Li6PS5Cl ∥ LiIn cells that demonstrated a cyclability of 100 cycles at room temperature. In addition, the data set developed during this work was published and it can be reused for further analysis.
Thiede et al.223 introduced a data-driven approach focused on the entire LIB cell production process chain, with quality check as main focus. The goal of this approach is to identify critical factors in the manufacturing chain, understand their impact on the final battery performance, and avoid further production of bad quality parts or adapt the process parameters in order to bring back these parts to an acceptable tolerance range. The method proposed is based on data mining, defined here as the ensemble of procedures adopted to extract data along battery manufacturing, and data analysis,214,223,224 as will be described step by step in the following.
The first step followed by the authors was defining the cell production process parameters (PPs) to be considered, and the intermediate product features (IPFs) and final product properties (FPPs) to be characterized. For each PP variation considered at least seven cells were made, underlining the importance of working with highly accurate data, as commented above when discussing the work of Schmidt et al.218 The second step consisted of acquiring the data, either manually through a web interface or automatically through data acquisition systems, as, for instance, through the supervisory control and data acquisition system (SCADA) or manufacturing execution system (MES), similarly to the approach firstly proposed by Turetskyy et al.107 Once the data was obtained, three steps were followed to develop the final ML model: data cleaning, feature selection, and hyperparameter optimization. Data cleaning consisted of removing from the data set the columns with a high number of missing data and the IPF columns with zero or low variance, and replacing the missing values of the remaining columns with average values. Then, the number of IPFs should be reduced in order to keep only the most influencing ones, which in this study was performed combining a LASSO model225 with least-angle regression (LARS). Even if the aforementioned step surely decreased the complexity of the problem under analysis, increasing the ML model accuracy and lowering the computational cost, this should be performed carefully to avoid discarding features significantly affecting manufacturing process and battery performance. Lastly, the LASSO–LARS model is trained by using 80% of the so-obtained data set, by utilizing optimized hyperparameters, and tested with the remaining 20%.
As a first case study, this methodology was applied to analyze the effect of calendering, laser cutting, and z-folding (i.e., the PPs) on 11 selected electrochemical IPFs and FPPs, as capacity loss after the first cycle or self-discharge during aging, with a data set obtained by producing 172 z-folded lithium-ion pouch cells. The authors performed a one-way analysis of variance (one-way ANOVA) to check the influence of each PP on the selected FPPs, offering interesting insight into their relationships over the process chain. An example is the significant influence of laser cutting procedure on several FPPs. Figure 23a reports the correlations that have been found between PPs and three FPPs, while Figure 23b shows a combination of regression coefficients and p-values (a p-value <0.05 stands for high statistical significance). The latter representation is particularly convenient, because it allows evaluating at one glance both the degree of correlation between PPs and FPPs analyzed, i.e., the higher the coefficient, the higher the correlation, and the statistical relevance of such a correlation. As a result, the correlations in quadrant (I) significantly affect the FPPs and they are statistically confirmed, the ones in quadrants (II) and (III) call for additional data acquisition to be correctly evaluated, and the correlations in quadrant (IV) have low relevance.
Figure 23.

Multicriterial analysis of influencing factors on three FPPs studied by Thiede et al.223 Figure reproduced with permission from ref (223). Copyright 2019 Elsevier.
The lackings of this work are the use of the LASSO–LARS method as the only ML technique employed and the inner difficulty of transferring this approach to different industrial plants. Regarding the former, as claimed by the authors themselves, other ML techniques, such as NNs and RF, should be implemented in this methodology. Concerning the latter, the differences among industrial (or preindustrial) plants call for models to be developed considering the specific plant instruments and infrastructures. Nevertheless, the model developed by Thiede et al. can be used as a strong foundation to build these models, which is the reason this work was discussed in so much detail here. The same group recently extended this approach, building a computational infrastructure relying on CPSs and ML models to determine the IPFs required to reach the target FPPs and for decision support.226 Even though the size and veracity of the data set used should be increased for applications to larger-scale production (they considered 155 NMC | graphite pouch cells), this promising approach can be generalized to other chemistries and cell formats.
In addition to experimental results, data coming from physics-based models can also feed ML algorithms. Duquesnoy et al.21 recently published a work whose objective is to combine the HT of stochastically generated electrode mesostructures, allowing to build rapidly big data sets, and the high reliability of experimental and physics-based modeling results. In other words, the authors proposed a hybrid methodology (Figure 24) encompassing experiments, physics-based modeling, in silico generated electrode mesostructures, and ML. In this context, experimental results are used to quantify the evolution of macroscopic electrode properties, such as porosity, thickness, and mass loading, during a certain manufacturing process while physics-based modeling results can be used to quantify the evolution of the electrode mesostructures, such as percentage of contacts and active surface, during the same manufacturing process. Then, these trends are described in the form of mathematical equation(s) through fitting or ML algorithms. The second step (Figure 24, step B) consists of informing a data-driven stochastic electrode mesostructure generator (D-DEMG) about these trends through the mathematical equation(s). In particular, here the D-DEMG algorithm is capable of generating electrode mesostructures (electrode volume in the order of 105 μm3), which are built by following the trends disclosed experimentally and/or computationally. As an example, knowing the AM particle size distribution and the evolution of mass loading and porosity as a function of the evaporation conditions, the D-DEMG algorithm is capable of generating electrode mesostructures matching these properties, linking electrode mesostructure and manufacturing condition. In addition, a stochastic algorithm defines the macro/mesostructure features that are not known from experiments or modeling. The third step (Figure 24, step C) consists of analyzing the features of the so-generated electrode mesostrutures, as their tortuosity and effective conductivity, in order to build a data set linking process variables, i.e., the manufacturing condition, and the properties of the D-DEMG mesostructures. To take into account the partially stochastic nature of these structures, 10 or more electrode mesostructures are generated for each condition and the data set is built by using the average values. This is possible thanks to the low cost and high throughput of the D-DEMG algorithm, as discussed in more detail in ref (21). Lastly, this data set is processed through ML algorithms to find mathematical correlations between manufacturing conditions and electrode properties, which can also be used to construct human interpretable graphs mapping these correlations (Figure 24, step D).
Figure 24.

Overall workflow of the hybrid methodology presented in ref (21). Experimental and/or physics-based modeling results capturing the impact of manufacturing parameters on electrode mesostructure properties (A) are embedded in a D-DEMG algorithm (B) that generates electrode mesostructure associated to specific manufacturing conditions. These mesostructures are analyzed, building the data set (C) that is used to train and validate ML algorithms. This allows describing mathematically the correlations between electrode properties and process variables as manufacturing conditions (D). Dark gray arrows represent the steps considered along the case study presented in ref (21), while light gray ones indicate future perspectives of this methodology. Figure reproduced with permission from ref (21). Copyright 2020 Elsevier.
The methodology described in Figure 24 constitutes the core of the ERC-funded ARTISTIC project, which aims to establish a predictive digital twin of LIB manufacturing, allowing both direct and reverse engineering.15 In the publication by Duquesnoy et al.,21 a simpler version of this hybrid methodology was applied to a first case study. In particular, the authors focused on the calendering step and used only experimental data (active material particle size distribution and evolution of electrode porosity upon calendering) to feed the D-DEMG algorithm. The ML-based analysis relied on a data set with >800 data points, each of them arising from the average properties of 10 D-DEMG electrode mesostructures, and studied the effect of calendering pressure, electrode composition, and initial thickness on several mesostructural electrode properties. The summary of their findings is reported in Figure 25. This first study demonstrated that this methodology is faster compared to the state of the art and can lead to a more rational understanding of the electrode-manufacturing correlations.
Figure 25.

(A) Example of outputs (for the case of the electrolyte tortuosity) from Duquesnoy et al.21εinit stands for the electrode porosity prior the calendaring, the color scale indicates the AM wt %, and the values reported in the graph indicate the electrode porosity after the calendering for certain calendering pressure. (B) Correlations between calender pressure and electrode properties before calendering and several mesoscale properties studied by Duquesnoy et al.21 Green and red colors represent direct and inverse relations, respectively, while the size of the circles indicates the degree of correlation (i.e., big circles, strong correlation) obtained by a PCA-based study. The last column indicates the sense to which the property should be tuned (i.e., maximize or minimize the property) in order to increase the energy density. Figure adapted with permission from ref (21). Copyright 2020 Elsevier.
Gao et al.22,227 recently presented another approach based on the idea of combining multiscale modeling and AI. This approach, named cyber hierarchy and interactional network based multiscale electrode design (CHAIN-MED), aim to map the relationships between physical and virtual world to optimize electrode design and manufacturing conditions. Particular attention is also posed in linking the different scales of interest for LIBs, i.e., nano, micro and macro features. Overall, the CHAIN-MED approach is surely of interest for manufacturers and researchers, but its main limitation is the need for a large amount of data, requiring tremendous storage and computational resources.
Coming back to more classical approaches, Primo et al.228 recently analyzed the calendering step through an experimental approach supported by advanced statistics (ANCOVA and PCA) and ML classification based on k-means clustering. This work analyzed 28 different calendering conditions, in terms of applied pressure, roll temperature, and speed, for electrodes of possible industrial interest, i.e., containing a high weight fraction of AM (96 wt %). It was found that calendering pressure is the parameter that mainly controls electrode porosity and mechanical properties, while the roll temperature mainly affects electrode electronic conductivity. This innovative procedure was also able to propose an optimal range of temperature and pressure, between 60 and 75 °C and from 60 to 120 MPa, for maximizing the electrode volumetric capacity at 1 C (170 mA g–1). Even if these optimal ranges depend on the specific machinery used, the proposed approach is transferable to other manufacturing processes, machineries, and conditions.
The interest in physic-based models focused on one or more manufacturing step(s) is rising, as previously reviewed in ref (229). In addition, it has started to be demonstrated that the parametrization of these models can be sped up through ML-based approaches.
Lombardo et al.230 developed a coarse grained molecular dynamics (CGMD) physics-based model to simulate LIB electrode slurries and used a combination of DNN and particle swarm optimization (PSO)231 to ease the force field (FF) parametrization. The final aim of this work was to set up appropriate metrics to validate simulated 3D slurry mesostructures by using experimental results as a reference. Particularly, the proposed approach relies on the comparison of experimental and simulated slurry density and shear-viscosity (η–γ) curves, which critically affects the coating and mixing processes and the electrode properties after coating and drying. The simulated η–γ curves were obtained by using as inputs the experimental slurry composition and active material particle size distribution, while the fitting with respect to the experimental results was carried out by parametrization of the FFs used for the CGMD model.
Even if the results obtained allowed demonstrating the correctness of both the model used and the parametrization performed, the high computational cost of the proposed approach could hamper its wide adoption. Therefore, the authors developed several optimization algorithms based on PSO theory to accelerate the model parametrization. Figure 26A shows a schematic of its working principle. Briefly, in its simpler version the PSO algorithm is able to launch several CGMD simulations in parallel, recover and analyze their results by comparing the simulated slurry density and η–γ curve to their experimental counterparts, and finally guess the FF parameter values needed to fit the targeted experimental results. This procedure is performed iteratively until the PSO converges to the actual FF parameter values needed to fit the experimental slurry density and η–γ curve. Another approach (ML-driven PSO) relies on a combination of PSO and DNN (Figure 26B), where the identification of the most promising parameters is performed by the PSO and DNN in parallel, which allows to further speed up the parametrization. The results of both PSO and DNN are added to the DNN data set at the end of each iteration, aiming to improve its accuracy during the optimization procedure.
Figure 26.

(A) Schematic of the particle swarm optimization algorithm developed by Lombardo et al.230 Left, initial guesses of the PSO algorithm in terms of FF parameter values for the CGMD simulations (linked to their associated 3D slurry structures). Right, the PSO algorithm converged to the FF parameter values needed to match the targeted experimental results. For each set of FF parameter values, a schematic of the associated slurry 3D structure is reported as well. In Lombardo et al.,230 eight CGMD simulations were launched in parallel for each iteration. (B) PSO merged with a DNN algorithm to speed up the algorithm convergence. For each iteration, dots represent FF parameter values tested by the PSO, while the star indicates the ones predicted by the DNN. All the results of each iteration were added to the data set in order to improve the DNN accuracy. At the end right, a comparison of experimental (line) and simulated (dots) results is reported. Figure adapted with permission from ref (230). Copyright 2020 Wiley.
3.4. Opportunities for Advanced Manufacturing and Industry 4.0
As discussed above, data-driven methods are valuable tools to boost the understating and optimization of a single manufacturing process220 or the complete manufacturing process chain.107,223
Industrial manufacturing is more standardized than the academic-oriented materials research discussed in section 2, and have the capabilities needed to build big data sets, suggesting that AI/ML applied to this field has a strong potential and can be helpful for accelerating process optimization.12 Academic or national laboratories disposing of battery manufacturing prototyping units can contribute in the methodology development and demonstration, while lab-scale research can contribute by developing ML-based tools and data infrastructures aiming to bring new knowledge in the field. However, the application of ML-based approaches to important aspects such as recyclability and material availability remains understudied, calling for actions in this direction.
To exploit to its maximum the ML and AI potential when applied to battery manufacturing there is still an important piece of the puzzle that is missing: the enhancement of industrial production machineries and production processes to go from modern industries to smart manufacturing or Industry 4.0. In other words, the battery industry needs a paradigm shift on production systems based on data recovery, storage, and communication, combined with AI/ML-based model implementation and data analysis. A possible advantage of this shift could be on the fly optimization of the production processes as a function of external stimuli, for instance, higher or lower amount of resources or costs, different ambient conditions, or variation in market demands. The rapid adaptation of cell production chains could be particularly critical considering the price fluctuation of key elements as cobalt and lithium232 or the sensibility of certain cell components to water and oxygen content, among others. The term “Industry 4.0” was introduced for the first time at the Hannover Messe Trade Fair established by the German government in 2011.233 Even if it is difficult to find a universally accepted definition of Industry 4.0, common features are interconnectivity between physical and cybernetic domains, decentralized decisions, and humans-robots collaboration.234 To reach such a visionary goal, manufacturing plants should overcome four main challenges: (i) the capability of performing real-time measurements all along the manufacturing chain, (ii) being able to interact with the physical industrial environment through digital infrastructures, (iii) well-established communication procedures able to connect machines, operators, and data management systems, and (iv) the computational capability to store, clean, and analyze the so-obtained data.
The first challenge could be addressed thanks to sensors235 able to measure critical fabrication parameters and intermediate product features in the context of continuous manufacturing, together with manual data recovery when automatic approaches are not possible. The second challenge is linked to CPS,236 i.e., systems enabling intercommunications between digital and physical worlds, allowing recovery of critical information coming from the manufacturing line and taking actions to adjust on the fly the manufacturing protocol. The third challenge is associated with the field of IIoT,237 which should allow interconnecting all the information coming from sensors and production machineries to the operators and servers, enabling their real time analysis and easing decision-making. Lastly, the fourth challenge is a function of the computational resources available in situ or in cloud and to the algorithms available to analyze the data, in which ML-based algorithms are likely to play a critical role. In addition, it should be stressed that the computational platforms developed in the context of Industry 4.0 should also consider the product end of life and recyclability, which is becoming of increased interest in countries with few raw materials. In this context, life cycle assessment analyses are likely to play a key role in the future.238−240 Other key technologies that will likely play a role in this revolution are digital twins241 and augmented/virtual reality. The former can be based on a combination of multiphysics, surrogates, and ML-based models to reproduce manufacturing processes in silico, assisting the production of targeted electrode mesostructure/electrochemical performance,15,16 while the latter can be used for support, user-friendly usage, or training. Lastly, cybersecurity will be critical as well and a possible contribution could come from the blockchain technology, among others.242
4. Materials and Electrode Architecture Characterization
In this section, we review how AI/ML methods can assist electrodes and materials characterizations in the preprocessing and segmentation of data, the feature detection, the pattern identification, and to conduct characterization experiments in real time. Characterization-related data production nowadays is several orders of magnitude higher than a few decades ago, mainly due to the rapid growth around the fast detector technologies. Improvement of computing power and emergence of ML algorithms allow scientists to build data-driven frameworks to automate the management of big data acquired. The early age of AI based on DNN algorithms was essentially focused on image processing, with the final aim of identifying specific image features and separating them via the segmentation step. CNNs have gained tremendous success in solving complex inverse problems, which are the main difficulties of the reconstruction steps for tomography and ptychography techniques. ML can also be used to assist the complex analysis of spectra and diffraction patterns, and in particular for the analysis of HT and in situ/operando data. In the following, we review the applications of ML to the characterization of battery materials (subsection 4.1) and electrode architectures (subsection 4.2). We also refer to relevant works whose ML methodologies could be easily applied to battery materials, components, and electrode characterization discussing possible future applications of ML in the field (subsection 4.3). Figure Figure 27 depicts a schematic of the ML methods employed in material and electrode architecture characterization, their frequency, and the nature of the data set used.
Figure 27.

Infographic on the ML methods recently applied to materials and electrode characterization, including the corresponding nature (calculated vs experimental data) of the employed databases.
4.1. Materials Characterization
4.1.1. Spectroscopy Techniques (XAS)
XAS is frequently used to characterize electrode materials, as it enables one to determine the oxidation state of the redox elements in the electroactive compounds but also provides information on the local environment of the probed elements. The analysis of XAS data is however not straightforward. Typical analysis relies on comparisons of the spectra of interest with those of well-known reference compounds. Open libraries of experimental data are rare. Therefore, the development of ML tools for the advanced and accelerated analysis of spectroscopic characterization data is, here also, hampered by the availability of reliable data sets. ML analysis of experimental data is usually done on narrow sets of chemistries. The progressive change of public institutions’ policies toward open access data could favor the creation of high-quality open access experimental databases, in particular for these costly and limited-access characterization spectroscopic techniques which require synchrotron or neutron sources.243 Public databases of raw data are indeed being progressively built thanks to limited-time (typically 3 years) embargo policies on the data obtained from such public institutions. However, the usability of these data will depend on the availability and reliability of the associated metadata provided by the users. Meanwhile, ML methods are developed on larger data sets and broader chemical space using computed data (cf. section 2). However, it remains still unclear to what extent ML models trained on computed data can be applied to experimental situations.
The Materials Project database has hence been used to generate a large public database (XASBD) of 58,0000+ K-edge XAS spectra of 52,000+ crystal structures.244 From this database, Ong’s group assessed five ML models (kNN, RF, MLP, CNN, support vector classifier (SVC)] for the identification of the coordination number and coordination motifs of 33 cations using a training set of ∼190,000 site-specific K-edge XANES of ∼22,500 oxides.245 The best results were obtained using RF models, which enabled one to determine the coordination number and coordination motif of a given metal with accuracies and Jaccard score as high as 85.4 and 81.8%, respectively; these scores outperform the baseline of a systematic assignation of the known preferential coordination environment for each cation. The RF classifiers were then applied to 28 XANES spectra and successfully identified the coordination environments of 23 of them [prediction accuracy of 82.1% and Jaccard score (a statistic index used to compare the similarities between samples, i.e., the higher the value, the higher the similarities) of 80.4%, comparable to the computational test set] (Figure 28).
Figure 28.

Performance of five ML classifiers (kNN, RF, CNN, MLP, and SVC) on coordination environment classification. (A) Accuracy and (B) Jaccard score for the five ML classifiers broken down by elemental categories, namely, alkali metals, alkaline earth metals, transition metals (TMs), post-transition metals, metalloids, and carbon. (C) Relationship between the RF model’s classification accuracy and the data set size. (D) Relationship between the RF model’s classification accuracy and the training label entropy. Cation elements with a classification accuracy less than 0.85 are labeled in parts C and D. Figure reproduced with permission from ref (245). Copyright 2020 Elsevier.
4.1.2. Diffraction Pattern Analysis
Experimental X-ray or neutron powder diffraction (XRD and NPD) patterns are typically analyzed using peak positions, intensities, and full widths at half-maximum (fwhm) of peaks. Scientists usually use open or paid databases, such as the Crystallography Open Database246 (COD) or the Inorganic Crystal Structures Database (ICSD)247 to identify from the XRD patterns the crystalline phases present in the analyzed samples. For electron diffraction (which is usually repeatedly performed on many single crystals), the data analysis follows a similar tedious workflow of comparing the experimental patterns with predicted ones. This procedure is laborious and time-consuming due to the manual analysis. A robust and automated tool to determine crystal symmetry turns out to be of importance in material characterization and analysis. It becomes urgent to develop new data processing tools with automation and recommendation functions. Recently, AI models based on CNN algorithms have shown great potential in managing the large volumes of characterization data for rapidly and automatically identifying composition and phase maps as well as constructing structure and property relationships. Here recent studies reported that deep learning methods can effectively reveal the correlations between X-ray or electron-beam diffraction patterns and crystal symmetry. A CNN can help in reliable classification of crystal structures from a small amount of TEM images and electron diffraction patterns, allowing phase identification of the constituent phases in a multiphase inorganic mixture, predicting the space group of a structure given a calculated or measured atomic pair distribution function (PDF) and quickly identify the experimental XRD patterns of metal–organic frameworks.
Aguiar et al.248 developed a CNN model for reliable classification of crystal structures from small amounts of TEM images and electron diffraction patterns (Figure 29a). Their model, using a deep-learning nested framework, can extract crystallographic information from high-resolution image and electron diffraction data to effectively extend the limits of human-centric analysis. The CNN model is trained on a data set consisting of diffracted peak positions simulated from over 538,000 materials with representatives from each space group. As a result, even peaks in diffracted low-signal to noisy images can potentially be extracted. The simplicity and efficiency of the method, capable of predicting crystallographic structures, reduce artifacts and robustly address the need for efficient cross-validation, surpassing limitations in the crystallography of unknown materials.
Figure 29.

(a) NN data architecture and workflow for crystal space group determination from experimental high-resolution atomic images and diffraction profiles. Seeding the prediction of crystallography is a hierarchical classification using a one-dimensional CNN model.248 (b) XRD data preparation protocol. Comparison between experimental and simulated XRD patterns for Al2O3, Li2O, SrO, and SrAl2O4. Green and brown lines stand for experimental and simulated XRD patterns, respectively.249 (c) A scheme of the automated determination of crystal symmetry based on diffraction experiments.250 (d) The ratio of correctly classified structures versus space-group number from the CNN model. Marker size reflects the relative frequency of the space group in the training set.251 (e) This CNN model trained by the data augmentation technique would not only open numerous potential applications for identifying XRD patterns for different materials.252 (a) Figure adapted with permission from ref (248). Copyright 2019 American Association for the Advancement of Science. (b) Figure reproduced with permission from ref (249). Copyright 2020 Springer. (c) Figure reproduced with permission from ref (250). Copyright 2020 Springer. (d) Figure reproduced with permission from ref (251). Copyright 2019 International Union of Crystallography. (e) Figure reproduced with permission from ref (252). Copyright 2020 American Chemical Society.
Lee et al.249 developed CNN models allowing phase identification of the constituent phases in a multiphase inorganic mixture sample consisting of Sr, Li, Al, and O (Figure 29b). They simulated 1,785,405 synthetic powder XRD patterns by combinatorically mixing the simulated powder XRD patterns of 170 inorganic compounds. The CNN models use this large data set for training steps. Network models are built and trained using this large prepared data set. The fully trained CNN model accurately identifies the constituent phases in complex multiphase inorganic samples. A test with real experimental XRD data returns an accuracy of nearly 100% for phase identification and 86% for three-step-phase-fraction quantification.
Tiong et al.250 used a combined approach of shaping 2D X-ray and electron diffraction patterns and implementing them in a specific NN model, called MSDN, which substantially improves the accuracy of classification (Figure 29c). They demonstrated that the multistream DenseNet (MSDN) model, which uses a data set of 108,658 individual crystals sampled from 72 space groups, achieves 80.2% space group classification accuracy, outperforming conventional benchmark models by 17–27 percentage points. The pattern shaping strategy, used to differentiate close symmetrical crystal systems, appears to enhance the classification accuracy. Furthermore, the novel MSDN architecture is advantageous for capturing patterns in a richer but less redundant manner relative to conventional CNN. This new CNN model enables accurate classification of space groups and makes the identification of crystal symmetry easier. In a perspective point of view, defects exist in a large variety of forms in the crystals such as grain boundaries, dislocations, voids, and local inclusions and may have a large impact on material properties. Identifying the crystal symmetry of defected materials based on the same type of model would be intensively explored in the next few years.
A CNN model, presented in the paper of Liu et al.,251 successfully predicted the space group of a structure given a calculated or measured atomic PDF powder pattern of that structure. It can identify space groups for 12 out of 15 experiments of PDF. The model has been trained on more than 100,000 PDFs calculated from structures in the 45 most heavily represented space groups. Figure 29d shows the ratio of correctly classified structures versus space-group number from the CNN model. This model, which is implemented with Keras, can reach an accuracy of 91.9% from the top 6 predictions when it is evaluated against the testing data. This preliminary success of the CNN model seems to show the possibility of model-independent assessment of PDF data on a wide class of materials.
Wang et al.252 proposed a CNN model for fast identification of experimental powder XRD patterns of metal–organic frameworks (MOFs). The network was trained based on theoretical data and very limited experimental data. Data augmentation for training the model uses noise merged with the main peaks extracted from theoretical patterns to produce new patterns (Figure 29e). The optimized CNN model showed the highest identification accuracy of 96.7% for the top 5 rankings among a data set of 1012 XRD patterns. This CNN model opens numerous potential applications for identifying XRD patterns for different materials but also paves avenues to autonomously analyze data by other characterization tools such as Fourier transform infrared (FTIR) spectroscopy, Raman, and nuclear magnetic resonance (NMR) spectroscopies.
Ceder’s group253 recently developed a probabilistic deep learning algorithm to identify complex multiphase mixtures in powder XRD patterns. The CNN was trained on simulated patterns of 140 reference phases of the Li–Mn–Ti–O–F chemical space, which includes some battery materials of interest such as spinel and rocksalt phases. The training set was augmented with physics-informed perturbations to account for experimental artifacts that can arise during experimental sample preparation and synthesis (i.e., strain, texture, and domain size), as well as with off-stoichiometry perturbations to account for hypothetical solid solutions, resulting in ∼20k patterns. The trained algorithm was tested against thousands of simulated patterns and dozens of experimental patterns, both achieving high accuracy (92–94%) for the phase identification. The authors highlight that the method is not intended to replace Rietveld refinements, but it can provide a rapid phase identification to support HT and autonomous experiments, and to serve as a starting point for further Rietveld analyses.
4.1.3. AI-Aided Data Analysis of in Situ/Operando Experiments
The continuous development of the state-of-the-art instrumentation and software, the improvement of time, energy and spatial resolution, and the acceleration of data acquisition rate, in particular at large-scale facilities, have generalized the use of in situ and operando experiments to study the mechanisms involved, for example, in synthesis reactions, battery operation, or battery material abuse conditions. Such experiments usually produce large data sets, containing several tens or hundreds of spectra or patterns. The traditional approach consisting of a point-by-point or spectrum-to-spectrum analysis becomes then inefficient, or sometimes simply unfeasible. In addition, the access to cutting-edge facilities, such as synchrotron or neutron sources, is usually granted for punctual experiments. Therefore, as pointed out by Aoun et al.,254 a quick and effective evaluation of the results “on the fly” of the experiment is highly desirable to enable the research team to decide for eventual experiment modifications depending of the results observed live, and thus get the most of the granted beamtime.
To rapidly extract relevant information and analyze such large data sets, which can most of the time be described as a series of ranked correlated data, informatics tools and in particular chemometrics methods have proven to be efficient (chemometrics is an interdisciplinary area between analytical chemistry and statistics). Although developed since the beginning of computer and automated data acquisition in the 1970s, these methods have been applied to the battery field in the last 15 years. Fehse et al. have recently published a short review about the application of PCA and MRC-ALS to analyze the large data sets of operando XAS, full-field transmission soft X-ray microscopy, or Mössbauer spectroscopy experiments to understand the reaction mechanism of battery materials.255 These two methods rely on decomposing the series of spectra into independent components, whose linear combination enables them to describe each single spectrum. Since these methods do not require extensive information as input except for the data set, they are usually free from experimenter bias for the detection of the different components, and hence sometimes enable unexpected features to be unveiled. As an example of application to the battery field, PCA and MCR-ALS analysis were then employed to isolate elusive intermediate and transient phases formed upon reaction of intermetallic compounds with Li and Na256−258 or to decouple partially overlapping cationic and anionic processes in Li-rich materials.259 As for in situ synchrotron XRD experiments, Aoun et al. studied the solid-state reaction mechanism involved in the synthesis of the cathode material LiNi0.7Mn0.15Co0.15O2 using a method based on Pearson’s correlation functions and statistical scedasticity formalism to analyze the series of synchrotron XRD patterns (scedasticity consists of the analysis of whether the residuals vary with the signal level).254
These methods can be completed by ML methods for a faster and more advanced analysis of the experimental data. As an example taken from the catalysis field, Guda et al.260 have used ML methods based on ensembles of DT and RR to predict the interaction distance and molecule orientation of NO, CO, and CO2 molecules absorbed on the Ni active center of a CPO-27-Ni MOF upon gas adsorption. They compared the results of two different approaches: (i) in the indirect approach, they use the training data set to establish the correspondence from geometry (input) to XANES spectrum (target function), predict the XANES spectra for given geometries, and compare them to the experimental spectra, while, (ii) in the direct approach, they use the training data set to establish the reversed correlation from the XANES spectrum (input) to the geometry (target function) and submit the experimental spectra as an input to predict the corresponding geometry. Such approaches could, for instance, be used to monitor the local environment of redox species upon battery operation.
4.2. Electrode Architecture Characterization
The hierarchical architecture of composite electrodes plays a crucial role in the performance of LIB electrodes in which it affects the effective electronic and ionic transport properties, the electrochemical kinetics via the interfacial area between phases, and the mechanical properties. Therefore, it is crucial to have a deep insight into the correlation between the complex microstructure of porous electrodes and their electrochemical performance. X-ray tomography allows spatial analysis on the microstructural properties, and thus, it gives access to their inhomogeneities, causing degradation, macroscopic failures, nonuniformity of electrochemical kinetics, and mechanical properties. The knowledge of the complex 3D architectures goes through two inevitable and critical processes, reconstruction and segmentation, both being sources of information uncertainty. Spectroscopy techniques such as Raman and XAS can also provide interesting information about electrode microstructures and their inhomogeneities.
4.2.1. Tomography and Ptychography Reconstruction
The X-ray tomography is a robust characterization, for which the battery research shows tremendous interest during the past decade and that continuously exhibits its potential and uniqueness by providing a deeper understanding of the battery with material morphological and spatial information.261 Being beneficial from its compelling noninvasive property, operando and in situ experiments were developed and revealed important dynamic aspects of battery materials, such as 3D distribution262 and displacement,263 steric changes,264 and dimensional oxidation evolution.265 The micro-computed tomography (CT) offers the capability of characterizing large volumes to visualize the entire battery device, whereas the transmission X-ray tomography (TXM) nanoCT provides a spatial resolution below 50 nm allowing access properties at the nanoscale. However, it is a data-massive technique that raises challenges in terms of processing speed and accuracy. For instance, in the synchrotron facilities, one tomography acquisition generates hundreds of projections in a series (usually around a thousand frames of 2000 × 2000 pixels, from 0 to 180°), called a sinogram, which has a size of 16 Gb. It is then reconstructed into a stack of tomograms and further seized into a representative cuboid that remains a few billions of voxels (pixels in 3D space) for the analysis (1000 × 1000 × 1000 voxels in length, width, and height, respectively).
The blooming of ML in the recent years has triggered disparate interesting applications in tomography data processing and analysis. For the tomographic reconstruction, the inverse problem algorithm usually induces the formation of artifacts in the resulting tomogram due to optical line defect, missing wedge, and unsteady rotation. Different ML approaches turn out to be efficient to improve this crucial processing in 3D imaging. A recent study reported that generative adversarial networks (GANs) could also achieve the reconstruction of X-ray ptychographic tomography data.266 In this work, the algorithm uses a GAN network to solve an inverse problem, i.e., tomography reconstruction, using the Radon transform. The workflow works with a self-training reconstruction procedure based on the physics model, where the GAN network fits the input sinogram with the model sinogram generated from the predicted reconstruction, as shown in Figure 30a. The algorithm exhibits significant improvements in the tomography reconstruction accuracy. Ding et al.267 present a model based on the GAN network to recover information in the missing-wedge sinogram of electron tomography and reduce the artifacts after the reconstruction steps (Figure 30b). They built a sinogram filling model based on residual-in-residual dense blocks and a U-net structured GAN to reduce the residual artifacts. Their approach offers superior peak signal-to-noise ratio and structural similarity index measure (SSIM) compared with the traditional methods, notably for acquisitions with missing angle even for 45°. In their study, Liu et al. designed an algorithm as-called TomoGAN, which is a de-noising technique based on GANs, to improve the reconstructed image quality for low-dose experiments (Figure 30c).268 Their approach can drastically reduce the noise in reconstructed images, and the quality of the reconstructed images using filtered back projection and the de-noising approach exceeds that of iterative reconstruction techniques.
Figure 30.

(a) The workflow of the GAN reconstruction (GANrec) algorithm. The input is a tomography sonogram (X-ray ptychographic tomography data), which is transformed into a candidate reconstruction by the GAN generator. The candidate reconstruction is projected to a model sinogram by a Radon transformation. The model sinogram is compared with the input sinogram by the discriminator of the GAN, in which a GAN loss is obtained based on this comparison. The weights of the generator and discriminator of the GAN evolved by optimizing the GAN loss.266 (b) The missing-wedge problem in electron tomography is solved using GAN.267 (c) Two different reconstructions of a noisy simulated data set, on the left, the results of conventional reconstruction with a high level of noise and, on the right, the same image after de-noising with TomoGAN.268 (a) Figure reproduced with permission from ref (266). Copyright 2020 International Union of Crystallography. (b) Figure reproduced with permission from ref (267). Copyright 2019 Springer. (c) Figure reproduced with permission from ref (268). Copyright 2020 The Optical Society.
4.2.2. Image Segmentation
Semantic segmentation of 2D images or 3D volume is one of the key problems in the computer vision field. Many applications, such as autonomous driving, augmented reality, and facial recognition systems, need accurate and efficient segmentation steps.269 The rise of AI approaches in the field of computer vision coincides with the strong demand around semantic segmentation of a large variety of data sets. In the tomography workflow, after the sinogram reconstruction, the 3D analysis is usually preceded by a step of segmentation in which each voxel of the raw stack is digitally partitioned into different phases according to its value and environment. The basic method using a threshold on the gray level distribution does not allow in most cases an accurate segmentation. This is mainly due to the overlapping of greyscales, especially with materials with similar X-ray absorbance and X-ray computed tomography (XCT) data exhibiting reconstruction artifacts and camera noise. Strictly partitioning different phases in the image using thresholding is applicable only if the histogram is distinctively multimodal. One of the widespread efficient methods used by scientists to segment tomography data is based on the coupling of fixed feature extractors and a RF classifier (Weka-FIJI).270 However, more recently, encoder–decoder CNNs were shown to be able to automatically learn the features and compute the segmentation.
Dixit et al.271 used in situ X-ray tomography to study solid-state electrolyte versus lithium metal in Li | LLZO | Li cells. They combined low-contrast image processing and CNN-based image segmentation to quantitatively track morphological modifications in Li metal electrodes and buried solid/solid interfaces during stripping and plating processes. The NN was trained on 800 images obtained by using one electrode during a single electrochemical cycle, and validated by using 200 additional images from the same electrode. The individual slice segmentation time was approximately 0.3 s, for a segmentation confidence greater than 80%, comparable to the segmentation confidence obtained by state-of-the-art networks on standard data sets. The image processing enables quantifying local hotspots in Li metal correlated with microstructural anisotropy in the solid electrolyte. The porosity and tortuosity maps through the depth of the sample revealed the difference between the pristine pellet and the failed electrolyte pellet (Figure 31a).
Figure 31.

(a) Subsurface porosity map measured through the depth of the sample for the pristine and the failed electrolyte pellet.271 (b) Cross section through the EBSD image of NMC depicting grain boundaries using FIB-EBSD. Segmentation result of the watershed algorithm in which each region is colored individually after removing regions outside of the considered NMC particle.272 (c) A depth-dependent particle fracturing profile in the Ni-rich NMC electrode revealed by X-ray computed tomography. The scale bar is 20 μm. (d) The 3D image of the segmentation results over two regions of interest, with the carbon binder domain (CBD) set to be transparent for a better visualization of the NMC particle (orange) and the pores (gray–blue).273 (e) Results on the graphite electrode with a map of Bayesian CNN uncertainty, which is focused around the light gray edges of the material in the original slice, while the Monte Carlo dropout network uncertainty is pixelated.274 (a) Figure adapted with permission from ref (271). Copyright 2020 American Chemical Society. (b) Figure adapted with permission from ref (272). Copyright 2021 Elsevier. (c, d) Figure reproduced/adapted with permission from ref (273). Copyright 2020 Springer. (e) Figure reproduced with the authors’ permission from ref (274).
Furat et al.272 computed NMC secondary particle segmentation of image data using a combination of the ML technique and conventional image processing. ML segmentation facilitated identification and labeling of distinct particles in 3D. The 3D segmented image was used for the quantification of subparticle grain architectures. In this study, focused ion beam (FIB) slicing in sequence with electron backscatter diffraction (EBSD) is used to accurately quantify intraparticle grain morphologies in 3D (Figure 31b). They used a CNN network as-called 3D U-net reducing the amount of preprocessing needed prior to the segmentation step. The loss function has been modified so that the network can be performed with just a few labeled slices.
Jiang et al.273 investigated the degradation of NMC material resulting from the cycling with a derived CNN approach (Figure 31c,d). The segmented volume of XCT can be used as input for electrochemical models to simulate the electrochemical performance, which helps to understand the transport phenomena in the electrode and design better electrodes.
LaBonte et al.274 presented a deep learning approach for the segmentation of 3D XCT scans of graphite electrodes for lithium-ion batteries (Figure 31e). They design a novel 3D Bayesian CNN (BCNN) to quantify the uncertainty of binary segmentations. Inside the network, the uncertainty is measured in the weight space. The BCNN allows good interpretation and comprehensive uncertainty quantification in 3D segmentations, which outperforms the state-of-the-art Monte Carlo dropout technique. Establishing the credibility of these segmentations requires uncertainty quantification to identify problematic areas and where the confidence is low.
An interesting GAN-based application in the field of tomography images was recently published by Gayon-Lombardo et al.121 In this work, the authors developed a GAN trained with tomography images (workflow reported in Figure 32A), which was demonstrated to be able to reproduce (in a few seconds, once the model has been trained) electrode microstructures comparable to the experimental ones. Considering the high cost (in terms of time and resources) of obtaining experimentally trustable 3D microstructures (typically through FIB-SEM or tomography), such a kind of application could represent the first step of an important leapfrog in microstructure characterization and optimization. In addition, this approach allows getting electrode microstructures as big as desired (contrary to their experimental counterpart) and the authors demonstrated of being able to apply periodic boundary conditions, which is particularly relevant in the context of using these structures as input for electrochemical models. However, this approach requires 3D images (typically in the form of a series of 2D slices) to be trained. Those can be obtained either through imaging techniques or through physics-based modeling, but it is not always straightforward to access such structures. On the contrary, 2D images are easier to obtain experimentally. The same group, in the work published by Kench et al.,122 further improved their approach by developing sliceGAN, which is able to reproduce 3D microstructures from high-fidelity 2D images (Figure 32B).
Figure 32.

(A) Workflow of the GAN-based model proposed by Gayon-Lombardo et al.121 able to learn and reproduce 3D electrode microstructures. (B) Workflow of the GAN-based model developed by Kench et al.,122 unlocking the use of 2D images to build 3D electrode microstructures. (A) Figure reproduced with permission from ref (121). Copyright 2020 Springer. (B) Figure reproduced with permission from ref (122). Copyright 2021 Springer.
4.2.3. Degradation Detection
How the particle microstructure of a LIB electrode influences a potential thermal runaway can be investigated based on the structural changes observed in cracked particles. Statistically significant analysis necessitates a large database that can be obtained from tomographic 3D image data.66 A key goal would be to analyze which particles are more likely to crack and thus aggravate thermal runaway, as smaller particle sizes with higher specific surface area lead to more intense runaway.
Instead of manual visual inspection which is time-consuming and tedious even for a relatively small system, a supervised ML-based classifier, which detects particles that are the result of breakages and related fragments, can be both expeditious and have higher accuracy (Figure 33c).66 Such a ML-based classifier can be trained in a semisupervised manner so that relatively small numbers of labeled data can be used, lowering further the human effort during model building.
Figure 33.

(a) The four misclassified examples of micrographs with defects by the VGG19 fine-tuned model.275 (b) Overview of the model development. The following three classes of particle pairs are differentiated: BROKEN: The particle pair belonged to the same particle before it broke apart during the thermal runaway. WATERSHEDSEP: The particle pair corresponds to two touching particles in the tomographic image, which are split by the watershed transformation. PARTICLESEP: The particle pair consists of unrelated, separate particles, i.e., a pair which is neither BROKEN nor WATERSHEDSEP.66 (c) Detailed view on the gap between two voxelated particles. Steps for extracting the sample particle pairs using a graph to memorize the class labels. 3D rendering of a BROKEN particle pair.66 (a) Figure reproduced/adapted with permission from ref (275). Copyright 2020 Springer. (b, c) Figure reproduced with permission from ref (66). Copyright 2017 Elsevier.
Deep-learning-based computer vision methods can also help in evaluating the quality of LIB electrodes by automated detection of microstructural defects from light microscopy images. Going away from expert knowledge based on statistical image processing tools, where handcrafted-feature-based shallow learning techniques are not sufficiently discriminative, convolution-based deep learning can automatically learn and work with defect patterns that are not well consolidated once a large data set is provided (Figure 33b). Transfer learning methods can further improve the performance of these models and reduce data requirements, as shown by Badmos et al.275 using an automated/unsupervised workflow in the context of defect detection in LIB cells. Even if particularly promising, such an approach holds some limitations, as the risk of misclassification showed in Figure 33a, calling for further improvements.
The microstructure of a composite electrode determines how individual battery particles behave during the charge–discharge process, and the degree of particle detachment from carbon/binder correlates to capacity loss. Microstructural characterization of the composite electrode with required precision and reliability is challenging especially to obtain statistical relevance in complex, many-particle electrodes. ML models can perform such an identification and quantification task efficiently through a workflow approach once trained for data processing (Figure 34). ML-based large-scale, many-particle approaches provide unbiased characterization results that conventional image techniques cannot achieve due to the limited number of particles tracked.273 Such deep convolution-based methods are also better in identifying broken particles to the original one than feature-based ML methods.
Figure 34.

Over 650 unique particles of different size, shape, position, and degree of cracking were successfully identified and isolated from the imaging data in an automatic manner. (a) Workflow of the ML-based segmentation. (b) Comparison of conventional segmentation results and the machine-learning-assisted segmentation results for a few representative particles. Different colors denote different particle labels. (c) Schematic illustration of the herein developed ML model based on the Mask R-CNN for particle identification and segmentation. The scale bar in part a is 50 μm.273 Figures reproduced with permission from ref (273). Copyright 2020 Springer.
4.2.4. Hyperspectral Image Processing
Models for hyperspectral imaging [a technique that analyzes for each pixel a wide electrochemical spectrum instead of just assigning a single feature (as, for instance, red, green, or blue) to each pixel] are complex and usually hand coded based on a specific system and set of statistical techniques. For large-scale experimentation, one wants to automate those statistical operations so that processing across different materials and classes of spectroscopic techniques necessitates limited human effort. Key aspects of such an automated framework would be (i) an intelligent preprocessing of the data set, (ii) an automated and reliable extraction of spectral signatures and data labeling intended for supervised learning, (iii) a ML model training to identify labels in new data sets, and (iv) interoperability/reusability adjustments of an already trained model to be used in a completely different LIB specimen for inline real-time analytics.276 A range of techniques such as PCA, MCR-ALS, independent component analysis, partial least-squares discriminant analysis, voxel component analysis, and non-negative matrix factorization have been applied for the identification/clustering of significant spectral signatures, while MCR-ALS has been used specifically for batteries in conjunction with a NN classifier.276 Baliyan et al.277 showed that the analysis of hyperspectral Raman for LIB electrodes can be conducted in an automatic way with almost no human assistance. The NMF-ARD (non-negative matrix factorization automatic relevance determination) algorithm was well suited to automatically identifying components in the hyperspectral Raman data set (Figure 35). For the case of LIB electrodes, the interoperability of the NN model was found to be strongly consistent with major constituents (carbon and NMC). This approach could be used to evaluate the LIB electrode degradation by monitoring the retention coefficient.
Figure 35.

(a) Illustration of hyperspectral images (3D data cubes). The spatial information is collected in the X–Y plane, and the spectral information is represented in the Z-direction. Hierarchical cluster analysis (HCA) of the pristine data set. The clusters were assigned unique class labels depending on their spectral signature. Primarily three clusters were identified: (1) carbon, (2) NMC, (3) background. (b) Results from three types of analytics are compared for the 500_Out LIB sample: human, unsupervised, and supervised intelligence.277 (a, b) Figure adapted with permission from ref (277). Copyright 2019 Springer.
Hyperspectral methods can also be used with ML tools to identify new battery degradation mechanisms.278 Unsupervised clustering algorithms identify chemical signature clusters from large quantities of spatially resolved X-ray absorption near edge structure (XANES) data that are not from anticipated lithiation/delithiation but from side reactions through which the degradation mechanisms occur during battery cell operation.
4.3. Conclusions and Perspectives
In the last years, the development of most characterization techniques led to a tremendous enhancement in terms of both resolution and acquisition times. From one side, this unlocked the possibility of more precise and more insightful analysis; from the other side, it led to an exponential growth in terms of raw data generation, which cannot be analyzed anymore through classical data analysis only. This is due to the concomitant evolution of rapid (and sensitive) detectors and to the improvement of beam source in terms of brightness, coherence, and shape. Therefore, the new generation of instruments should be developed considering those aspects and optimizing the design, execution, processing, and data transfer. In addition, data scientists and analysts should be strongly involved in the integration of tools helping to manage large multidimensional data sets and to represent them using meaningful descriptors.
In this context, ML methods can be helpful for different purposes: (i) data treatment (e.g., image segmentation, reconstruction), (ii) data fitting (e.g., spectra analysis), and (iii) determining correlations between results obtained from different techniques. ML-assisted procedures are already employed in image segmentation and reconstruction,273,279 crack,66 and defect275 detection of electrode materials. Speeding up and automatizing important steps as image segmentation and reconstruction is not just a time savings for researchers, but it can also (and it is already) help(ing) in solving important challenges in the field, such as discriminating between AM, CBD, and pore phases in tomography images. In addition, the use of ML-based approaches can unlock the study of operando dynamic processes, for example, the evolution of microstructure during manufacturing280,281 or Li dendrite formation and growth.282,283
ML-assisted imaging brings the promise of assisting data acquisition and decision-making for complex and multimodal observations, which can allow a significant upgrade of the current experimental workflow (Figure 36). In the present workflow, data acquisition is made in a specific region of interest, whereas, in the future, it could be done in multiple zones using a multidimension detection mode, spatial resolution, and image magnification. Today, features selection is done through human eye and interpretation, while, in the near future, it is highly probable that features detection and multidimensional correlation will be carried out by AI/ML algorithms. Additionally, ML will likely assist the development of multidimensional models and simulations using as a starting point electrode structures obtained by imaging techniques.
Figure 36.

Schematic exhibiting present (green) and future (orange) workflows about conducting experiment, data acquisition, interpretation, and model extraction/simulation. The large and increasing amount of data generated using modern characterization techniques, new generation of detectors, and the emergence of AI/ML methods are likely to transform the way experiments are performed and data analyzed.
Another breakthrough that ML can bring in materials characterization is the generation of “fake” but highly reliable electrode meso- or microstructures through generative ML algorithms, as VAEs or GANs. These methods require being trained with previously obtained images, coming either from experimental imaging techniques, such as tomography, or FIB-SEM, or from 2D or 3D physics-based modeling, but, once trained, they can generate a whole spectrum of realistic electrode meso- or microstructures in seconds or minutes. The validity of these structures should be carefully assessed and compared to real ones to verify their exactitude, but the accuracy recently demonstrated by the group of Sam Cooper121,122 promises an important leapfrog in HT microstructure characterization and optimization.
At the industrial level, automatic robotic inspection systems for quality control can also be assisted by ML for defect classification and anomaly detection.284−286 Integrating CNN models would enable higher flexibility on the type of feature to be detected when compared to earlier machine vision mathematical models. One-class learning (OCL) and GAN models can also be implemented to mitigate inaccuracy issues caused by limited training data sets (e.g., data sets with not enough examples of material defects). In addition, strategies developed for metal crack detections or printing inspections are transferable to online inspection of battery electrode manufacturing. A short list of available industrial imaging software packages including ML solutions is given in ref (285).
5. Application to Battery Cell Diagnosis and Prognosis
The prediction of the battery performance and lifetime as well as the identification of the main sources of battery performance limitations and aging are major concerns while integrating batteries in applications, such as electric vehicles (EVs). They constitute the aspects in which ML has been applied the most, in comparison to the other domains described in this Review. Figure37 depicts a schematic of the ML methods employed in battery cell diagnosis and prognosis, their frequency and the nature of the data set used. In this section, we first recall the approaches that are typically used to characterize battery performance and aging in the engineering field (subsection 5.1). Then, we discuss applications of ML in performance and safety analysis (subsection 5.2), aging and remaining useful life (RUL) predictions (subsection 5.3), as well as online estimation (subsection 5.4). Finally, major conclusions are underlined and future trends are presented in subsection 5.5.
Figure 37.

Infographic on the ML methods recently applied to battery cell diagnosis and prognosis, including the corresponding nature (calculated vs experimental data) of the employed databases.
5.1. Overview
Nowadays, there is high interest in developing highly accurate aging models allowing earlier failure prediction, greater interpretability, and broader application to a wide range of cycling conditions. Well-trained ML techniques can potentially combine high accuracy and low computational cost, making it highly interesting for aging models and accurate predictions of battery lifetime.24
To ensure the reliability of LIBs over their entire service life, an accurate diagnosis in real time, based on its electrochemical characterization, is of paramount importance. To do so, different battery state parameters are considered. Among these, the battery state of charge (SOC), state of health (SOH), and RUL focus the major efforts from both industries and academics, particularly for automotive applications.287
The SOC of a LIB is defined as the percentage of remaining charge with respect to the fully charged condition. Accurate SOC estimation is essential to optimize operating strategies and balancing of battery cells in a battery pack. Extensive research efforts have been devoted to SOC estimation, based on electrochemical techniques. The Coulomb counting method is one of the most effective approaches to obtain the battery SOC. Alternatively, the battery open circuit voltage (OCV) is the base of many proposed SOC estimators. Furthermore, electrochemical impedance spectroscopy (EIS) can be used to determine it by means of electrochemical impedance models.288,289
The SOH reflects the current capability of the battery to store and supply energy relative to the one at the beginning of its life, which make it suitable to evaluate its degree of degradation. It can be quantified estimating the ratio of the actual cell capacity with respect to its initial capacity. This, together with the battery resistance, are the two parameters typically adopted to calculate the SOH of LIB.
The RUL, together with the SOH, is one of the main LIB parameters to evaluate its current health condition. It can be defined as the remaining load cycles (or time) until the battery reaches its end of life (EoL) or, alternatively, until its SOH reaches 0%.
The determination of the aforementioned parameters (SOC, SOH, RUL) is based on electrochemical characterization techniques. Thus, the recording of charge and discharge voltage vs specific capacity curves is of paramount importance. In academia, cycling is usually (but not always)287 carried out at constant current, despite testing protocols more similar to real life applications (as constant power) being more preferable. Another widely used diagnostic tool is EIS, which records the response (typically current) to a small sinusoidal perturbation (typically voltage) at varying frequencies. This technique gives information on the impedance of the cell at different time scales, and it can also provide information about the possible degradation mechanisms of the battery. Alternatively, current pulses are also used to determine the cell resistance and its evolution along the cell usage.290
With regard to the aging prediction, over the past decade, extensive efforts were carried out to achieve battery lifetime predictions from off-line experimental analysis. Here, off-line (or offline) estimation refers to those algorithms using previously collected data, while on-line (or online) estimation refers to algorithms embedded in the battery management system and using data collected along the battery operation. Bloom et al.291 and Broussely et al.292 performed early works based on semiempirical models to predict power and capacity losses. Since then, many authors have proposed physical and semiempirical models accounting for diverse degradation mechanisms, such as the SEI growth,293,294 lithium plating,295,296 active material loss,297,298 and impedance increase.299−301 These physics-based models have successfully described cell capacity retention and impedance increase, while providing a full understanding on the limiting mechanisms under relevant operating conditions. However, the development of a fully comprehensive model remains challenging, given the variety of degradation modes and their coupling to thermal302,303 and mechanical293,304 heterogeneities within a cell,295,305,306 which lead to high computational cost. The prediction of RUL is another topic of interest. The online estimation approaches typically rely on electrochemical,307−310 semiempirical,311,312 and equivalent circuit models313,314 and some recursive observers, such as the Kalman filtering315,316 and particle filtering (PF).317 These approaches aim to capture and update the battery parameters (as capacity and SOC) based on the analysis of the data obtained along cycling. Other specialized diagnostic measurements, such as Coulombic efficiency318,319 and EIS,320−322 are also used for lifetime estimation. It is worth mentioning that the main constraints of such approaches are the difficulty to estimate the parameters for equivalent circuit-based models and the inherent open-loop nature of semiempirical models, which compromises their generalization and transferability, particularly for long-term predictions.
The implementation of ML methods in the diagnosis and prognosis of LIBs has been recently addressed in the literature. In the following, we intend to highlight the main scientific articles according to their different purposes, as lifetime prediction, performance, online estimation, and safety. It is interesting to highlight that the vast majority of the articles related to ML applied to diagnosis and prognosis are focused on online estimation (48%) or lifetime prediction (44%), while the ones dealing with performance and safety are a minority (both 4%), as shown in Figure S1, giving an indication of the battery community habits and interests in this field of research.
5.2. Performance and Safety Prediction
This subsection describes the most relevant articles implementing ML for cell performance prediction and safety.
Regarding cell performance prediction, Tang et al.323 proposed a model based on the ELM method to predict the evolution of battery temperature, voltage, and power. The predicted values were then compared to the ones observed experimentally. It was also proposed to replace the function of activation by a set of models to further enhance the long-term prediction performance. The implementation of such an approach allowed the improvement of the ELM model in terms of current at different temperatures.
Battery safety is also crucial for any LIB application and of major concern for EVs. The main safety hazard of LIBs is linked to exothermic phenomena; that is why several studies are focused on analyzing the battery thermal behavior.
Li et al.324 proposed a powerful tool based on ML to develop the safety envelope of lithium-ion pouch battery cells (Figure 38) and showed its possible applications in the EV and battery industries. A total of 2672 numerical simulations were conducted based on a three-dimensional finite element (FE) model capable to predict accurately both the force–displacement response and the fractured geometry of the lithium-ion pouch battery cell during indentations. Two indentation tests at the cell level were carried out under the quasi-static loading condition to validate the FE model. The fracture of the separator was used as a criterion of electric short-circuit. The results obtained though the FE model were then used to train a classification and a regression ML algorithm. The former made a quick judgment on whether the given indenter and loading condition could lead to an electric short circuit, and the latter predicted quantitatively the intrusion, force, and kinetic energy of the indenter to cause this short circuit. Three different ML algorithms, namely DT, SVM, and ANN, were used to develop classification models, while the last two were used to develop regression ones.
Figure 38.

Flow-chart of the data-driven safety envelope using the ML algorithm.324 Figure adapted with permission from ref (324). Copyright 2019 Elsevier.
5.3. Aging and Health Prediction
Thanks to the rise of computational power, ML has emerged as a powerful method for RUL predictions based on a large amount of data. In this sense, several data sets have been created and stored in repositories for model training and validation purposes. Table S4 shows the characteristics of the main data sets that have been published in the scientific literature. It can be clearly seen that the most used data set is the “battery data set” from NASA Ames Research Center (ca. 60% of the references included in the table). In this context, the most used data inputs are based on capacity evolution along cycling. The rest of the data sets reported in Table S4 have been used in a more particular sense and are generally based on the testing of a variable number of commercial cells, up to 138, under cycling conditions. It is worth mentioning that only a required data input, associated with a data set generated by the testing of 12 commercial graphite | LCO at different temperature and discharge rates, is based on EIS data. In addition, all data are not available, which restricts their reutilization by other potential users.
Furthermore, several kinds of ML algorithms have been used, including ANN,325−328 SVM,325,329 relevance vector machine (RVM),330 and probability estimation, such as GPR,330−333 among others, bringing new knowledge and insight and leading to a better understanding of battery performance and failure processes. Based on the analyzed articles, probability estimation approaches constitute the most used methods (27%), followed by support vector and NN families (both 23%), linear approaches (14%), ensemble learning (9%), and DT-based algorithms (4%).
Zhu et al.334 used a set of DT algorithms to analyze the lifetime of batteries. Based on a database consisting of 138 sets of data recorded on commercial LFP | graphite A123 APR18650M1A cells (1.1 Ah and nominal voltage 3.3 V), the model classifies with an accuracy of 95.2% whether the battery can maintain above 80% initial capacity after 550 cycles. From the selected data set, several features of the initial two cycles—the charge/discharge capacity, the internal resistance, and the cell temperature—were identified. Through the interpretation of DT, it was found that the discharge capacity difference between the initial two cycles was the most important factor for the battery life feature. Zhu et al. also compared the DT predicted results with other supervised algorithms, such as neighbors, GP, and SVM, and found that the DT algorithm achieved the highest accuracy.
As described in section 1, ML models can also perform a regression to provide quantitative output(s). In this regard, Severson et al.65 tackled the challenge of developing linear models—elastic net335—that accurately predict the cycle life of commercial lithium iron phosphate (LFP) | graphite cells using early cycle data, with no prior knowledge on the degradation mechanisms (Figure 39). Specifically, a data set of 124 cells with lifetime ranging from 150 to 2300 cycles (i.e., the number of cycles until 80% of nominal capacity was attained) and containing 72 different fast-charging conditions was created. The developed feature-based model predicted cell cycle life with errors of 9.1%, using only data from the first 100 cycles. Interestingly, during these cycles, most batteries did not exhibit yet significant capacity degradation, showing the capability of ML to identify trends not observable when using raw experimental data only. Considering that experiments aiming to determine battery cycle life can last months or years505 and that many different conditions (different manufacturing procedures, charge/discharge protocols, etc.) should be tested, this approach can lead to a significant gain in time and resources. Furthermore, using the data from the first five cycles only, they demonstrated classification into low and high lifetime achieving a misclassification test error of 4.9%. These results clearly illustrate the power of combining experimental data with data-driven modeling to predict the behavior of complex systems far into the future.
Figure 39.

Schematic representation of the approach used by Severson et al.65 allowing to predict battery cycle life from only its first ∼100 cycles. Figure adapted with permission from ref (65). Copyright 2019 Springer.
More recently, Attia et al.336 overcame the results presented by Severson et al.65 by predicting the battery cycle life using only the first 20–50 cycles, while achieving comparable or improved accuracy. This was achieved by improving features engineering and applying more advanced ML methods. In particular, features capturing voltage data were selected carefully in order to create a successful predictive model of cell lifetime, applying three different regression models: elastic net, RF regression, and AdaBoost (“adaptive boosting”) regression. The results showed that RF regression enabled achieving high accuracy at low cycle number, outperforming regularized linear regression.
In view of the key challenge to reduce both the number and the duration of the experiments required for maximizing battery lifetime,337 Attia et al.338 developed and demonstrated a closed loop optimization (CLO) ML methodology, depicted in Figure 40, to efficiently optimize a parameter space specifying the current and voltage profiles of six-step, 10 min fast-charging protocols. In order to reduce the optimization cost, they combined an early prediction model based on an elastic net (as that implemented by Severson et al.65) to reduce the time per experiment, by predicting the final cycle life using data from the first 100 cycles and a BO algorithm.339,340
Figure 40.

(A) Schematic of the CLO system developed by Attia et al.338 (B) Example of the result showing the optimization time needed for different CLO protocols. Reprinted from Attia et al.337,338 Figure reproduced with permission from ref (338). Copyright 2020 Nature Publishing Group.
This CLO method reduces the required optimization time compared to the baseline optimization approaches. For instance, a procedure without early outcome prediction that simply selects protocols randomly for testing obtains a competitive performance level after about 7700 battery hours of test. To achieve a similar level of performance, CLO with both early outcome prediction and BO algorithm only requires 500 battery hours of testing.
SVM-based algorithms have also become very popular for the estimation of the health of batteries and RUL prediction. Gao et al.329 proposed a MSVM based on polynomial and radial basis kernel functions to predict battery RUL. Moreover, a PSO algorithm was used to optimize the kernel parameters, the penalty factor, and the weight coefficient of the MSVM model. It was observed that, thanks to the PSO optimization, not only do the model prediction accuracy and generalization ability increase but also the computational cost associated with the training process (performed using the NASA battery data set341) decreases. In a similar way, Qin et al.342 applied the PSO to obtain the parameters of the SVR kernel. This model can grasp the global degradation trend without focusing on local fluctuations, and it can provide satisfactory results in terms of RUL estimation. Wei et al.343 proposed PF and SVR models to predict the RUL of LIBs. Particularly, they used SVR to simulate a battery aging, while employing PF to optimize the impedance degradation parameters, which allowed them to get accurate RUL predictions. Dong et al.344 presented a similar method for battery SOH monitoring. A SVR-PF algorithm was implemented in the research to improve the standard PF against the degeneracy phenomenon. (In the context of the PF algorithm, the condition degeneracy phenomenon refers to the fact that, after a few iterations, some of the particle weights will tend toward zero. This implies that a large computational effort is devoted to update particles whose contribution is almost zero.) The RUL prediction was based on the SOH monitoring results, and the percentage of nominal capacity was used to represent the battery SOH. Wang et al.345 developed a new SVR-based battery capacity degradation model to estimate the battery aging performance. In this case, an artificial bee colony (ABC) algorithm was used to optimize SVR parameters and facilitate the RUL prediction of LIBs. The model was trained and tested by using the first batch of LIB degradation data sets from NASA Prognostics Center of Excellence PCoE,341 achieving accurate and stable RUL predictions. Specifically, the root-mean-square errors (RMSEs) of the ABC-SVR method were less than 0.05, indicating that the proposed model can accurately predict the RUL of LIBs.
The ANN method has been demonstrated to be a good candidate to correlate nonlinear dynamic problems.346 Zhou et al.325 presented a cycle life forecast method (applied to a lithium-ion polymer type battery) without requirements of contact measurement devices and long-time testing, by combining the data coming from infrared thermography and two different supervised learning techniques, ANN and SVM. Infrared images were captured at 1 frame/min during a period of 70 min of charging, followed by 60 min of discharging for 410 cycles. The surface temperature profiles during either charging or discharging were used as input for the ANN and SVM models. The obtained results demonstrated that the arising ANN model could estimate the current cycle life of the studied cell with an error <10% by using 10 min of testing time. The accuracy of SVM-based forecast models was similar to that of ANN but generally required a larger testing time.
Choi et al.326 developed a ML model exploiting multichannel charging profiles of voltage (V), current (I), and surface temperature of lithium-ion cell (T) for predicting LIB capacity, using a data set obtained from NASA. In particular, they used NN, CNN, and LSTM algorithms, demonstrating that a wide spectrum of data improved substantially the estimation accuracy. Figure 41 depicts an overview of the proposed framework for estimating the battery capacity, which consists of three steps: data preprocessing, training, and estimation. Specifically, in the preprocessing step, anomalous data is removed by applying data cleaning and min–max normalization. Then, the data set is divided into training, validation, and test sets. In the second step, training and validation sets are utilized to select a proper model based on FNN, CNN, and LSTM, respectively. In the third step, the battery capacity estimation and evaluation of the performance of the proposed methods is done, using capacity estimation models that are determined in the previous step.
Figure 41.

Overall framework of the proposed capacity estimation by Choi et al.326 Figure reproduced with permission from ref (326). Copyright 2019 IEEE.
According to the obtained results, between the benchmarked ML methods, LSTM showed the best accuracy, followed by FNN and CNN.
Ren et al.327 proposed an integrated DNN approach, called autoencoder-DNN (ADNN), for RUL prediction of multiple LIBs, by integrating autoencoder within DNN. A 21-dimensional feature extraction method with autoencoder model was built to represent the battery health degradation, while the DNN-based RUL prediction model was trained for multibattery remaining cycle life estimation. The proposed approach was applied to a data set of LIB cycle life from NASA, and the experimental results showed the effectiveness of the proposed approach, as the RUL prediction curve was in good agreement with the observed data, obtaining values of 11.80 and 88.20% for RMSE and accuracy, respectively.
The implementation of a RNN is very well-established in many fields, like in battery performance predictions, where Zhou et al.347 used a temporal convolutional network (TCN) model based on causal convolution architecture to predict the LIBs SOH and RUL with capacity as the index. Specifically, after many experiments and analysis, it was observed that the TCN model combined the ability to capture local regeneration phenomena and higher accuracy and robustness, compared with LSTM, gated recurrent unit (GRU), and CNN models, in terms of SOH monitoring and RUL prediction.
Kwon et al.348 tested different ML algorithms applied to various experimental analyses on 20 Ah NMC-based LIBs with different ratios of Ni, Co, and Mn (specifically, 5:2:3 and 6:2:2). An accelerated deterioration test was carried out by applying a constant current of 80 A (corresponding to a C-rate of 4 C), and the differential capacity curves were analyzed under varying aging conditions. The impedance features for a given SOC and deterioration level were analyzed through EIS characterizations. Different ML algorithms, such as MLR and RNN, were benchmarked with the final goal of estimating the RUL of the NMC-based LIBs. In general, the estimation performance provided with the MLR model was poor, except for NMC532 at 25 °C at which the learning data was relatively linear; however, in the case of using the RNN, the obtained error was lower than 7%, predicting the RUL of all of the batteries.
Similarly, Liu et al.349 used an adaptive recurrent neural network (ARNN) algorithm for the state prediction. The ARNN algorithm used the recurrent Levenberg–Marquardt method to rectify the weights of the RNN architecture, which allowed satisfying results to be reached in terms of LIB RUL estimation. The data used in this study were obtained from Gen 2 18650-size lithium-ion cells that were tested at 60% SOC and temperatures of 25 and 45 °C.350 The results of Liu’s investigation showed that the ARNN technique could effectively learn system states from a limited number of measurements to update the data-driven nonlinear prediction model. In fact, it outperforms the classical RNN and the recurrent neural fuzzy system RNF in battery RUL predictions.351
ML methods based on Bayesian theory were also applied in the field of LIB aging predictions. Ng et al.352 proposed a NB model for lifetime prediction under different conditions. They showed that, under constant discharge environments, the RUL of LIBs can be predicted with the NB model under different operating conditions, in a stable and competitive manner with respect to other ML methods, like SVM. In the same way, Cheng et al.353 proposed a method based on functional PCA (FPCA) and Bayesian theory for RUL prediction of LIBs. FPCA was used to construct a LIB degradation model and the Bayesian model allowed to update/optimize the FPCA hyperparameters to carry out the LIB RUL forecast.
The model migration method, whose basic idea is illustrated in Figure 42, was initially developed and demonstrated by Lu et al.354 in 2008 to reduce experimental efforts when modeling similar processes.
Figure 42.

Block diagram of the model migration by ref (355). Figure reproduced with permission from ref (355). Copyright 2009 Wiley.
The idea behind such a model is that, if an old process, also known as the base process, has been modeled carefully with a sufficient amount of data, then it can be integrated into a new model to describe a similar process in which only few data are available. In other words, a ML model built for the old process would be applied to the new ones by using just a few extra data. This method was generalized for the case in which process attribute values may be unknown and in which the concept of process similarity was introduced and classified.355 Tang et al.317 applied such a methodology to predict the battery aging evolution and RUL with the minimum possible experimental requirements. Accelerated aging tests under different stress factors were designed to build the data set, while the normal-speed aging process was considered as the new process to generate a few data for training the new model. The model hyperparameters were selected by combining nonlinear least-squares and BMC methods. The proposed prediction algorithm was validated against a large number of experiments conducted on three types of commercial LIB cells.
GPR models, deriving from the Bayesian framework, have been widely applied to prognostic problems due to their advantages of being non-parametric and probabilistic, as described by Li et al.25 The expression of a non-parametric model is naturally adapted to the complexity of data. Therefore, this type of model has the advantage of being more flexible than the parametric ones. The Bayesian approach allows the GPR to directly incorporate the uncertainty estimations into predictions, enabling the model to acknowledge the varying probabilities of a range of possible future health values, rather than just giving a single predicted value. In addition, the structure of the GPR is quite simple, as its performance is dictated by a mean function and a covariance function. Peng et al.356 developed a hybrid data-driven approach to predict battery capacities, combining the wavelet de-noising approach and the GPR. This method can remove effectively the noise from useful data, enhancing the prediction accuracy of the model as a whole. Furthermore, the key features are also distilled, which guarantees the significance of de-noise data. The proposed method is formulated with the hybrid Gaussian process function regression (HGPFR) model, and the hyperparameters are optimized by the maximization of the log-likelihood method. Based on the voltage curve registered at constant current and historical capacity data, Richardson et al.331 proposed the conventional covariance-function-based GPR models to predict battery cyclic capacities and RUL. The authors also highlighted the importance of selecting the correct kernel function and the advantages of using compound kernel functions compared to the other ones they benchmarked.
Furthermore, Yang et al.330 applied the GPR technique to estimate the battery SOH, constructing four input features from the constant current–constant voltage charging curves. The gray relational analysis method was applied to analyze the degree of correlation between the selected features and SOH. Covariance function design and the similarity measurement of input variables were modified to improve the SOH estimation accuracy and to be adapted to the case of multidimensional input. Several aging data from the NASA data repository341 were used for demonstrating the prediction accuracy of the proposed method.
All of the publications discussed above strongly support the effectiveness of the GPR techniques in battery cyclic capacity predictions, also considering the added uncertainty quantification offered by such a kind of approach, which is typically missing by using other ML techniques. Nevertheless, most studies fit the GPR-based models to the aging data obtained under similar cyclic conditions, ignoring different cases of stress factors, such as temperature and depth-of-discharge (DOD) level. In this regard, Liu et al.332 presented a novel data-driven approach for predicting the cyclic capacity of the 21 Ah NMC | graphite pouch batteries under various temperature and DOD operational conditions and by providing the corresponding uncertainty quantification. The authors proposed two modified GPR models to study the underlying relationship among degraded battery capacity, cyclic temperatures, and DODs: “Model A” is the one that modified the basic SE kernel with the automatic relevance determination (ARD) structure, while “model B” considered the electrochemical and empirical elements of the battery aging. The related components within a kernel function were optimized separately to reflect all of the model inputs, including the operating conditions. Through coupling the Arrhenius law and the polynomial equation into a compositional kernel within GPR, the authors demonstrated that “model B” was reliable in predicting the capacity degradation and quantifying its associated uncertainty, considering various cycling conditions.
Features derived from the charging and discharging curves are by far the most commonly used inputs in these models.333,357−361 Compared with the usual current–voltage data, EIS provides the impedance over a wide range of frequencies by measuring the current response to a voltage perturbation, or vice versa. Zhang et al.362 showed that GPR can also accurately estimate the capacity and RUL by using the EIS spectrum, being key indicators of the SOH of a battery. The developed model was trained by using over 20,000 EIS spectra of commercial LIBs (LCO | graphite), and it was capable of estimating the capacity and RUL of batteries, cycled at three constant temperatures, and at any stage of its life from a single impedance measurement.
5.4. Online Estimation
Research on battery SOX (either SOC, SOH, or SOT) monitoring and prediction is rather intensive, and a relevant amount of estimation models/techniques have been reviewed so far in the scientific literature.26,363 Currently, these methods are grouped into two categories: model-based and data-driven. The model-based methods mainly include the electrochemical and equivalent circuit models.308,364−366 The data-driven models are based on the analysis of the data about a specific system, and this approach includes a mainly linear approach, NN family, ensemble learning, support-vector-based, probability estimation, and DT-based. Furthermore, as shown in Table S5, several data sets have been created and stored in repositories for model training and validations purposes. More than 30% of references included in Table S5 used the “battery data set” from NASA Ames Prognostics Data Repository, with the capacity fade being the required data input. It is worth mentioning that only this data set is really available.
From the relevant scientific articles found in the literature (applied to online estimation), the ones based on support-vector-based models account for 37% of the total, followed by the neural network family (26%), probability-estimation-based models (21%), and ensemble learning (11%). Almost all of the works considered above are based on supervised ML, while only 5% used unsupervised ML models. Lastly, so far linear approaches and DT-based ML models have not been implemented yet for online estimation applications.
It is clear that SVM is nowadays one of the most used ML algorithms for the online estimation of SOH and RUL. Patil et al.367 proposed a real-time RUL estimation method for LIBs, based on the SVM algorithms to accomplish both classification and regression. The proposed method used a two-stage process: in the first stage, a coarse RUL is estimated using a classification technique, while, in the second stage, a regression algorithm is used to estimate quantitatively the RUL. The proposed approach reduces the number of input parameters set to a minimal set of critical features and enables the regression to be much accurate. Particularly, the training was performed by considering different working conditions of LIB cycles sourced from the publicly available repository from the Prognostics Center of Excellence (PCoE) at Ames Research Center (NASA)341 and extracting the key features from the voltage and temperature curves. Klass et al.368 compared the SOH that was determined in two different procedures, as shown in Figure 43. The conventional procedure, which serves as a validation, consists of the derivation of performance values from direct measurements with standard performance tests. The alternative procedure relies on the SOH estimation method from Klass et al.,369 in which a two-step procedure of SVM training and virtual tests is applied to battery data generated with a typical EV current profile. In a first step, a SVM is trained with current, temperature, and SOC as input and the cell voltage as output. This SVM model is then used as a voltage look-up table for hypothetical current/temperature/SOC-input, predicting the results of virtual tests, which can subsequently be used to derive the cell resistance and capacity as in real standard performance tests.
Figure 43.

Schematic overview of the scope of the work of Klass et al.368 Performance measures of an EV battery cell are determined and compared from real tests as well as from EV battery usage data via SVM-based models and virtual tests (I = current, U = voltage, T = temperature, SOC = state-of-charge, m = measured, c = calculated, h = hypothetical, e = estimated). Figure reproduced with permission from ref (368). Copyright 2014 Elsevier.
The SVM can also be applied to regression problems, although regression needs inherently bigger data sets than classification. In this context, Nuhic et al.370 used SVR, which was trained to learn/predict the degradation behavior of LIB cells. The validation of such a model showed very satisfactory results in the diagnosis of the cell state. It was also shown that the developed estimation method could also be used for simple RUL prognosis. Dong et al.344 reported a SVR approach able to predict the RUL by online monitoring of SOH, where the percentage of nominal capacity was used to represent the battery SOH. Weng et al.358 proposed a battery SOH monitoring scheme based on partially charging data. Through the analysis of battery aging cycle data, a robust signature associated with the battery aging was identified through incremental capacity analysis (ICA). The use of SVR provided the accurate results with moderate computational load. These authors showed that the SVR model, built upon the data from one single cell, was able to predict the capacity fading of seven other cells within 1% error bound. In addition, they extended the ICA-based SOH monitoring approach from single cells to battery modules,359 consisting of battery cells with various aging conditions. In order to achieve on-board implementation, an incremental capacity (IC) peak tracking approach based on SVR was proposed. (The ICA can be defined as a method used to investigate the capacity state of health of batteries by tracking the charging/discharging capacity over the battery voltage. Aging mechanisms can be extracted from the peak amplitude and position of the arising curve.) Recently, Guo et al.371 extracted relevant health features from the charging voltage, current, and temperature curves. The nine extracted features with the highest correlation were selected, and their dimensionality was reduced through PCA. The remaining capacity estimation was performed by RVM. The validation of different working conditions was made by taking into account six battery data sets, from the NASA Prognostics Center of Excellence.341 The results proved the high efficiency and robustness of the proposed method.
Yang et al.372 proposed a novel state-of-health estimation for LIBs based on statistical knowledge. An improved battery model, which combines the open-circuit-voltage modeling and the Thevenin equivalent circuit model, was proposed to improve accuracy and to study the relation between internal parameters and states of the battery. The joint extended Kalman filter-recursive-least-squares algorithm was employed to estimate battery SOC and to identify the model parameters and open-circuit voltage simultaneously. Then, a PSO-least square support vector regression (LSSVR) approach was employed to give a reliable state-of-health estimation with good generalization ability. In order to verify the accuracy of the proposed method, static and dynamic current profile tests were carried out on lithium iron phosphate batteries at different aging levels. The experimental results indicated that the proposed method was suitable for state-of-health estimation given its high accuracy.
On the other hand, the GPR method is also an emerging ML approach in the field. As discussed in section 1, it is applicable to complex regression problems due to their high dimensionality, small available data sets, and nonlinearity.373 Since the battery aging is a complex nonlinear process, the GPR is then of interest for LIB SOH estimation. However, up to now, only a limited number of works dealt with the GPR model devoted to SOH estimation and prediction. Yang et al.330 extracted four features from the charging curve, analyzed the correlation degree with gray correlation,374 and predicted the SOH by means of a GPR model. Several aging data from the NASA data repository were used to demonstrate the accuracy and robustness of the developed model. Liu et al.375 also used the GPR method to perform SOH prediction and described its associated uncertainty. According to the experimental results presented in their work, the SOH prediction accuracy was not as high as desired. On the other hand, Peikun et al.376 demonstrated that GPs effectively exploited correlations between data from different cells, showing accurate SOH estimations. In particular, along this work, a multi-island genetic algorithm-GPR (MIGA-GPR) model was used to study the relationship between battery cell charge performance and SOH.
Furthermore, Richardson et al.333,377 presented a GPR model for in situ capacity estimation (GP-ICE), which estimates battery capacity using voltage measurements over short periods of galvanostatic operation. The authors combined offline and online study, as it can be seen in the flowchart of Figure 44.
Figure 44.

GP-ICE flow diagram by Richardson et al.377 The data used in these plots is only for illustration purposes. Figure reproduced with the authors permission from ref (377).
The proposed GP-ICE does not rely on interpreting the voltage–time data in terms of IC or differential voltage (DV) curves; instead, it operates directly on the voltage vs time data itself. This fact overcomes the need to differentiate the voltage–time data (a process which amplifies measurement noise) and the requirement that the range of voltage measurements encompasses the peaks in the IC/DV curves. GP-ICE was applied in this case to two data sets, consisting of 8 and 20 cells, respectively. In each case, only 10 s of galvanostatic operation, within certain voltage ranges, enabled capacity estimations with approximately 2–3% RMSE.
Hu et al.378 proposed a data-driven forecasting model by combining sample entropy and sparse Bayesian predictive modeling, which was used to describe the correspondence between the voltage-sequence sample entropy and the battery capacity with an average error less than 1.2% at each temperature.
ML algorithms based on NNs, and particularly DNNs, can predict nonlinear problem performance. WNN is one of the most widely used networks in the field, which allows good prediction performance to be achieved.379 Dong et al.380 used a WNN-based battery model and PF to estimate the state of energy. Specifically, the WNN-based battery model was used to simulate the entire dynamic electrical characteristics of batteries. The temperature and discharge rate were also considered to improve the model accuracy. Besides, in order to suppress the noise of the measured current and voltage, a PF estimator was used to estimate the cell state of energy. Experimental results of LiFePO4 batteries indicated that the WNN-based battery model simulated battery dynamics robustly with high accuracy and that the estimation value based on the PF estimator converged to the real state of energy within an error of ±4%.
NN is broadly used as a ML method in the statistical model because of its facile realization and its ability of developing nonlinear models.381 Wu et al.382 analyzed the battery terminal voltage curves at different cycles during charging and proposed an online method using NN and importance sampling to estimate the RUL of LIBs. A three-layer NN consisting of an input layer, one hidden layer, and an output layer was proposed. Moreover, a Levenberg–Marquardt-based gradient descent back-propagation algorithm was used to train the NN model. The mean absolute error and mean-square error of Wu’s proposed method in the prediction of the RUL was 29.4218 and 1.6184 × 10³, respectively, in about 2000 cycles.
The state of temperature (SOT) estimation has also been investigated through various ML techniques. According to the mechanism analysis, battery temperatures can be quantitatively calculated by multiphysics models, which was the approach followed by Feng et al.,383 who developed an electrochemical-thermal-neural-network (ETNN) to estimate the battery SOC and SOT for a wide range of temperature and current conditions (Figure 45).
Figure 45.

(a) Electrochemical thermal NN (ETNN) model structure and (b) NN detail by Feng et al.383 (a, b) Figure reproduced with permission from ref (383). Copyright 2020 Elsevier.
A simplified single particle model (SPM) and a lumped thermal model were used as submodels of the ETNN to predict the core temperature and to provide an approximate terminal voltage. A NN was later incorporated to enhance the performance of the submodels. Figure 45b illustrates the architecture of the NN used, having two hidden layers with five nodes each. According to the extensive experiments performed, the ETNN model was able to accurately estimate battery voltage and core temperature under ambient temperatures of −10–40 °C at a discharge rate of 10 C. Afterward, an unscented Kalman filter was integrated within the ETNN to achieve reliable coestimation of SOC and SOT.
In recent years, most of the developed NN models have mainly been based on the LSTM approach and have proven to be excellent for battery cell prediction. For instance, Qu et al.328 implemented a NN-based method that combined a LSTM network with PSO (that Qu et al. named PA-LSTM) for RUL prediction and SOH monitoring of LIBs, as illustrated in Figure 46.
Figure 46.

Architecture of the LSTM cell by Qu et al.328 Figure reproduced with permission from ref (328). Copyright 2019 IEEE.
Before predicting the RUL of LIBs, the authors used the complete ensemble empirical mode decomposition with adaptive noise (CEEMDAN) method to reduce the noise of the raw data, which can lead to improved prediction accuracy. A real-life cycle data set of LIBs from NASA was used to evaluate the proposed method and to show that this method had higher accuracy, with respect to other methods, such as RNN, LSTM, and RVM, where the average error and RMSE values of LSTM, RNN, RVM, and PA-LSTM on different data sets and different start cycles were −19, −11, −15, and −3 and 0.0549, 0.0775, 0.0554, and 0.0362, in that order.
Zhang et al.384 employed the LSTM-RNN to predict the RUL of LIBs. The LSTM-RNN was adaptively optimized using the resilient mean-square back-propagation method, and a dropout technique was used to avoid overfitting. The developed LSTM-RNN model was able to capture the underlying long-term dependencies among the degraded capacities, allowing construction of an explicitly capacity-oriented RUL predictor, whose long-term learning performance outperforms the ones of SVM, the PF, and the simple RNN models. The developed LSTM-RNN predictor includes four main components: a LSTM-NN architecture, a network parameter optimization using the RMSprop method, a drop-out technique to prevent the NN from overfitting, and a Monte Carlo (MC) simulator to generate prediction uncertainties. In a similar way, You et al.385 proposed a LSTM-RNN, where the LSTM block embeds multiple gated into the hidden nodes of the RNN, which allows keeping the information for a long period. A data set of seventy 18650 LIB cells, cycled partially and dynamically with more than 10 driving profiles to mimic realistic EV scenarios, was used to validate their ML framework, demonstrating that it was highly effective in dynamic environments, with an average error of ≤0.0765 Ah (2.46%) in all of the experimental settings tested.
In a recent study, Chen et al.386 used a novel end-to-end unsupervised ML approach for a more effective real-time prediction of battery life and failure. This model enabled unsupervised real-time automatic extraction of latent physical factors that control the performance of Na-ion batteries, classifying them as having good or bad cycling performance, using only the voltage profile of the first cycle. For this purpose, 62 Na-ion batteries from 14 different kinds of layered NaTMO2 cathode materials with O3 oxygen stacking were tested for 16 cycles. The automatically extracted features by PCA were then used to build a ML classifier, with more than 80% classification accuracy of good or bad cycling performance for batteries with up to 50 cycles. In addition, this model was also able to monitor the safety of Li-metal battery systems by giving warnings when the battery was approaching failure. In particular, considering the data coming from the voltage profiles of 87 Li-metal anode battery tests with a cycle life longer than 100 before the failure, and using the developed autoencoder NN, the model provided automatic anomaly warnings close to battery failures (see Figure 47).
Figure 47.
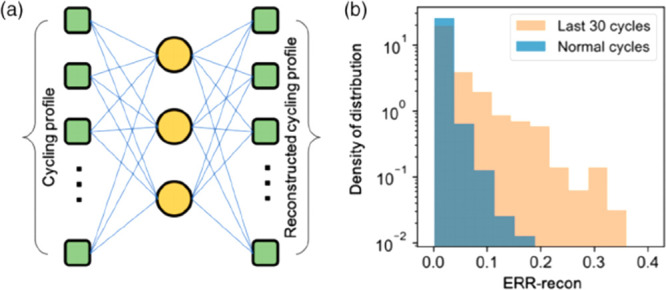
(a) Autoencoder anomaly detector for failure prediction: schematics of an autoencoder NN and (b) cycles before the last 30 and within the last 30 show distinct features indicated by the reconstruction error of the autoencoder.386 (a, b) Figure reproduced with permission from ref (386). Copyright 2019 Wiley.
Shen et al.387 proposed an automatized learning process using a deep learning model. This avoids the manual feature extraction that relies heavily on human labor, with the intrinsic risk of dropping useful information in the charge data. Shen presented a deep learning method based on a deep convolutional neural network (DCNN, i.e., a CNN with more than one hidden layer) for cell-level capacity estimation based on voltage, current, and charge capacity measurements during a partial charge cycle. The unique features of DCNN included the local connectivity and shared weights, which enabled the model to accurately estimate the battery capacity using the measurements performed during charge. To test the performance of the proposed model, 10-year daily cycling data from eight LIB cells and half-year cycling data from twenty 18650 Li-ion cells were used. Compared to other ML methods, such as shallow NNs and RVM, the proposed deep learning method leads to higher accuracy and robustness for the online estimation of LIB capacity.
On the other hand, ensemble learning is a ML method that groups multiple base learners to achieve better learning than a single learner. In other words, the effect of model training is equivalent to multiple decision makers working together on the same problem. For instance, Li et al.388 used a NN as a base learner to form differential data samples through the AdaBoost.RT algorithm. Then, differentiated data samples generated by different weight values were used to train base learners and to form a series of differentiated base learners. Finally, the outputs of the base learner were synthesized by a certain method, and a new strong learner was generated.
Naha et al.389 developed an algorithm for online detection of the mechanical abuse induced internal short circuit (ISC) in the smartphone LIBs using a RF classifier. The authors built an Android application to log the battery charge–discharge data inside the smartphones, allowing transfer of the recorded data to a computer for further processing. First, a set of eight features was extracted in terms of current and voltage during cycle for classification purposes. A total of 290 faulty cycles of different magnitudes of external short (150–500 Ω) and 53 healthy cycles were used to train the RF classifier and generate the confusion matrices. The performance of the classifier for the training data for a SOC cutoff of 5% was found to be normally normal = 100%, faulty in fault = 99.66%, false alarm = 0.0%, and miss detection = 0.34%. A total of 129 faulty (ISC induced by mechanical abuse) and 148 healthy charge–discharge cycles from five different batteries were used for testing. The proposed methodology was tested successfully with 100% normal in normal and 98.45% fault in fault accuracy for the complete discharge cases (end of discharge SOC = 5%).
The MARS approach has been recently applied in many studies,390−397 leading to accurate and precise prediction models based on statistical learning, as, for instance, ANN used in a time series, i.e., a series of data points indexed in time. MARS is a multivariate non-parametric regression analysis technique that was introduced by Friedman in 1991.398,399 The main advantage of MARS is the lack of any prior assumptions for setting up a functional relationship between the dependent and independent variables. Thanks to this, MARS is recognized as one of the most prominent methods for grading and regression in highly nonlinear systems. However, limited works using MARS have been reported in the field of battery SOC prediction, due to problems associated with pruned data. Vyas et al.400 adopted the PCA to mitigate the problem related to a very large number of input variables and outcome targets, without admitting sufficient observations. In his research study, the MARS technique was used to predict the SOC of a nickel–cobalt rechargeable 18650PF LIB (3.6 V/2700 mAh). This technique was successfully implemented for predicting battery SOC using voltage current and temperature as input variables. In particular, voltage, current, and temperature were considered as continuous independent variables, while SOC was considered as a continuous dependent variable, achieving a prediction relative error <1% for discharge profiles of 0.3 and 0.5 C for SOC ranging between 20% and 95%.
5.5. Conclusions and Future Trends
The electrochemical characterization of LIBs is fundamental to guarantee their lifetime reliability, providing an accurate diagnosis of their state through different parameters, like the SOC, SOH, and RUL, among others. In this line, lifetime battery predictions, resulting from off-line experimental analysis, have been addressed by means of physical and semiempirical models, with limited success considering the variety of degradation modes and their coupling to thermal and mechanical phenomena inside a battery cell, which makes it challenging to develop models having reasonable computational cost.
To overcome the aforementioned drawbacks, ML methods have been implemented in the electrochemical characterization of LIBs to assess online estimation, lifetime prediction, performance, and safety. A variety of custom-made models have been developed to address these topics, whose pros and cons were analyzed thoroughly in this section in terms of battery physical properties, parametrization, training, and uncertainty.
In terms of performance and safety prediction, an ELM method has been proposed to model the battery and predict the evolution of its temperature, voltage, and power. Furthermore, safety issues have been addressed simulating by analyzing the battery thermal behavior by means of an ANN model.
With regard to aging prediction, the rise of the computational resources available unlocks the use of ML and deep learning utilizing a large amount of data for RUL predictions. Current data-driven approaches in battery aging predictions include supervised and unsupervised algorithms, such as time series analysis, ANN, SVM, RVM, and probability estimation, like GPR, among others. The most used ones are those based on probabilistic estimation, SVM, and NN family, in that order. All of them have brought (and will bring in the future) new insights beyond the current expert level, leading to a better understanding of battery performance and failure processes. In particular, we believe that regression algorithms based on time series will make a mark in the near future, given the large amount of data that they deal with. However, in a long-term perspective, we think that algorithms capable of making accurate and realistic predictions with a much more limited amount of data will ultimately prevail, thanks to their lower requirements in terms of resources needed to build the data set and for the training step.
Online estimation, i.e., SOX monitoring and prediction of LIBs by data-driven models, is typically based on the analysis of the data generated by specific battery systems. The scientific articles revised herein allow concluding that the most used ML methods for LIB online estimation are SVM, NN family, probability estimation, and ensemble learning techniques. In particular, SVM is the most popular one for online estimation of SOH and RUL.
Other advanced data-driven models applied to the electrochemical characterization, aging, and temperature evolution, among other aspects, are being developed for LIBs. It is expected that the reduction of the input parameters to a minimal set of critical features will lead to an increased accuracy, together with a decrease of the overall simulation time. Nevertheless, these models need a large amount of data for proper training, leading to a relatively high computational cost for the training step. Despite this, after the training process a highly accurate model could provide information about LIB SOX and RUL at extremely low computational cost. Another aspect that needs to be considered is the lack of any physical insight of the data-driven models, which partially hampers their application. These drawbacks can be overcome combining the advantages that bring different model approaches, for instance, physical-based and data-driven models, in the so-called hybrid approaches.
6. Other Battery-Related Applications
This section compiles other battery-related application domains of AI/ML, beyond the ones described above. This includes the derivation of surrogate mathematical models, able to describe battery cell behavior with significantly less computational costs than traditional physical-based models, and the demonstration of approaches able to automatically mine data from the literature and other sources. Figure 48 depicts a schematic of the ML methods employed for the applications covered in this section, their frequency and the nature of the data set used.
Figure 48.

Infographic on the ML methods recently used in the literature for applications to surrogate models, battery recycling/second life, and text mining, including the corresponding nature (calculated vs experimental data) of the employed databases.
6.1. Surrogate Models
Physics-based and ML-based models can be combined together to enhance the applicability and the completeness of both of the approaches (i.e., based on physics or data only). On one hand, physics-based models can provide a complementary understanding of the trends obtained by ML-driven models. On the other hand, this can make physics-based modeling more accessible in terms of computational resources needed, easing its widespread use in both industries and academia. In this context, the ML-based approach can be used to develop force fields able to accelerate simulations based on DFT or MD, among others (cf. section 2), to accelerate their parametrization (section 3), or directly combined with physical models to significantly support and ease the use of surrogate models, as will be discussed below.
A straightforward approach to increase the cell energy density is to optimize the cell electrode design and electrolyte transport properties. For this purpose, a fast but still reliable model can be used to test different cell or electrode designs in order to give indications on the most interesting ones to test experimentally. The pseudo-two-dimensional (P2D) model is the most reported model in the literature401,402 due to its balance between accuracy and relatively low computational cost. The P2D model describes the electrochemical reaction kinetics that takes place in the electrodes, by means of the well-known Butler–Volmer equation. It also makes a description of the transport phenomena, and it is able to obtain concentration and potential distributions along the thicknesses of the electrodes. Diffusion is assumed as the only phenomenon driving transport of lithium in the active material. The concentrated solution theory describes the transport in the electrolyte. The active material in a porous electrode is composed of numerous particles, and this is why a second pseudo-dimension representing the radial diffusion on the particles is used, giving the name to the model.
Despite its already demonstrated strong applications in the battery field,403−407 the computational cost of P2D models when directly applied to battery design can be prohibitively high. Indeed, in simulation-based battery design, thousands of simulations are often required to determine the optimal design variables. Moreover, the complex nonlinear nature of the battery model may result in convergence problems under some sets of design variables. In this scenario, the sensitivity of the design variables is also difficult to analyze, because of their high computational cost. In this context, a surrogate model based on ML algorithms would reduce the computational burden of battery design by several orders of magnitude.
Within this sense, Dawson-Elli et al.408 created a ML-based surrogate model of a LIB cell. A flowchart representing their methodology is shown in Figure 49. They implemented developed DTs, RFs, and gradient-boosted-machine (GBM)-based surrogate models and examined their abilities to predict the dynamic behavior of the physics-based model. The P2D model was used to create the data set for this study, and the results were analyzed in terms of accuracy and execution time. Trade-offs among training time, execution time, and accuracy for different ML algorithms were reported.
Figure 49.

Process flowchart for the creation of surrogate models from simulated data.408 Figure reproduced with permission from ref (408). Copyright 2018 IOPScience.
Dawson et al. also proposed to embed in the proposed procedure more complex ML algorithms, such as ANNs, with longer training but similar execution time. The aim of this was to reach superior interpolation performance with respect to the ones obtained through DT, RF, and GBM. Even if this is reasonable, it should be tested and demonstrated, recalling the importance of benchmarking as much ML algorithms as possible in order to define the ones with the best prediction capabilities in terms of reproducing the system under analysis.
Wu et al.409 presented a systematic approach based on ANN to reduce the computational burden of battery design by several orders of magnitude. Two NNs were constructed using the finite element simulation results from a P2D model. The first NN served as a classifier to predict whether a set of input variables is physically correct, while the second NN provided predictions on its specific energy and power. Both NNs were validated using extra P2D model simulations not considered during the training (test set). With a global sensitivity analysis performed by using these NNs, Wu et al. quantified the effect of several input parameters (thickness, solids volume ratio, C-rate, particle radius, electrolyte concertation, etc.) on specific energy and power. The evaluation of large combinations of these input parameters would have been computationally prohibitive for the full P2D model simulations, showing the potential of ML-based surrogate models. Among the parameters tested, the applied C-rate had the largest influence on specific power, while the electrode thickness and porosity were the dominant factors affecting the specific energy. Thanks to these findings, Wu et al. generated a design map of the conditions allowing the desired specific energy and power to be reached. This study then highlighted the potential of NN in handling the nonlinear, complex, and computationally expensive problem of battery design and optimization.
Compared to the P2D models, the multidimensional multiphysics (MDMP) models410 can simulate and predict the cell performance by considering cell design parameters under more realistic operating conditions, making their results more trustable. For example, various authors411,412 have developed MDMP models to simulate the distribution of surface temperature and lithium concentration in large format prismatic cells. These detailed simulations consider the battery heterogeneity and nonlinearity within real cell components and geometry. At the same time, MDMP models are directly related to and determined by their parameters, including cell design and the physical properties of the materials used. The intensive study of parameter sensitivities is essential for a detailed understanding (and then better optimization) of cell performance and safety among other important characteristics. However, most studies about sensitivity analysis of LIBs frequently rely on scenario analysis413 and local studies,414 which investigates only minor parameter changes, exploring narrow ranges of the entire parameter space. The main reason for this is the high computational cost of the numerical quantification of the parameter sensitivities. Surrogate models using ML algorithms able to predict the effect of the aforementioned parameters can then be useful to perform broader parameter sensitivity analysis by keeping reasonable the associated computational cost.
Within that spirit, Yamanaka et al. developed a computational framework for performing multiobjective optimization at a reasonable computational cost using ML methods.415 With this framework, an inverse analysis of optimal LIB design conditions, including safety conditions, is performed. Nail penetration simulations on different input conditions are performed so as to build a database for battery design conditions/test conditions (descriptors) and safety/performance (predictors). As a result, of analyzing the relationship between descriptors and predictors, a high correlation between fire spread and negative electrode active material diameter is confirmed. Furthermore, a regression model to predict the database is created with a GPM. Using the model and a genetic algorithm, the authors identified the design conditions offering the highest safety and performance.
Bao et al.23 proposed a computational workflow that couples data-driven modeling with physical modeling to provide insights on the relationship between the electrode microstructure at the pore scale and the electrochemical reaction uniformity at the device scale in operating redox flow batteries (Figure 50). The authors train and validate a DNN model by using more than 100 pore-scale simulations providing a quantitative relationship between redox flow battery operating conditions (electrolyte inlet velocity, current density, electrolyte concentration) and uniformity of the surface reaction at the pore scale. The extracted information is upscaled at the cell level simulation. Based on the multiscale model results, a time-varying optimization of electrolyte inlet velocity is proposed, leading to a significant reduction in pump power consumption for targeted surface reaction uniformity but little reduction in electric power output for discharging.
Figure 50.

Graphical representation of the 1D device-scale simulation and multiscale model flowchart developed by Bao et al.23 The insert within the box enclosed by the dashed blue border reports the DNN scheme used for learning the relationship between flow-battery operating conditions and surface reaction uniformity. Figure adapted with permission from ref (23). Copyright 2020 Wiley.
6.2. Recycling and Second Life Assessments
Secondary battery utilization is a key strategy to solve the problem of battery recycling in the future. For instance, a retired battery pack from an EV is not directly reusable due to the poor consistency of the cells in the pack after usage. The application of ML techniques to assist in the decision making of which cells to reuse has been emerging very recently. ML gives the promise of increasing the reliability in the cell choice and to accelerate the overall battery recycling cycle.
Zhou et al. reported recently a screening method for retired cells based on SVM. The authors dissembled cells (240) from retired battery packs and measured their capacity and resistance.416 Then, a multiclass model based on SVM was trained to classify the retired cells. The model accurately separated the retired cells into four classes with very high accuracy (above 96%). The authors demonstrated that this model permits a faster classification and a greater screening efficiency than the traditional manual classification method (Figure 51).
Figure 51.

Schematic representation of how the SVM-based approach proposed by Zhou et al.416 could assist the second life of EV battery for application as stationary applications. Figure adapted with permission from ref (416). Copyright 2020 Elsevier.
A similar study was reported by Garg et al.417 where a systematic clustering method of retired LIB cells is proposed. The method is mainly divided into three stages: (i) fast screening of voltage and internal resistance, (ii) retired battery SOH detection, (iii) retired battery clustering method based on a self-organizing map (SM) NN. The authors show their proposed screening scheme can quickly identify the initial state of retired batteries and provide a solid basis for further decision-making. Experimental results discussed by the authors show that the capacity and potential cycle numbers of reuse packs manufactured by SOM clustering are 25 and 50% more than those of reuse packs manufactured by randomly selected retired batteries.
In the same spirit of the works above, Senthilselvi et al.418 recently reported a study of mobile phone recycling. The authors used a MEPH (magnetic separation, Eddy current, pyrometallurgical, and hydrometallurgical) process for metal separation, metal extraction, and purification. The purified metal is captured through a camera, and the captured image is subject to noise removal and given as input to a CNN for classification and better assessment of the recycling process.
6.3. Text Mining
In recent decades, battery science is facing big data difficulties because of the large amount of raw battery data. A similar tendency is noticed in the battery literature, which nowadays contains more than 298,00018 and grows exponentially each year, making the task of reviewing the literature a challenging and time-consuming task. Hence, this information needs to be effectively extracted and analyzed in order to be useful. Text mining (TM) methods are the best candidates to handle textual data. ML provides tools that can assist the information extraction in the TM as well as the analysis of the extracted data, as it proves its use in a variety of domains.419−423
The text corpus from the literature is mainly (∼80%) unstructured,424 which makes it unclear and difficult to manipulate from an algorithm point of view. TM uses a nonconventional retrieval method to extract the information of interest from a large textual set, as shown in the classical TM workflow reported in Figure 52. This workflow can be summarized as being composed of the following steps:
-
1.
Collecting unstructured data with different formats as plain text, pdf, html, xml, or web pages, among others.
-
2.
Preprocessing step aiming to clean and prepare the text (removing tags, advertisements, etc.) and convert it into an easily readable format (typically plain text).
-
3.
The resulting text is ready to be analyzed, starting with converting unstructured data into structured data, as a table of data which can be used to train a ML algorithm.
-
4.
Save the extracted information into a database.
Figure 52.

Overall process of text mining.
During the past decades, several TM techniques have emerged, such as the following:
Information extraction: It is the most used TM technique, which aims to extract the information of interest from a large textual data set. This technique basically focuses on identifying relevant entities as well as the relationships within them.
Categorization: It is a supervised ML method, in which the algorithm uses typically human-generated input data (as the position in text in which certain information is reported) to learn from it, aiming to be able to classify autonomously new observations (as the location of the same information in a not previously analyzed article).
Clustering: This method is used to identify clusters of documents with one or more common feature(s).
Summarization: This method aims to reduce the length and remove details from specific text in an automatic way, while holding the valuable information and general meaning.
TM is a powerful tool that can be used to mine information and knowledge from textual data, and it starts to be applied in the battery field. Torayev et al.425 used TM techniques to promote the reviewing process of scientific publications and applied it to Li–O2 batteries. Using over 1800 papers on Li–O2 batteries, the authors screened the reported discharge capacities according to the publication year, which helps to reveal the progress that has been made in recent years. The authors focused essentially on the stability–cyclability, the low practical capacity, and the rate capability of the batteries, using bibliometric analysis of the literature. The analysis proved that researchers in the field moved from carbonate-based electrolytes to glymes (dimethoxyethane, diglyme, triglyme, tetraglyme) and dimethyl sulfoxide-based ones. The results also showed that the majority of papers aim to improve either cyclability, stability, or catalysis aspects.
Ghadbeigi et al.426 used a database created by manually screening information from over 200 publications to predict the capacity of battery materials using a ML approach. Nevertheless, the limited dimension of their data set limits the trustability of the so-obtained results. Hence, it is crucial to build automated systems that are capable of building databases from all available literature, especially for well assessed fields (as LIBs) for which thousands of articles should be considered to obtain results that can be considered representative of the real state of the art.
Thanks to TM and natural language processing (NLP), it is nowadays possible to collect data of interest from unstructured text, which can unlock the possibility of predicting new patterns, trends, and dependencies through the data already available. Tshitoyan et al.92 showed that it is possible to gather material science information from the published literature without human supervision by using word embedding. Word embedding makes textual data understandable to TM and NLP algorithms by converting the words to a mathematical representation (as a vector). The idea behind this approach is that similar words will have similar surroundings, meaning in mathematical terms that the two generated vectors will be similar as well, easing their classification. In their work, Tshitoyan et al. used a word-embedding approach applied to material science, focusing on structure–property relationships as well as the underlying structure of the periodic table. These results were obtained using ∼3.3 million scientific abstracts from over 1000 journals, without giving to the model any chemical knowledge to start with. The authors proved that the unsupervised approach is capable of predicting new materials for useful applications based only on the previous published literature. This work proved that unsupervised word embedding can be used not only to capture the known information from text but also to reveal previously unknown knowledge about materials properties. In addition, the predictions of their word embedding models were compared to the results of ab initio DFT calculations and experimental data sets, in order to check the validity of their results. By retraining the model using only abstracts published before 2009 and comparing the resulting predictions with the following 10 years of published abstracts, the authors found that their model was able to predict some of the best thermoelectric materials reported in the past decade, by using information reported years before their actual discovery. Such a model can be an important piece of future material discoveries, allowing to save time and boost research in the field.
TM was also used recently by El-Bousiydy et al.20 to disclose LIB scientists’ habits in terms of how often certain basic, yet critical, electrode and cell features are reported in the scientific literature. The TM algorithm developed in this work is based on specific libraries based on keyword search linked to logical operators, complex enough to extract in the most complete and accurate way the searched information. The accuracy of this algorithm, which was used to analyze a data set of ∼13,000 LIB and sodium-ion battery scientific publications, was assessed by comparing the results extractable by the TM algorithm and the ones extracted by expert research in 1000 randomly selected articles, showing good accuracy for all of the electrode and cell features analyzed (F1-score >80% for the vast majority of them). Their findings (summarized in Figure 53) show a lack of systematic reporting for certain key electrode features, as their thickness, porosity, electrolyte volume, and surface area. A critical, yet unexpected, finding is that the majority of articles did not report the mass loading and, when reported, >50% was reported as approximate or a range of values, hampering the validity of reporting a rate capability test.
Figure 53.

Percentages of LIB articles in which selected electrode and cell features were found through the text mining algorithm developed by El-Bousiydy et al.20 For the case of mass loading, porosity, and thickness, it was calculated as well how frequently those properties are reported as exact or approximate/range of values. Figure reproduced with permission from ref (20). Copyright 2021 Wiley.
These findings are highly problematic in terms of completeness of the data disclosed, which links to the difficulty of reproducing certain experimental results, making it sometimes challenging to discern hype from reality. This work aimed not only to raise attention within the battery community to the lack of key data in the scientific literature, but it also proposed a practical solution: stronger standardization of the field. This should be implemented in a way not seen as a burden by the scientific community, but as a tool to further support and ensure the creativity process, maximizing simultaneously researchers’ freedom and efficiency.427
Among the most used TM and NLP tools for chemical information extraction and text processing, ChemDataExtractor can automatically detect and collect chemical information from large unstructured corpora, as scientific literature. ChemDataExctractor was initially developed by Swain et al.,428 which aimed to build an unsupervised word clustering based on a large volume of chemistry scientific articles. In that context, ChemDataExtractor proved to be a flexible and accurate tool (F-score >85%, which stands for a trustable extraction procedure) in terms of text processing, tokenization, and part-of-speech tagging, for recognizing and capturing chemical entities, the associated properties, and their interdependencies.
Huang et al.429 exploited a modified ChemDataExtractor430 to generate automatically information from over 229,000 papers associated with battery research. The aim of this work was to build a large database of battery materials to study five material properties: capacity, voltage, conductivity, Coulombic efficiency, and energy.
Kononova et al.431 built a fully autogenerated open source data set, which is retrieved from over 53,000 solid-state synthesis paragraphs. This data set contains more than 19,000 chemical reaction procedures. The authors used an automated extraction pipeline by using TM and NLP tools to recover the targeted materials information, starting compounds, synthesis steps, and conditions. Therefore, they converted this information into a chemical equation summarizing the synthesis procedures used.
Kuniyoshi et al.432 built a corpus, named SynthASSBs, by analyzing 243 ASSB articles and extracting the synthesis procedures reported herein. SynthASSBs contain synthetic parameters (as temperature, chemical nature, etc.) and their links (for instance, which components are mixed under which conditions). This corpus was used to train a deep-learning-based sequence-tagging model with a rule-based approach to develop a ML model able to extract automatically the synthesis procedure out of the experimental section. Their model can identify the entities (i.e., in this case, the synthetic procedure) with an F-score of 0.826, while the rule-based relation extractor achieved an F-score of 0.887, both indicating good model accuracy.
Amazingly, an AI-based algorithm similar to text mining has been recently used to write an entire book about lithium-ion batteries published by Springer.433 Such an algorithm, the book’s author named it multi-island genetic algorithm “beta writer”, collected numerous abstracts and keywords from scientific publications on the subject and compiled them in an organized fashion. Despite a (sometimes) approximate writing and the miss of important reference citations, the result is promising, showing that AI has strong potential to ease battery data organization, which in turn can ease the state-of-the-art assessment by battery scientists.
In conclusion, until today, only few works based on TM were focused on the battery field, while TM is already a well assessed technique for domains such as biomedicine.419−422 In this regard, and as TM algorithms are increasingly accessible, we hope that TM will be more and more adopted by the battery community. Indeed, by exploiting the enormous corpus of knowledge that is (almost) fully digitized in the battery scientific literature, today it is possible to build large databases, which have the potential of offering major insights into a highly complex field as the one of battery R&D. In addition, TM could also help in identifying the most critical results in the scientific literature, helping researchers’ in identifying the most promising field of research for the future and which reported results should be subjected to further investigation or targeted replication efforts.
7. Overall Conclusions, Challenges, and Perspectives
AI for batteries is not hype. AI in general, and ML in particular, lead the promise of overcoming the main limitations of battery optimization, which often yields a combinatorial explosion and makes impractical the exhaustive rendering of chemical and electrode/cell manufacturing spaces. ML-based methods can allow navigating such chemical, formulation, and operation condition spaces in a selective manner and promises to reduce the number of required experiments and/or computations. From a theoretical viewpoint, ML can support the development of highly efficient force fields, creating new opportunities for material simulations and reliable surrogate models. This could also boost the development of multiscale modeling frameworks with reasonable computational costs, as discussed in sections 2 and 6. In addition, ML has the potential to become a powerful experimental enhancing tool in terms of identifying reaction mechanisms directly from electrochemical results (as cyclic voltammetry).434 On the one hand, some ML applications in the battery field have already been extensively investigated in the scientific literature, as online and offline estimation of battery SOH, SOC, and RUL, as discussed in section 5. On the other hand, several promising applications of AI/ML are surprisingly understudied in the battery field. Among them, battery manufacturing (section 3) and battery material characterization (section 4) are clear examples. The use of data-driven approaches will profoundly influence the industrial facilities of modern societies, guiding toward the Industry 4.0 revolution. Battery manufacturing will not be an exception, and dedicated data warehouses will be needed in the near future. Despite this clear trend, academic studies on the subject are still rare in the literature, calling for stronger efforts in this direction. Academia should offer to industries new data-driven approaches, assisting them in overcoming this revolution. Similar remarks can be made for the case of battery materials characterization, for which scientific literature is still scarce. One of the first and more important applications of ML techniques is image analysis, making ML particularly suited for tomography image segmentation, a field in which ML algorithms are expected playing a predominant role in the forthcoming future. Another field in which AI is expected to play a key role in battery research is text mining (section 6), in terms of both data retrieval and analysis. This could give access to vast data sets “just” recovering the information already available in the scientific literature, which would significantly ease the analysis of the chemical and electrode/cell manufacturing spaces discussed at the beginning of this section. However, a severe concern for its applicability is the systematic lack of data on critical electrode and cell properties, for instance, electrode porosity, electrolyte volume, or electrochemical testing protocols, to name a few, which are likely to be too often neglected in scientific reports, as recently demonstrated by El-Bousiydy et al. mining 13,000 battery-related scientific articles.20 In addition, despite the challenges ahead, ML brings the promise of boosting the emergence of self-driving battery laboratories to automate experiments and data collection, as it starts to be seen in other chemistry-related fields.182,435
Despite all of the promises and hopes on AI and ML, a long way is still needed before reaching a widespread use of data-driven approaches in the battery field. Challenges that should be addressed can be summarized as (i) descriptors, (ii) data scarcity and error determination, (iii) lack of standards and immature representations, (iv) user-friendly tools, and (v) bridging scales:
Descriptors: The efficiency and, ultimately, the success of any ML model relies on the selection of appropriate descriptors. Defining the most suited descriptors for a certain ML model and identifying descriptors that could be generalized is far from being straightforward. Even though the importance of good descriptors is largely discussed in the field of ML applied to material design and synthesis, the same problem applies to all of the other fields discussed here, from manufacturing to material characterization, where the consideration of different parameters can potentially lead to significantly different results and conclusions.
Data scarcity and error determination: If from one side the number of possible descriptors/parameters to be considered in any ML procedure can be large, from the other side the size of training data sets could be relatively small, especially at the lab scale. This imbalance might, in general, lead to overfitting issues. To mitigate this, future research directions should consider the development of ML algorithms specifically geared to small data sets (e.g., hierarchical ML, reinforced learning, sequential learning, etc.). Other useful strategies could be the use of transfer learning by incorporating theoretical data to experimental ones, guiding the training process (e.g., bias learning), and the development of hybrid approaches, combining experiments, modeling, and ML. Additionally, ML techniques capable of determining or estimating the error associated with the ML predictions will be strongly beneficial, allowing to assess the limit of applicability of a specific ML model for which a wider adoption of Bayesian-based ML approaches would be favorable. Cross-validation of different ML models could also help quantify uncertainty by, for example, performing extensive calibration tests considering experimental or computational campaigns based on the same benchmark data. It is also important to stress here the critical importance of further developing freely accessible battery-related databases, similarly to the ones of the Material Project436 and NASA,341 the ones developed in the context of the ARTISTIC,15 DEFACTO,16 and BIG-MAP17 projects, or the ones existing in other fields.437
Lack of standards and immature representations: Missing agreed-upon data standards in the battery field not only hinders data from being shared and mined, but it also hampers data curation and interoperability, which is crucial to improve the predictive capability of ML models and make their training more efficient. Stronger efforts from the battery community to agree upon broadly accepted standards in terms of material synthesis and electrode/cell manufacturing and characterization have the potential to ease comparison of results, helping to discriminate hypes from reality and assisting the development of ML models, which could rely on trustable and more accessible data. Recent actions in this directions were recently undertaken in the battery field.20,78,79,438 In addition, a standardized way of referring to the different ML techniques would be beneficial to ease the discussion between different groups worldwide and make the associated scientific literature more accessible.
User-friendly tools: Stronger collaboration between AI’s specialist and battery experts from both the experimental and computational point of view is crucial to exploit the full potential of AI or ML approaches applied to battery R&I. A possible strategy to ease a wider adoption of data-driven approaches in a battery researcher’s routine could be the development of AI- or ML-based user-friendly tools. These tools should aim to assist researchers in their daily work, which would lead them to feed those tools with as much data as possible, possibly mitigating the challenges associated with data scarcity.
Bridging scales: ML has an important role to play for the development of multiscale models (from atomistic to system level) to make predictive models accounting for all scales and their interactions. For instance, the use of ML-based imaging techniques can provide valuable insights regarding the dynamics of interfacial processes, with Li dendrite formation and growth being one of the most detrimental among these phenomena. In addition, the combination of ML-assisted imaging, or high-fidelity in silico mesostructures121,122, and physics-based modeling can open up new frontiers in understanding the mesostructure–properties relationship. Other important contributions of ML-assisted multiscale modeling could come from fast screening of the manufacturing–mesostructure–properties relationships,21 coupling device and pore/molecular scales (as reported in the context of redox flow batteries)23 or tackling the problem of polysulfide formation and transport in Li–S batteries. Such models could lead to a more holistic view of the battery optimization problem, opening new frontiers in battery R&D&I.
Today it is clear that the capabilities and potential of AI in general and ML in particular are attracting a growing interest to attain new insights on batteries at all scales: from material design and synthesis to manufacturing, and from material to electrochemical characterization. Many hopes are pinned on data-driven approaches applied to batteries, yet significant progress in the field is needed before leading to the revolution that AI promises. Creative and innovative AI solutions are emerging in other fields, as in music creation where a composer can request an AI to compose music by mixing predefined music styles.439 In a not so distant future, these solutions may become adapted for the battery field as support of researchers’ creativity; for example, we can imagine AI algorithms building multiscale models by picking up automatically from the literature a collection of models with the degree of fidelity desired. Another example is Alpha fold, an AI network that recently demonstrated being able to determine the 3D structure of proteins starting from their amino-acid sequence. Similar approaches can be envisioned for batteries, as computational frameworks able to indicate how cell/electrode components organize in the space as a function of their chemical nature, ratio, and manufacturing conditions, as well as how the arising 3D mesostructure affects the cell lifetime, electrochemical, and mechanical properties.
All of the AI discussed above is also categorized as “weak AI” in computer science, i.e,. a set of informatics programs mimicking human intelligence. Since Alan Turing’s times, strong debate persists about the possibility or not of designing AIs which can think and have genuine understanding and conscious thoughts, i.e., the so-called “strong AI”. If strong AI emerges one day, it will revolutionize even more the battery field.440 Still, ethical aspects should be carefully considered in their design, for both “weak” and “strong” AIs441 to ensure strong synergies between humans and machines (Figure 54).
Figure 54.

Smart machines and humans working in strong synergy, a foreseeable future for AI in battery research for the coming years.
Overall, to become an unavoidable driving force to foster innovation, AI experts should mandatorily and strongly collaborate with battery experts from both an experimental and computational point of view. If the battery community will be able to successfully integrate data-driven approaches in their routine work, data could open the door to new fascinating discoveries in the field at an unseen rate, boosting the development of the new generation of batteries.
Acknowledgments
A.A.F., T.L. and M.D. acknowledge the European Union’s Horizon 2020 research and innovation programme for the funding support through the European Research Council (grant agreement 772873, “ARTISTIC” project). H.E.-B., P.J., and A.A.F. acknowledge the Alistore-ERI for the funding support of H.E.-B. Ph.D. thesis. F.Å. and P.J. both acknowledge the support from the Swedish Energy Agency (Grant Nos. P43525-1 and P39909-1) and P.J. the continuous support from several of Chalmers Areas of Advance: Materials Science, Energy, and Transport, and especially his Applied AI grant from VINNOVA - Sweden’s Innovation Agency. Work at CIC energiGUNE is supported by the Ministerio de Ciencia e Innovación of Spain through the project ION-SELF (No. PID2019-106519RB-I00). P.B.J., A.B., E.A., F.A., and T.V. acknowledge support from the European Union’s Horizon 2020 research and innovation programme under Grant Agreement Nos. 957213 (BATTERY2030PLUS) and 957189 (BIG-MAP). P.B.J., A.B., and T.V. acknowledge support from VILLUM FONDEN by a research Grant No. 00023105 (DeepDFT project). F.A. and E.A. acknowledge support from the European Union’s Horizon 2020 research and innovation programme under Grant Agreement No. 875247. A.A.F. acknowledges Institut Universitaire de France for the support. A.G., T.L., M.D., A.D., and A.A.F would like to thank the French National Research Agency for its support through the Labex STORE-EX project (ANR-10-LABX-76-01). All of the authors acknowledge the many fruitful discussions within Alistore-ERI, especially the Theory Open Platform, which have been instrumental for the review to materialize.
Glossary
Acronyms
- AAE
adversarial autoencoder
- ABC
artificial bee colony
- ADNN
autoencoder – deep neural network
- AI
artificial intelligence
- ANN
artificial neural network
- ARNN
adaptive recurrent neural network
- ARD
automatic relevance determination
- ASSB
all-solid-state battery
- BCNN
Bayesian convolutional neural network
- BMC
Bayesian Monte Carlo
- BO
Bayesian optimization
- BVFF
bond valence force field
- CBD
carbon binder domain
- CE
cluster expansion
- CEEMDAN
complete ensemble empirical mode decomposition with adaptive noise
- CGCNN
crystal graph convolutional neural network
- CGMD
coarse grained molecular dynamics
- CHAIN-MED
cyber hierarchy and interactional network-based multiscale electrode design
- CL
convolutional layer
- CLO
closed loop optimization
- CNN
convolutional neural network
- COD
Crystallography Open Database
- CPS
cyber-physical systems
- CT
computed tomography
- CV
cross-validation
- DoE
design of experiments
- D-DEMG
data-driven stochastic electrode mesostructure generator
- DFT
density functional theory
- DCNN
deep convolutional neural network
- DNN
deep neural network
- DOD
depth-of-discharge
- DT
decision tree
- DV
differential voltage
- EIS
electrochemical impedance spectroscopy
- ELM
extreme learning machine
- ERT
extremely randomized tree
- ES-GP
exhaustive search with a Gaussian process
- ES-LiR
exhaustive search with linear regression
- ETNN
electrochemical thermal neural network
- EV
electric vehicle
- FE
finite element
- FF
force field
- FPCA
functional principal component analysis
- FTIR
Fourier transform infrared
- GAP
Gaussian approximation potential
- GAN
generative adversarial network
- GP
Gaussian process
- GPR
Gaussian process regression
- HT
high throughput
- ICA
incremental capacity analysis
- ICE
in situ capacity estimation
- ICSD
Inorganic Crystal Structure Database
- IIoT
industrial internet of things
- ISC
internal short circuit
- k-NN
k-nearest neighbors
- KRR
kernel ridge regression
- LASSO
least absolute shrinkage and selection operator
- LDA
linear discriminant analysis
- LARS
least-angles regression
- LIB
lithium-ion battery
- LR
logistic regression
- LSTM
long short-term memory
- LSSVR
least squares support vector machines regression
- MAE
mean average error
- MARS
multivariate adaptive regression splines
- MCR-ALS
multivariate curve resolution-alternating least squares
- MD
molecular dynamics
- MIGA
multi-island genetic algorithm
- ML
machine learning
- MLP
multilayer perceptron
- MLR
multiple linear regression
- MOF
metal–organic framework
- MP
Materials Project
- MSDN
multistream dense net
- MSVM
multikernel support vector machine
- NB
naive Bayes
- NEB
nudged elastic band
- NIPALS
nonlinear iterative partial least square
- NLP
natural language processing
- NMC
nickel–manganese–cobalt oxide
- NMR
nuclear magnetic resonance
- NN
neural network
- OCL
one-class learning
- PCA
principal component analysis
pair distribution function
- PF
particle filter
- PLS
partial least squares
- PLS-DA
partial least square discriminant analysis
- PSO
particle swarm optimization
- QDA
quadratic discriminant analysis
- R&D
research and development
- R&D&I
research and development and innovation
- R&I
research and innovation
- RF
random forest
- RMSE
root-mean-square error
- RNN
recurrent neural network
- RR
ridge regression
- RUL
remaining useful life
- RVM
relevance vector machine
- SDA
shrinkage discriminant analysis
- SE
squared exponential
- SOAP
smooth overlap of atomic positions
- SOC
state of charge
- SOH
state of health
- SOT
state of temperature
- SPM
single particle model
- SSIM
structural similarity index measure
- SVC
support vector classifier
- SVM
support vector machine
- SVR
support vector regression
- TCN
temporal convolutional network
- TXM
transmission X-ray tomography
- VAE
variational autoencoder
- WNN
wavelet neural network
- XANES
X-ray absorption near edge structure
- XAS
X-ray absorption spectroscopy
- XRD
X-ray diffraction
Biographies
Teo Lombardo is an early career researcher passionate by learning, focused on the energy field, and currently finalizing his PhD in chemistry under the supervision of Prof. Dr. Alejandro A. Franco. He currently works at the Laboratoire de Réactivité et Chimie des Solides (LRCS - France) on the ERC-funded ARTISTIC project, where his main role is the development and experimental validation of three-dimensional physics-based models of Li-ion battery electrode manufacturing. His previous scientific experiences include a bachelor degree in Chemistry at the University of Catania (Italy, 2016), a master degree in Photochemistry and Molecular Materials at the University of Bologna (Italy, 2018), and an internship at the École Normale Supérieure of Paris (France, 2018), where he worked on coupling droplet-based microfluidics and electrochemistry.
Marc Duquesnoy is a Ph.D. working on the application of artificial intelligence on the optimization of the lithium ion battery manufacturing process. His work is in collaboration between the Laboratoire de Réactivité et Chimie des Solides (LRCS - France) and CIDETEC Energy Storage (Spain), funded by ALISTORE-ERI and supported by UMICORE. The thesis is supervised by Prof. Dr. Alejandro A. Franco and Elixabete Ayerbe. He already worked for the LRCS as a Big Data research engineer in 2019.
Hassna El-Bouysidy is a third year Ph.D. student, funded by ALISTORE-European Research Institute, at the Laboratoire de Réactivité et Chimie des Solides (LRCS - France), Université de Picardie Jules Verne. Her research focuses on the application of machine learning methods to extract information from the literature of lithium-ion batteries, supervised by Prof. Dr. Alejandro A. Franco and Prof. Dr. Patrik Johansson.
Focusing on multiscale modeling of liquid electrolytes using machine learning models, Fabian Årén is a third year Ph.D. candidate under the supervision of Prof. Dr. Patrik Johansson. With a background in theoretical physics, his work primarily focuses on how knowledge of a materials bond graph enables a deeper understanding at scales. Also cofounding the startup Compular, this work has received traction outside of academia.
Oceanographer and chemist, Alfonso Gallo-Bueno did his master in theoretical chemistry and computational modelling in 2011–2013 and obtained his Ph.D. in 2016 studying the chemical bonds in molecules and solids with topological indices from the QTAIM theory. The thesis was in close cooperation with the Max Planck Institute for Chemical Physics of Solids, where Alfonso Gallo-Bueno did part of the Ph.D. Afterwards, he was a postdoc in the IOCB of the Czech Academy of Sciences (Czech Republic) in the group of Noncovalent Interactions (Pavel Hobza) in 2017, participating in the development of the PM8 semiempiric method for the MOPAC code. He continued his career in ITENE, an institute of technology located in Valencia, Spain, managing the chemical and nanomaterials modeling area, developing databases, and QSAR and machine learning models to chemical systems. Since March 2018, he has been a postdoc at the Modelling and Computational Simulation group in CIC energiGUNE, applying quantum chemical and machine learning tools to the development of new materials for electrochemical energy storage.
Peter Bjørn Jørgensen received his B.Sc. (2011) in Electronics Engineering and IT and M.Sc. (2013) in Wireless Communication Systems from Aalborg University, Denmark. He obtained his Ph.D. in Machine Learning at Technical University of Denmark. His thesis is on deep learning methods for screening of molecules and materials. Currently, P.B.J. is a postdoctoral researcher at Technical University of Denmark. His research interests include deep learning on graphs, probabilistic modeling, and generative models with applications in materials discovery.
Arghya Bhowmik is a researcher at Technical University of Denmark leading a group applying deep learning toward the design of energy materials like catalysts and batteries. His research spans computational modelling combining physics-based and data-driven approaches. He applies machine learning models to enable long time and length scale simulations, probabilistic generative models for inverse design of materials at multiple time and length scales, as well as explainable deep learning toward uncovering chemical laws from big data. He obtained his Ph.D. in Energy Conversion and Storage from the Technical University of Denmark (2017).
Arnaud Demortière has been a CNRS researcher at the Laboratoire de Réactivité et Chimie des Solides (LRCS - France) and the RS2E network (Amiens, France) since 2015. His research focuses on the development of in situ and operando experiments to monitor and study the dynamics of (de)lithiation at different scales. The spatiodynamics investigations of lithium composition in individual primary grains, secondary particles, and composite electrodes are based on advanced methodologies using liquid electrochemical TEM, FIB/SEM tomography, and nano-computed tomography. His team at LRCS is also heavily involved in image processing using artificial neural networks for semantic segmentation and structural pattern identification. He received his Ph.D. in Nanoscience in 2007 from Sorbonne University (Paris, France). After a CNRS postdoc at IPCMS laboratory (Strasbourg, France), he joined in 2010 Argonne National Laboratory (Chicago, USA) as a postdoc for 5 years. Since 2015, he has been the manager of the (e-/X) microscopy platform of the RS2E network. He is involved in several national and European projects in the field of batteries and advanced characterizations such as ANR-DestiNa-ion_Operando and BIG-MAP.
Elixabete Ayerbe is leading the Modelling and Post-mortem Group of the Materials for Energy Unit, coordinating the activities related to multiphysics and data-driven models, as well as the parametrization and post-mortem analysis for Li-ion and advanced Li-ion batteries. She is currently coordinating H2020 DEFACTO project and coordinated in the past the FP7 SHEL project. In addition, she represents the multiphysics modelling activity of CIDETEC in several H2020 EU projects, such as SPICY, HIFI ELEMENTS, SPIDER, CoFBAT, BIG-MAP, and Battery2030PLUS, and leads the area of Manufacturability in Battery 2030+ initiative.
Francisco Alcaide holds a Ph.D. in Chemistry (Electrochemistry, Physical Chemistry) from the University of Barcelona (2002). He has 25 years of experience in electrochemical technologies, especially in batteries, fuel cells, and hydrogen technologies. He is specialized in electrodics and electrocatalysis at the electrochemical interfaces. He has participated in about 45 R&I projects and contracts with companies at the national, European, and international level (20 as PI) and in technology transfer and innovation. He has been involved in several European projects: ZEOCELL, SUSHGEN, ARTEMIS, DEMSTACK, COBRA, SPIDER, HIFI-ELEMENTS, DEFACTO, BIG-MAP, and Battery 2030PLUS. Dr. Alcaide currently works as Principal Investigator - Project manager at CIDETEC Energy Storage.
Marine Reynaud is an experimental Chemist and a researcher of the Advanced Electrode Materials group at CIC energiGUNE. She currently leads a team working on innovative strategies to accelerate the discovery of new battery materials. She has extensive experience in inorganic syntheses and materials characterizations, in particular using diffraction techniques. She focuses her research on understanding of the correlations between composition, (micro)structure, and performances. Dr. Reynaud completed her Ph.D. in Materials Science in 2013 at the University of Picardie Jules Verne (France), for which she obtained the doctoral dissertation award from her University. She was awardee of the Spanish Juan de la Cierva fellowship (2016). She is currently leader of the work package dedicated to materials selection in the H2020 EU project 3beLiEVe.
Javier Carrasco has led the Modelling and Computational Simulation group at the CIC energiGUNE since 2013. His research aims at understanding atomic scale phenomena in surface science, materials science, and nanoscience in the energy field. Using concepts from quantum mechanics, solid-state physics, statistical mechanics, and machine learning, he applies and develops methods and computer simulations to study processes of relevance to energy materials. Rechargeable batteries and thermochemical energy storage are major focuses of his work. Dr. Carrasco obtained his Ph.D. in Theoretical Chemistry from the University of Barcelona (2006). He is an awardee of Alexander von Humboldt (2007), Newton International (2009), and Ramón y Cajal (2011) fellowships. He is listed in the Stanford University’s 2019 list of the top 2% scientists in the world, mainly for his contributions in the Chemical Physics and Physical Chemistry subdisciplines.
Alexis Grimaud has been a CNRS assistant researcher at Collège de France, Paris, in the solid-state chemistry and energy laboratory since 2014. His research aims at understanding the complexity of electrochemical interfaces for applications such as water electrolyzers or batteries. For that, he is developing novel approaches relying on the control of interfacial interactions, mastering weak interactions in liquid electrolytes as well as surface and bulk processes of solid electrodes. Dr. Grimaud obtained his Ph.D. in Material Science in 2011 from the University of Bordeaux (Institut of Condensed Matter Chemistry of Bordeaux, ICMCB), before becoming a postdoctoral researcher at MIT under the guidance of Prof. Dr. Yang Shao-Horn.
Chao Zhang is an associate professor in the Department of Chemistry-Ångström Laboratory at Uppsala University. He obtained Dr. rer. nat. from RWTH Aachen University in 2013 and Docent (“venia docendi”) from Uppsala University in 2020. Before joining Uppsala in 2017, he was a postdoctoral researcher in the Department of Chemistry at Cambridge University. His group focuses on developing finite-field methods in computational electrochemistry as well as multiscale modelling of electrolyte materials and electrified solid–liquid interfaces in energy storage/conversion. He is the recipient of ERC Starting Grant (2020), Junior Research Fellowship from Wolfson College (2015) and Jülich Excellence Prize for Young Scientists (2013).
Tejs Vegge is professor and head of section for Atomic Scale Materials Modelling at the Technical University of Denmark, working on the development of autonomous methodologies for accelerating materials discovery and innovation processes. He is an elected member of the Academy of Technical Sciences (ATV) and the Danish Government’s Commission on green transportation and has published more than 150 papers in the field of computational design of advanced battery materials and next-generation clean energy storage solutions. He serves as coordinator of the Battery Interface Genome—Materials Acceleration Platform (BIG-MAP) project and as member of the executive board of BATTERY2030+.
Patrik Johansson received his Ph.D. in Inorganic Chemistry in 1998 from Uppsala University, Sweden, with a thesis on polymer electrolytes. After a postdoc at Northwestern University, IL, USA, he returned to Sweden and Chalmers University of Technology where he is Full Professor in Physics since 2016 and leads a group of ca. 10 Ph.D.’s and postdocs. He is codirector of Alistore-ERI and vice-director of the Graphene Flagship. He has for >25 years focused on fundamental understanding of new materials at the molecular scale alongside battery concept development and real battery performance, especially for a wide range of electrolytes. A special interest is to combine computational and experimental methods to explore next generation batteries. In 2015, he won the Open Innovation Contest on Energy Storage arranged by BASF for his new ideas on Al-battery technology (prize sum 100,000€), and in 2020, he received the “l’Ordre des Palmes Académiques, Grade d’Officier” by the French Ministry of Education for his efforts to strengthen academic cooperation between Sweden and France.
Alejandro A. Franco (born in 1977 in Bahía Blanca, Argentina) received his Ph.D. diploma in 2005 from Université Claude Bernard Lyon 1, France, with his thesis dealing with the multiscale modeling of polymer electrolyte fuel cells. He was a permanent research Engineer at CEA-Grenoble in 2006–2012; since 2013, he has been Full Professor at Université de Picardie Jules Verne in Amiens, France, where he leads a group of 18 MSc., Ph.D., and postdoc students. Since 2016 he has been a Junior Member of the Institut Universitaire de France. He is the leader of the Theory Open Platform at the ALISTORE European Research Institute and Chairman of the group “Digitalization, Measurement Methods and Quality” in the European Li-Planet Network on battery manufacturing. His main research interest is about electrochemical energy devices at the crossroads between physics, chemistry, and digital sciences. He holds an ERC (European Research Council) grant for his project “ARTISTIC” dealing with the development of a digital twin of battery manufacturing encompassing multiscale physical modeling and artificial intelligence. He has been/is involved in several international projects (e.g. EU HELIS, EU POROUS4APP, EU SONAR, EU BIG-MAP). He also develops virtual and augmented reality tools for battery education and research. For the latter, in 2019 he received one of the French National Awards for Pedagogy Innovation (Prize PEPS 2019).
Supporting Information Available
The Supporting Information is available free of charge at https://pubs.acs.org/doi/10.1021/acs.chemrev.1c00108.
Tables summarizing the most relevant articles discussed along this manuscript (PDF)
The authors declare no competing financial interest.
Supplementary Material
References
- https://www.ipcc.ch/sr15/ (accessed November 2020).
- Liu Z.; Ciais P.; Deng Z.; Lei R.; Davis S. J.; Feng S.; Zheng B.; Cui D.; Dou X.; Zhu B.; Guo R.; Ke P.; Sun T.; Lu C.; He P.; Wang Y.; Yue X.; Wang Y.; Lei Y.; Zhou H.; Cai Z.; Wu Y.; Guo R.; Han T.; Xue J.; Boucher O.; Boucher E.; Chevallier F.; Tanaka K.; Wei Y.; Zhong H.; Kang C.; Zhang N.; Chen B.; Xi F.; Liu M.; Bréon F. M.; Lu Y.; Zhang Q.; Guan D.; Gong P.; Kammen D. M.; He K.; Schellnhuber H. J. Near-Real-Time Monitoring of Global CO2 Emissions Reveals the Effects of the COVID-19 Pandemic. Nat. Commun. 2020, 11, 5172. 10.1038/s41467-020-18922-7. [DOI] [PMC free article] [PubMed] [Google Scholar]
- https://www.iea.org/data-and-statistics/charts/global-energy-related-co2-emissions-1990-2020 (accessed May 2021).
- Armstrong G. The Li-Ions Share. Nat. Chem. 2019, 11, 1076. 10.1038/s41557-019-0386-7. [DOI] [PubMed] [Google Scholar]
- https://www.iea.org/reports/global-ev-outlook-2021 (accessed May 2021).
- Placke T.; Kloepsch R.; Dühnen S.; Winter M. Lithium Ion, Lithium Metal, and Alternative Rechargeable Battery Technologies: The Odyssey for High Energy Density. J. Solid State Electrochem. 2017, 21, 1939–1964. 10.1007/s10008-017-3610-7. [DOI] [Google Scholar]
- https://ec.europa.eu/info/funding-tenders/opportunities/portal/screen/opportunities/topic-details/lc-bat-6-2019 (accessed March 2020).
- Aspuru-Guzik A.; Persson K.. Materials Acceleration Platform: Accelerating Advanced Energy Materials Discovery by Integrating High-Throughput Methods and Artificial Intelligence; Canadian Institute for Advanced Research: 2018. [Google Scholar]
- Mistry A.; Franco A. A.; Cooper S. J.; Roberts S. A.; Viswanathan V. How Machine Learning Will Revolutionize Electrochemical Sciences. ACS Energy Lett. 2021, 1422–1431. 10.1021/acsenergylett.1c00194. [DOI] [PMC free article] [PubMed] [Google Scholar]
- Walsh A. The Quest for New Functionality. Nat. Chem. 2015, 7, 274–275. 10.1038/nchem.2213. [DOI] [PubMed] [Google Scholar]
- https://www.seagate.com/fr/fr/datasphere-2021/ (accessed August 12, 2021).
- https://www.basf.com/global/en/who-we-are/innovation/our-innovations/battery-materials.html (accessed August 12, 2021).
- https://www.energie-rs2e.com/en (accessed March 2020).
- Wilkinson M. D.; Dumontier M.; Aalbersberg Ij. J.; Appleton G.; Axton M.; Baak A.; Blomberg N.; Boiten J. W.; da Silva Santos L. B.; Bourne P. E.; Bouwman J.; Brookes A. J.; Clark T.; Crosas M.; Dillo I.; Dumon O.; Edmunds S.; Evelo C. T.; Finkers R.; Gonzalez-Beltran A.; Gray A. J. G.; Groth P.; Goble C.; Grethe J. S.; Heringa J.; t Hoen P. A. C.; Hooft R.; Kuhn T.; Kok R.; Kok J.; Lusher S. J.; Martone M. E.; Mons A.; Packer A. L.; Persson B.; Rocca-Serra P.; Roos M.; van Schaik R.; Sansone S. A.; Schultes E.; Sengstag T.; Slater T.; Strawn G.; Swertz M. A.; Thompson M.; Van Der Lei J.; Van Mulligen E.; Velterop J.; Waagmeester A.; Wittenburg P.; Wolstencroft K.; Zhao J.; Mons B. The FAIR Guiding Principles for Scientific Data Management and Stewardship. Sci. Data 2016, 3, 160018. 10.1038/sdata.2016.18. [DOI] [PMC free article] [PubMed] [Google Scholar]
- https://www.erc-artistic.eu/ (accessed July 2021).
- https://defacto-project.eu/project-defacto/ (accessed November 2020).
- https://www.big-map.eu/ (accessed November 2020).
- Boolean search performed in Web of Science on May 2021 searching for the keywords “lithium” and “ion” AND “batteries”.
- Vegge T.; Tarascon J.; Edström K. Adv. Energy Mater. 2021, 11, 2100362. 10.1002/aenm.202100362. [DOI] [Google Scholar]
- El-Bousiydy H.; Lombardo T.; Primo E. N.; Duquesnoy M.; Morcrette M.; Johansson P.; Simon P.; Grimaud A.; Franco A. A. What Can Text Mining Tell Us about Lithium-Ion Battery Researchers’ Habits?. Batter. Supercaps 2021, 4, 758–766. 10.1002/batt.202000288. [DOI] [Google Scholar]
- Duquesnoy M.; Lombardo T.; Chouchane M.; Primo E. N. Data-Driven Assessment of Electrode Calendering Process by Combining Experimental Results, in Silico Mesostructures Generation and Machine Learning. J. Power Sources 2020, 480, 229103. 10.1016/j.jpowsour.2020.229103. [DOI] [Google Scholar]
- Gao X.; Liu X.; He R.; Wang M.; Xie W.; Brandon N. P.; Wu B.; Ling H.; Yang S. Designed High-Performance Lithium-Ion Battery Electrodes Using a Novel Hybrid Model-Data Driven Approach. Energy Storage Mater. 2021, 36, 435–458. 10.1016/j.ensm.2021.01.007. [DOI] [Google Scholar]
- Bao J.; Murugesan V.; Kamp C. J.; Shao Y.; Yan L.; Wang W. Machine Learning Coupled Multi-Scale Modeling for Redox Flow Batteries. Adv. Theory Simulations 2020, 3, 1900167. 10.1002/adts.201900167. [DOI] [Google Scholar]
- Berecibar M. Machine-Learning Techniques Used to Accurately Predict Battery Life. Nature 2019, 568, 325–326. [DOI] [PubMed] [Google Scholar]
- Li Y.; Liu K.; Foley A. M.; Zülke A.; Berecibar M.; Nanini-Maury E.; Van Mierlo J.; Hoster H. E. Data-Driven Health Estimation and Lifetime Prediction of Lithium-Ion Batteries: A Review. Renewable Sustainable Energy Rev. 2019, 113, 109254. 10.1016/j.rser.2019.109254. [DOI] [Google Scholar]
- Rezvanizaniani S. M.; Liu Z.; Chen Y.; Lee J. Review and Recent Advances in Battery Health Monitoring and Prognostics Technologies for Electric Vehicle (EV) Safety and Mobility. J. Power Sources 2014, 256, 110–124. 10.1016/j.jpowsour.2014.01.085. [DOI] [Google Scholar]
- Chen C.; Zuo Y.; Ye W.; Li X.; Deng Z.; Ong S. P. A Critical Review of Machine Learning of Energy Materials. Adv. Energy Mater. 2020, 10, 1903242. 10.1002/aenm.201903242. [DOI] [Google Scholar]
- Gao T.; Lu W. Machine Learning toward Advanced Energy Storage Devices and Systems. iScience 2021, 24, 101936. 10.1016/j.isci.2020.101936. [DOI] [PMC free article] [PubMed] [Google Scholar]
- Xu H.; Zhu J.; Finegan D. P.; Zhao H.; Lu X.; Li W.; Hoffman N.; Bertei A.; Shearing P.; Bazant M. Z. Guiding the Design of Heterogeneous Electrode Microstructures for Li-Ion Batteries: Microscopic Imaging, Predictive Modeling, and Machine Learning. Adv. Energy Mater. 2021, 11, 2003908. 10.1002/aenm.202003908. [DOI] [Google Scholar]
- Russell S.; Norvig P.. Artificial Intelligence: A Modern Approach, 4th ed.; Pearson Education, Inc.: London, United Kingdom, 2020. [Google Scholar]
- Goodfellow I.; Bengio Y.; Courville A.. Deep Learning; The MIT Press: 2016. [Google Scholar]
- Hastie T.; Tibshirani R.; Friedman J.. The Elements of Statistical Learning, 2nd ed.; Springer: 2017. [Google Scholar]
- Mitchell T.Machine Learning; McGraw Hill: 1997. [Google Scholar]
- Wilkins N.Artificial Intelligence: An Essential Beginner’s Guide to AI, Machine Learning, Robotics, The Internet of Things, Neural Networks, Deep Learning, Reinforcement Learning, and Our Future; Ch Publications: 2019. [Google Scholar]
- Artificial Life: An Overview; Langton C. G., Ed.; Bradford Book: 1995. [Google Scholar]
- Ensemble Machine Learning Methods and Applications; Zhang Cha Ma Y., Ed.; Springer: 2012. [Google Scholar]
- Bishop C. M.Pattern Recoginiton and Machine Learning; Springer-Verlag: New York, 2006. [Google Scholar]
- Witten I. H.; Frank H.. Data Mining: Practical Machine Learning Tools and Techniques with Java Implementations, 1st ed.; Morgan Kaufmann: 1999. [Google Scholar]
- Supervised and Unsupervised Learning for Data Science; Berry M. W., Mohamed A. H., Yap B. W., Eds.; Springer: 2020. [Google Scholar]
- Concept Formation: Knowledge and Experience in Unsupervised Learning, 1st ed.; Fisher D. H., Pazzani M. J., Langley P., Eds.; Morgan Kaufmann Pub: 1991. [Google Scholar]
- Domingos P.The Master Algorithm: How the Quest for the Ultimate Learning Machine Will Remake Our World; 2015. [Google Scholar]
- Campbell M.; Hoane A. J.; Hsu F. H. Deep Blue. Artif. Intell. 2002, 134, 57–83. 10.1016/S0004-3702(01)00129-1. [DOI] [Google Scholar]
- Silver D.; Schrittwieser J.; Simonyan K.; Antonoglou I.; Huang A.; Guez A.; Hubert T.; Baker L.; Lai M.; Bolton A.; Chen Y.; Lillicrap T.; Hui F.; Sifre L.; Van Den Driessche G.; Graepel T.; Hassabis D. Mastering the Game of Go without Human Knowledge. Nature 2017, 550, 354–359. 10.1038/nature24270. [DOI] [PubMed] [Google Scholar]
- https://www.nytimes.com/2010/06/20/magazine/20Computer-t.html (accessed May 2021).
- Robotics and Artificial Intelligence; Brady M., Gerhardt L. A., Davidson H. F., Eds.; Springer-Verlag New York Inc, 2012. [Google Scholar]
- Chen C.; Seff A.; Kornhauser A.; Xiao J. DeepDriving: Learning Affordance for Direct Perception in Autonomous Driving. Proc. IEEE Int. Conf. Comput. Vis. 2015, 2722–2730. 10.1109/ICCV.2015.312. [DOI] [Google Scholar]
- Raza M. Q.; Khosravi A. A Review on Artificial Intelligence Based Load Demand Forecasting Techniques for Smart Grid and Buildings. Renewable Sustainable Energy Rev. 2015, 50, 1352–1372. 10.1016/j.rser.2015.04.065. [DOI] [Google Scholar]
- Venkatasubramanian V. The Promise of Artificial Intelligence in Chemical Engineering: Is It Here, Finally?. AIChE J. 2019, 65, 466–478. 10.1002/aic.16489. [DOI] [Google Scholar]
- Li J.; Tu Y.; Liu R.; Lu Y.; Zhu X. Toward “On-Demand” Materials Synthesis and Scientific Discovery through Intelligent Robots. Adv. Sci. 2020, 7, 1901957. 10.1002/advs.201901957. [DOI] [PMC free article] [PubMed] [Google Scholar]
- Butler K. T.; Davies D. W.; Cartwright H.; Isayev O.; Walsh A. Machine Learning for Molecular and Materials Science. Nature 2018, 559, 547–555. 10.1038/s41586-018-0337-2. [DOI] [PubMed] [Google Scholar]
- Schneider P.; Walters W. P.; Plowright A. T.; Sieroka N.; Listgarten J.; Goodnow R. A.; Fisher J.; Jansen J. M.; Duca J. S.; Rush T. S.; Zentgraf M.; Hill J. E.; Krutoholow E.; Kohler M.; Blaney J.; Funatsu K.; Luebkemann C.; Schneider G. Rethinking Drug Design in the Artificial Intelligence Era. Nat. Rev. Drug Discovery 2020, 19, 353–364. 10.1038/s41573-019-0050-3. [DOI] [PubMed] [Google Scholar]
- Tkatchenko A. Machine Learning for Chemical Discovery. Nat. Commun. 2020, 11, 4125. 10.1038/s41467-020-17844-8. [DOI] [PMC free article] [PubMed] [Google Scholar]
- Laird J. E. Research in Human-Level AI Using Computer Games. Commun. ACM 2002, 45, 32. 10.1145/502269.502290. [DOI] [Google Scholar]
- Silva J. C. F.; Teixeira R. M.; Silva F. F.; Brommonschenkel S. H.; Fontes E. P. B. Machine Learning Approaches and Their Current Application in Plant Molecular Biology: A Systematic Review. Plant Sci. 2019, 284, 37–47. 10.1016/j.plantsci.2019.03.020. [DOI] [PubMed] [Google Scholar]
- Schwaller P.; Laino T. Data-Driven Learning Systems for Chemical Reaction Prediction: An Analysis of Recent Approaches. ACS Symp. Ser. 2019, 1326, 61–79. 10.1021/bk-2019-1326.ch004. [DOI] [Google Scholar]
- Merlet J.-P. A Historical Perspective of Robotics. Springer, Dordr. 2000, 379–386. 10.1007/978-94-015-9554-4_43. [DOI] [Google Scholar]
- Cohen J.Human Robots in Myth and Science; George Allen & Unwin, 1966. [Google Scholar]
- Nilsson N. J.The Quest for Artificial Intelligence A History of Ideas and Achievements.; Cambridge University Press, 2010. [Google Scholar]
- Turing A. M. Computing Machinery and Intelligence. MIND a Quartely Rev. Psychol. Philos. 1950, LIX, 433–460. 10.1093/mind/LIX.236.433. [DOI] [Google Scholar]
- McCarthy J.; Minsky M. L.; Rochester N.; Shannon C. E. A Proposal for the Dartmouth Summer Research Project on Artificial Intelligence. AI Mag. 2006, 27, 12–14. 10.1609/aimag.v27i4.1904. [DOI] [Google Scholar]
- Ullman S. Using Neuroscience to Develop Artificial Intelligence. Science (Washington, DC, U. S.) 2019, 363, 692–693. 10.1126/science.aau6595. [DOI] [PubMed] [Google Scholar]
- Searle J. R. Minds, Brains, and Programs. Behav. Brain Sci. 1980, 3, 417–457. 10.1017/S0140525X00005756. [DOI] [Google Scholar]
- https://www.forbes.com/sites/peterhigh/2017/10/30/carnegie-mellon-dean-of-computer-science-on-the-future-of-ai/?sh=704afc022197 (accessed May 2021).
- Silver D.; Huang A.; Maddison C. J.; Guez A.; Sifre L.; Van Den Driessche G.; Schrittwieser J.; Antonoglou I.; Panneershelvam V.; Lanctot M.; Dieleman S.; Grewe D.; Nham J.; Kalchbrenner N.; Sutskever I.; Lillicrap T.; Leach M.; Kavukcuoglu K.; Graepel T.; Hassabis D. Mastering the Game of Go with Deep Neural Networks and Tree Search. Nature 2016, 529, 484–489. 10.1038/nature16961. [DOI] [PubMed] [Google Scholar]
- Severson K. A.; Attia P. M.; Jin N.; Perkins N.; Jiang B.; Yang Z.; Chen M. H.; Aykol M.; Herring P. K.; Fraggedakis D.; Bazant M. Z.; Harris S. J.; Chueh W. C.; Braatz R. D. Data-Driven Prediction of Battery Cycle Life before Capacity Degradation. Nat. Energy 2019, 4, 383–391. 10.1038/s41560-019-0356-8. [DOI] [Google Scholar]
- Petrich L.; Westhoff D.; Feinauer J.; Finegan D. P.; Daemi S. R.; Shearing P. R.; Schmidt V. Crack Detection in Lithium-Ion Cells Using Machine Learning. Comput. Mater. Sci. 2017, 136, 297–305. 10.1016/j.commatsci.2017.05.012. [DOI] [Google Scholar]
- Li S.; Li J.; He H.; Wang H. Lithium-Ion Battery Modeling Based on Big Data. Energy Procedia 2019, 159, 168–173. 10.1016/j.egypro.2018.12.046. [DOI] [Google Scholar]
- Shao Z.; Er M. J. Efficient Leave-One-Out Cross-Validation-Based Regularized Extreme Learning Machine. Neurocomputing 2016, 194, 260–270. 10.1016/j.neucom.2016.02.058. [DOI] [PubMed] [Google Scholar]
- Russell S.; Norvig P.. Artificial Intelligence A Modern Approach, 4th ed.; Pearson Education, Inc., 2020. [Google Scholar]
- Hastie T.; Tibshirani R.; Friedman J.. The Elements of Statistical Learning, 2nd ed.; Springer, 2017. [Google Scholar]
- Raissi M.; Perdikaris P.; Karniadakis G. E. Physics Informed Deep Learning (Part I): Data-Driven Discovery of Nonlinear Partial Differential Equations. arXiv 2017, 1–22. [Google Scholar]
- Lu L.; Meng X.; Mao Z.; Karniadakis G. E. DeepXDE: A Deep Learning Library for Solving Differential Equations. SIAM Rev. 2021, 63, 208–228. 10.1137/19M1274067. [DOI] [Google Scholar]
- Han J.; Jentzen A.; Weinan E. Solving High-Dimensional Partial Differential Equations Using Deep Learning. Proc. Natl. Acad. Sci. U. S. A. 2018, 115, 8505–8510. 10.1073/pnas.1718942115. [DOI] [PMC free article] [PubMed] [Google Scholar]
- Qian E.; Kramer B.; Peherstorfer B.; Willcox K. Lift & Learn: Physics-Informed Machine Learning for Large-Scale Nonlinear Dynamical Systems. Phys. D 2020, 406, 132401. 10.1016/j.physd.2020.132401. [DOI] [Google Scholar]
- Zhao H.; Storey B. D.; Braatz R. D.; Bazant M. Z. Learning the Physics of Pattern Formation from Images. Phys. Rev. Lett. 2020, 124, 060201. 10.1103/PhysRevLett.124.060201. [DOI] [PubMed] [Google Scholar]
- Wang R.; Kashinath K.; Mustafa M.; Albert A.; Yu R. Towards Physics-Informed Deep Learning for Turbulent Flow Prediction. arXiv 2020, 1457–1466. 10.1145/3394486.3403198. [DOI] [Google Scholar]
- Rynne O.; Dubarry M.; Molson C.; Nicolas E.; Lepage D.; Prébé A.; Aymé-Perrot D.; Rochefort D.; Dollé M. Exploiting Materials to Their Full Potential, a Li-Ion Battery Electrode Formulation Optimization Study. ACS Appl. Energy Mater. 2020, 3, 2935. 10.1021/acsaem.0c00015. [DOI] [Google Scholar]
- Li J.; Arbizzani C.; Kjelstrup S.; Xiao J.; Xia Y.; Yu Y.; Yang Y.; Belharouak I.; Zawodzinski T.; Myung S.-T.; Raccichini R.; Passerini S. Good Practice Guide for Papers on Batteries for the Journal of Power Sources. J. Power Sources 2020, 452 (xxxx), 227824. 10.1016/j.jpowsour.2020.227824. [DOI] [Google Scholar]
- Arbizzani C.; Yu Y.; Li J.; Xiao J.; Xia Y.-y.; Yang Y.; Santato C.; Raccichini R.; Passerini S. Good Practice Guide for Papers on Supercapacitors and Related Hybrid Capacitors for the Journal of Power Sources. J. Power Sources 2020, 450, 227636. 10.1016/j.jpowsour.2019.227636. [DOI] [Google Scholar]
- Finegan D. P.; Zhu J.; Feng X.; Keyser M.; Ulmefors M.; Li W.; Bazant M. Z.; Cooper S. J. The Application of Data-Driven Methods and Physics-Based Learning for Improving Battery Safety. Joule 2021, 5, 316. 10.1016/j.joule.2020.11.018. [DOI] [Google Scholar]
- Saltelli A. Sensitivity Analysis for Importance Assessment. Risk Anal. 2002, 22, 579–590. 10.1111/0272-4332.00040. [DOI] [PubMed] [Google Scholar]
- https://www.investopedia.com/terms/r/r-squared.asp (accessed November 2020).
- Artrith N.; Butler K. T.; Coudert F. X.; Han S.; Isayev O.; Jain A.; Walsh A. Best Practices in Machine Learning for Chemistry. Nat. Chem. 2021, 13, 505–508. 10.1038/s41557-021-00716-z. [DOI] [PubMed] [Google Scholar]
- Aiken L. S.; West S. G.; Pitts S. C.; Baraldi A. N.; Wurpts I. C. Multiple Linear Regression. Handb. Psychol. 2012, 511–542. 10.1002/9781118133880.hop202018. [DOI] [Google Scholar]
- Kalejahi B. M.; Bahram M.; Naseri A.; Bahari S.; Hasani M. Multivariate Curve Resolution-Alternating Least Squares (MCR-ALS) and Central Composite Experimental Design for Monitoring and Optimization of Simultaneous Removal of Some Organic Dyes. J. Iran. Chem. Soc. 2014, 11, 241–248. 10.1007/s13738-013-0293-6. [DOI] [Google Scholar]
- Tibshirani R. Regression Shrinkage and Selection Via the Lasso. J. R. Stat. Soc. Ser. B 1996, 58, 267–288. 10.1111/j.2517-6161.1996.tb02080.x. [DOI] [Google Scholar]
- Douak F.; Melgani F.; Benoudjit N. Kernel Ridge Regression with Active Learning for Wind Speed Prediction. Appl. Energy 2013, 103, 328–340. 10.1016/j.apenergy.2012.09.055. [DOI] [Google Scholar]
- Efron B.; Hastie T.; Johnstone J.; Tibshirani R. Least Angle Regression. Ann. Stat. 2004, 32, 407–499. 10.1214/009053604000000067. [DOI] [Google Scholar]
- Ouyang R.; Curtarolo S.; Ahmetcik E.; Scheffler M.; Ghiringhelli L. M. SISSO: A Compressed-Sensing Method for Identifying the Best Low-Dimensional Descriptor in an Immensity of Offered Candidates. Phys. Rev. Mater. 2018, 2, 083802. 10.1103/PhysRevMaterials.2.083802. [DOI] [Google Scholar]
- Friedman J. H. Multivariate Adaptive Regresssion Splines. Ann. Stat. 1991, 19, 1–67. 10.1214/aos/1176347963. [DOI] [Google Scholar]
- Newman M. E. J. Fast Algorithm for Detecting Community Structure in Networks. Phys. Rev. E - Stat. Physics, Plasmas, Fluids, Relat. Interdiscip. Top. 2004, 69, 5. 10.1103/PhysRevE.69.066133. [DOI] [PubMed] [Google Scholar]
- Tshitoyan V.; Dagdelen J.; Weston L.; Dunn A.; Rong Z.; Kononova O.; Persson K. A.; Ceder G.; Jain A. Unsupervised Word Embeddings Capture Latent Knowledge from Materials Science Literature. Nature 2019, 571, 95–98. 10.1038/s41586-019-1335-8. [DOI] [PubMed] [Google Scholar]
- Andrews J. L. Addressing Overfitting and Underfitting in Gaussian Model-Based Clustering. Comput. Stat. Data Anal. 2018, 127, 160–171. 10.1016/j.csda.2018.05.015. [DOI] [Google Scholar]
- Kennedy J.; Eberhart R.. Particle Swarm Optimization. Proceedings of ICNN‘95 - International Conference on Neural Networks; IEEE Press: 1995; pp 1942–1948.
- Karaboga D.; Gorkemli B.; Ozturk C.; Karaboga N. A Comprehensive Survey: Artificial Bee Colony (ABC) Algorithm and Applications. Artif. Intell. Rev. 2014, 42, 21–57. 10.1007/s10462-012-9328-0. [DOI] [Google Scholar]
- Leardi R. Genetic Algorithms in Chemometrics and Chemistry: A Review. J. Chemom. 2001, 15, 559–569. 10.1002/cem.651. [DOI] [Google Scholar]
- Bengio Y.; Grandvalet Y. No Unbiased Estimator of the Variance of K-Fold Cross-Validation. J. Mach. Learn. Res. 2004, (5), 1089–1105. [Google Scholar]
- Zeng X.; Martinez T. R. Distribution-Balanced Stratified Cross-Validation for Accuracy Estimation. J. Exp. Theor. Artif. Intell. 2000, 12, 1–12. 10.1080/095281300146272. [DOI] [Google Scholar]
- Safavian S. R.; Landgrebe D. A Survey of Decision Tree Classifier Methodology. IEEE Trans. Syst. Man Cybern. 1991, 21, 660–674. 10.1109/21.97458. [DOI] [Google Scholar]
- Jeudin J.-C.Les Créatures Artificielles: Des Automates Aux Mondes Virtuels; Odile Jacob Edition, 2008. [Google Scholar]
- LeCun Y.; Bengio Y.; Hinton G. Deep Learning. Nature 2015, 521, 436–444. 10.1038/nature14539. [DOI] [PubMed] [Google Scholar]
- Gal Y.; Ghahramani Z.. Bayesian Convolutional Neural Networks with Bernoulli Approximate Variational Inference.. 2015, arXiv:1506.02158. arXiv.org e-Print archive. https://arxiv.org/abs/1506.02158.
- Alexandridis A. K.; Zapranis A. D. Wavelet Neural Networks: A Practical Guide. Neural Networks 2013, 42, 1–27. 10.1016/j.neunet.2013.01.008. [DOI] [PubMed] [Google Scholar]
- Gregor K.; Danihelka I.; Graves A.; Rezende D. J.; Wierstra D. DRAW: A Recurrent Neural Network for Image Generation. 32nd Int. Conf. Mach. Learn. ICML 2015 2015, 2, 1462–1471. [Google Scholar]
- Zhu S.; He C.; Zhao N.; Sha J. Data-Driven Analysis on Thermal Effects and Temperature Changes of Lithium-Ion Battery. J. Power Sources 2021, 482, 228983. 10.1016/j.jpowsour.2020.228983. [DOI] [Google Scholar]
- Huang G.-B.; Wang D. H.; Lan Y. Extreme Learning Machines: A Survey. Int. J. Mach. Learn. Cybern. 2011, 2, 107–122. 10.1007/s13042-011-0019-y. [DOI] [Google Scholar]
- Turetskyy A.; Thiede S.; Thomitzek M.; von Drachenfels N.; Pape T.; Herrmann C. Toward Data-Driven Applications in Lithium-Ion Battery Cell Manufacturing. Energy Technol. 2020, 8, 1900136. 10.1002/ente.201900136. [DOI] [Google Scholar]
- Mashreghi Z.; Haziza D.; Léger C. A Survey of Bootstrap Methods in Finite Population Sampling. Stat. Surv. 2016, 10, 1–52. 10.1214/16-SS113. [DOI] [Google Scholar]
- Chen Z.; Li J.; Wei L. A Multiple Kernel Support Vector Machine Scheme for Feature Selection and Rule Extraction from Gene Expression Data of Cancer Tissue. Artif. Intell. Med. 2007, 41, 161–175. 10.1016/j.artmed.2007.07.008. [DOI] [PubMed] [Google Scholar]
- Wu C. H.; Ho J. M.; Lee D. T. Travel-Time Prediction with Support Vector Regression. IEEE Trans. Intell. Transp. Syst. 2004, 5, 276–281. 10.1109/TITS.2004.837813. [DOI] [Google Scholar]
- Suykens J. A. K.; Van Gestel T.; De Brabanter J.; De Moor B.; Vandewalle J.. Least Squares Support Vector Machines; World Scientific: 2002. 10.1142/5089. [DOI] [Google Scholar]
- Bishop C. M.; Tipping M. E.. Variational Relevance Vector Machines. 2000, arXiv:1301.3838. arXiv.org e-Print archive. https://arxiv.org/abs/1301.3838.
- Zhang H. The Optimality of Naive Bayes. Proc. Seventeenth Int. Florida Artif. Intell. Res. Soc. Conf. FLAIRS 2004 2004, 2, 562–567. [Google Scholar]
- Ghahramani Z.; Rasmussen C. E. Bayesian Monte Carlo. Adv. Neural Inf. Process. Syst. 2002, (1), 489–496. [Google Scholar]
- Rasmussen C. E.; Williams C. K. I.. Gaussian Processes for Machine Learning; MIT Press: 2006. [Google Scholar]
- Bartók A. P.; Kondor R.; Csányi G. On Representing Chemical Environments. Phys. Rev. B: Condens. Matter Mater. Phys. 2013, 87, 184115. 10.1103/PhysRevB.87.184115. [DOI] [Google Scholar]
- Willatt M. J.; Musil F.; Ceriotti M. Atom-Density Representations for Machine Learning. J. Chem. Phys. 2019, 150, 154110. 10.1063/1.5090481. [DOI] [PubMed] [Google Scholar]
- Snoek J.; Larochelle H.; Adams R. P.. Practical Bayesian Optimization of Machine Learning Algorithms. 2012, arXiv:1206.2944. arXiv.org e-Print archive. https://arxiv.org/abs/1206.2944. [Google Scholar]
- Balakrishnama S.; Ganapathiraju A.. Linear Discriminant Analysis - A Brief Tutorial. Institute for Signal and Information Processing. 1998. [Google Scholar]
- Wright R. E.Logistic Regression. Reading and Understanding Multivariate Statistics; American Psychological Association: Washington, DC, 1995. [Google Scholar]
- Gayon-Lombardo A.; Mosser L.; Brandon N. P.; Cooper S. J. Pores for Thought: The Use of Generative Adversarial Networks for the Stochastic Reconstruction of 3D Multi-Phase Electrode Microstructures with Periodic Boundaries. npj Comput. Mater. 2020, 6, 82. 10.1038/s41524-020-0340-7. [DOI] [Google Scholar]
- Kench S.; Cooper S. J. Generating Three-Dimensional Structures from a Two-Dimensional Slice with Generative Adversarial Network-Based Dimensionality Expansion. Nat. Mach. Intell. 2021, 3, 299–305. 10.1038/s42256-021-00322-1. [DOI] [Google Scholar]
- Franco A. A. Escape from Flatland. Nat. Mach. Intell. 2021, 3, 277–278. 10.1038/s42256-021-00334-x. [DOI] [Google Scholar]
- Jennings P. C.; Lysgaard S.; Hummelshøj J. S.; Vegge T.; Bligaard T. Genetic Algorithms for Computational Materials Discovery Accelerated by Machine Learning. npj Comput. Mater. 2019, 5, 46. 10.1038/s41524-019-0181-4. [DOI] [Google Scholar]
- Noh J.; Kim J.; Stein H. S.; Sanchez-Lengeling B.; Gregoire J. M.; Aspuru-Guzik A.; Jung Y. Inverse Design of Solid-State Materials via a Continuous Representation. Matter 2019, 1, 1370–1384. 10.1016/j.matt.2019.08.017. [DOI] [Google Scholar]
- Sanchez-Lengeling B.; Aspuru-Guzik A. Inverse Molecular Design Using Machine Learning: Generative Models for Matter Engineering. Science (Washington, DC, U. S.) 2018, 361, 360–365. 10.1126/science.aat2663. [DOI] [PubMed] [Google Scholar]
- Dan Y.; Zhao Y.; Li X.; Li S.; Hu M.; Hu J. Generative Adversarial Networks (GAN) Based Efficient Sampling of Chemical Composition Space for Inverse Design of Inorganic Materials. npj Comput. Mater. 2020, 6, 84. 10.1038/s41524-020-00352-0. [DOI] [Google Scholar]
- Kim S.; Noh J.; Gu G. H.; Aspuru-Guzik A.; Jung Y. Generative Adversarial Networks for Crystal Structure Prediction. ACS Cent. Sci. 2020, 6, 1412–1420. 10.1021/acscentsci.0c00426. [DOI] [PMC free article] [PubMed] [Google Scholar]
- Bhowmik A.; Castelli I. E.; Garcia-Lastra J. M.; Jørgensen P. B.; Winther O.; Vegge T. A Perspective on Inverse Design of Battery Interphases Using Multi-Scale Modelling, Experiments and Generative Deep Learning. Energy Storage Mater. 2019, 21, 446–456. 10.1016/j.ensm.2019.06.011. [DOI] [Google Scholar]
- Noh J.; Gu G. H.; Kim S.; Jung Y. Machine-Enabled Inverse Design of Inorganic Solid Materials: Promises and Challenges. Chem. Sci. 2020, 11, 4871–4881. 10.1039/D0SC00594K. [DOI] [PMC free article] [PubMed] [Google Scholar]
- Ubuntu Forums. https://ubuntuforums.org/ (accessed August 12, 2021)
- Stack Overflow. https://stackoverflow.com/ (accessed August 12, 2021).
- W3Schools. https://www.w3schools.com/ (accessed August 12, 2021).
- Besley A.Monty Python’s Flying Circus: Hidden Treasures; Carlton Books Ltd: 2019. [Google Scholar]
- https://cran.r-project.org/ (accessed May 2021).
- https://cloud.google.com/ai-platform (accessed November 2020).
- https://azure.microsoft.com/fr-fr/services/machine-learning/ (accessed November 2020).
- https://www.ibm.com/fr-fr/products/deep-learning-platform (accessed November 2020).
- Jain A.; Hautier G.; Ong S. P.; Persson K. New Opportunities for Materials Informatics: Resources and Data Mining Techniques for Uncovering Hidden Relationships. J. Mater. Res. 2016, 31, 977–994. 10.1557/jmr.2016.80. [DOI] [Google Scholar]
- Liu Y.; Zhao T.; Ju W.; Shi S.; Shi S.; Shi S. Materials Discovery and Design Using Machine Learning. J. Mater. 2017, 3, 159–177. 10.1016/j.jmat.2017.08.002. [DOI] [Google Scholar]
- Lu W.; Xiao R.; Yang J.; Li H.; Zhang W. Data Mining-Aided Materials Discovery and Optimization. J. Mater. 2017, 3, 191–201. 10.1016/j.jmat.2017.08.003. [DOI] [Google Scholar]
- Ward L.; Wolverton C. Atomistic Calculations and Materials Informatics: A Review. Curr. Opin. Solid State Mater. Sci. 2017, 21, 167–176. 10.1016/j.cossms.2016.07.002. [DOI] [Google Scholar]
- Gu G. H.; Noh J.; Kim I.; Jung Y. Machine Learning for Renewable Energy Materials. J. Mater. Chem. A 2019, 7, 17096–17117. 10.1039/C9TA02356A. [DOI] [Google Scholar]
- Van Der Ven A.; Deng Z.; Banerjee S.; Ong S. P. Rechargeable Alkali-Ion Battery Materials: Theory and Computation. Chem. Rev. 2020, 120, 6977–7019. 10.1021/acs.chemrev.9b00601. [DOI] [PubMed] [Google Scholar]
- Barrett D. H.; Haruna A. Artificial Intelligence and Machine Learning for Targeted Energy Storage Solutions. Curr. Opin. Electrochem. 2020, 21, 160–166. 10.1016/j.coelec.2020.02.002. [DOI] [Google Scholar]
- Luo Z.; Yang X.; Wang Y.; Liu W.; Liu S.; Zhu Y.; Huang Z.; Zhang H.; Dou S.; Xu J.; Tian J.; Xu K.; Zhang X.; Hu W.; Deng Y. A Survey of Artificial Intelligence Techniques Applied in Energy Storage Materials R&D. Front. Energy Res. 2020, 10.3389/fenrg.2020.00116. [DOI] [Google Scholar]
- Deringer V. L. Modelling and Understanding Battery Materials with Machine-Learning-Driven Atomistic Simulations. J. Phys. Energy 2020, 2, 041003. 10.1088/2515-7655/abb011. [DOI] [Google Scholar]
- Shao Y.; Knijff L.; Dietrich F. M.; Hermansson K.; Zhang C. Modelling Bulk Electrolytes and Electrolyte Interfaces with Atomistic Machine Learning. Batter. Supercaps 2021, 4 (4), 585. 10.1002/batt.202000262. [DOI] [Google Scholar]
- Wang H.; Ji Y.; Li Y. Simulation and Design of Energy Materials Accelerated by Machine Learning. Wiley Interdiscip. Rev.: Comput. Mol. Sci. 2020, 10, e1421. 10.1002/wcms.1421. [DOI] [Google Scholar]
- Pollice R.; Gomes P.; Aldeghi M.; Hickman R. J.; Krenn M.; Lavigne C.; Addario M. L.; Nigam A.; Ser C. T.; Yao Z. Data-Driven Strategies for Accelerated Materials Design. Acc. Chem. Res. 2021, 54, 849. 10.1021/acs.accounts.0c00785. [DOI] [PMC free article] [PubMed] [Google Scholar]
- Fourches D.; Muratov E.; Tropsha A. Trust, but Verify: On the Importance of Chemical Structure Curation in Cheminformatics and QSAR Modeling Research. J. Chem. Inf. Model. 2010, 50, 1189–1204. 10.1021/ci100176x. [DOI] [PMC free article] [PubMed] [Google Scholar]
- Fourches D.; Muratov E.; Tropsha A. Trust, but Verify II: A Practical Guide to Chemogenomics Data Curation. J. Chem. Inf. Model. 2016, 56, 1243–1252. 10.1021/acs.jcim.6b00129. [DOI] [PMC free article] [PubMed] [Google Scholar]
- Nakayama M.; Kanamori K.; Nakano K.; Jalem R.; Takeuchi I.; Yamasaki H. Data-Driven Materials Exploration for Li-Ion Conductive Ceramics by Exhaustive and Informatics-Aided Computations. Chem. Rec. 2019, 19, 771–778. 10.1002/tcr.201800129. [DOI] [Google Scholar]
- Jalem R.; Nakayama M.; Noda Y.; Le T.; Takeuchi I.; Tateyama Y.; Yamazaki H. A General Representation Scheme for Crystalline Solids Based on Voronoi-Tessellation Real Feature Values and Atomic Property Data. Sci. Technol. Adv. Mater. 2018, 19, 231–242. 10.1080/14686996.2018.1439253. [DOI] [PMC free article] [PubMed] [Google Scholar]
- Isayev O.; Fourches D.; Muratov E. N.; Oses C.; Rasch K.; Tropsha A.; Curtarolo S. Materials Cartography: Representing and Mining Materials Space Using Structural and Electronic Fingerprints. Chem. Mater. 2015, 27, 735–743. 10.1021/cm503507h. [DOI] [Google Scholar]
- Rupp M.; Tkatchenko A.; Müller K. R.; Von Lilienfeld O. A. Fast and Accurate Modeling of Molecular Atomization Energies with Machine Learning. Phys. Rev. Lett. 2012, 108, 058301. 10.1103/PhysRevLett.108.058301. [DOI] [PubMed] [Google Scholar]
- Schütt K. T.; Glawe H.; Brockherde F.; Sanna A.; Müller K. R.; Gross E. K. U. How to Represent Crystal Structures for Machine Learning: Towards Fast Prediction of Electronic Properties. Phys. Rev. B: Condens. Matter Mater. Phys. 2014, 89, 205118. 10.1103/PhysRevB.89.205118. [DOI] [Google Scholar]
- Yang L.; Dacek S.; Ceder G. Proposed Definition of Crystal Substructure and Substructural Similarity. Phys. Rev. B: Condens. Matter Mater. Phys. 2014, 90, 054102. 10.1103/PhysRevB.90.054102. [DOI] [Google Scholar]
- Min K.; Choi B.; Park K.; Cho E. Machine Learning Assisted Optimization of Electrochemical Properties for Ni-Rich Cathode Materials. Sci. Rep. 2018, 8, 15778. 10.1038/s41598-018-34201-4. [DOI] [PMC free article] [PubMed] [Google Scholar]
- Kireeva N.; Pervov V. S. Materials Informatics Screening of Li-Rich Layered Oxide Cathode Materials with Enhanced Characteristics Using Synthesis Data. Batter. Supercaps 2020, 3, 427–438. 10.1002/batt.201900186. [DOI] [Google Scholar]
- Wang X.; Xiao R.; Li H.; Chen L. Quantitative Structure-Property Relationship Study of Cathode Volume Changes in Lithium Ion Batteries Using Ab-Initio and Partial Least Squares Analysis. J. Mater. 2017, 3, 178–183. 10.1016/j.jmat.2017.02.002. [DOI] [Google Scholar]
- Joshi R. P.; Eickholt J.; Li L.; Fornari M.; Barone V.; Peralta J. E. Machine Learning the Voltage of Electrode Materials in Metal-Ion Batteries. ACS Appl. Mater. Interfaces 2019, 11, 18494–18503. 10.1021/acsami.9b04933. [DOI] [PubMed] [Google Scholar]
- Allam O.; Cho B. W.; Kim K. C.; Jang S. S. Application of DFT-Based Machine Learning for Developing Molecular Electrode Materials in Li-Ion Batteries. RSC Adv. 2018, 8, 39414–39420. 10.1039/C8RA07112H. [DOI] [PMC free article] [PubMed] [Google Scholar]
- Attarian Shandiz M.; Gauvin R. Application of Machine Learning Methods for the Prediction of Crystal System of Cathode Materials in Lithium-Ion Batteries. Comput. Mater. Sci. 2016, 117, 270–278. 10.1016/j.commatsci.2016.02.021. [DOI] [Google Scholar]
- Jalem R.; Aoyama T.; Nakayama M.; Nogami M. Multivariate Method-Assisted Ab Initio Study of Olivine-Type LiMXO 4 (Main Group M 2+-X 5+ and M 3+-X 4+) Compositions as Potential Solid Electrolytes. Chem. Mater. 2012, 24, 1357–1364. 10.1021/cm3000427. [DOI] [Google Scholar]
- Jalem R.; Kimura M.; Nakayama M.; Kasuga T. Informatics-Aided Density Functional Theory Study on the Li Ion Transport of Tavorite-Type LiMTO4F (M3+-T5+, M2+-T6+). J. Chem. Inf. Model. 2015, 55, 1158–1168. 10.1021/ci500752n. [DOI] [PubMed] [Google Scholar]
- Jalem R.; Kanamori K.; Takeuchi I.; Nakayama M.; Yamasaki H.; Saito T. Bayesian-Driven First-Principles Calculations for Accelerating Exploration of Fast Ion Conductors for Rechargeable Battery Application. Sci. Rep. 2018, 8, 5845. 10.1038/s41598-018-23852-y. [DOI] [PMC free article] [PubMed] [Google Scholar]
- Katcho N. A.; Carrete J.; Reynaud M.; Rousse G.; Casas-Cabanas M.; Mingo N.; Rodríguez-Carvajal J.; Carrasco J. An Investigation of the Structural Properties of Li and Na Fast Ion Conductors Using High-Throughput Bond-Valence Calculations and Machine Learning. J. Appl. Crystallogr. 2019, 52, 148–157. 10.1107/S1600576718018484. [DOI] [Google Scholar]
- Kireeva N.; Pervov V. S. Materials Space of Solid-State Electrolytes: Unraveling Chemical Composition-Structure-Ionic Conductivity Relationships in Garnet-Type Metal Oxides Using Cheminformatics Virtual Screening Approaches. Phys. Chem. Chem. Phys. 2017, 19, 20904–20918. 10.1039/C7CP00518K. [DOI] [PubMed] [Google Scholar]
- Fujimura K.; Seko A.; Koyama Y.; Kuwabara A.; Kishida I.; Shitara K.; Fisher C. A. J.; Moriwake H.; Tanaka I. Accelerated Materials Design of Lithium Superionic Conductors Based on First-Principles Calculations and Machine Learning Algorithms. Adv. Energy Mater. 2013, 3, 980–985. 10.1002/aenm.201300060. [DOI] [Google Scholar]
- Zhang Y.; He X.; Chen Z.; Bai Q.; Nolan A. M.; Roberts C. A.; Banerjee D.; Matsunaga T.; Mo Y.; Ling C. Unsupervised Discovery of Solid-State Lithium Ion Conductors. Nat. Commun. 2019, 10, 5260. 10.1038/s41467-019-13214-1. [DOI] [PMC free article] [PubMed] [Google Scholar]
- Sendek A. D.; Yang Q.; Cubuk E. D.; Duerloo K. A. N.; Cui Y.; Reed E. J. Holistic Computational Structure Screening of More than 12 000 Candidates for Solid Lithium-Ion Conductor Materials. Energy Environ. Sci. 2017, 10, 306–320. 10.1039/C6EE02697D. [DOI] [Google Scholar]
- Sendek A. D.; Cheon G.; Pasta M.; Reed E. J. Quantifying the Search for Solid Li-Ion Electrolyte Materials by Anion: A Data-Driven Perspective. J. Phys. Chem. C 2020, 124, 8067–8079. 10.1021/acs.jpcc.9b10650. [DOI] [Google Scholar]
- Ahmad Z.; Xie T.; Maheshwari C.; Grossman J. C.; Viswanathan V. Machine Learning Enabled Computational Screening of Inorganic Solid Electrolytes for Suppression of Dendrite Formation in Lithium Metal Anodes. ACS Cent. Sci. 2018, 4, 996–1006. 10.1021/acscentsci.8b00229. [DOI] [PMC free article] [PubMed] [Google Scholar]
- Nakayama T.; Igarashi Y.; Sodeyama K.; Okada M. Material Search for Li-Ion Battery Electrolytes through an Exhaustive Search with a Gaussian Process. Chem. Phys. Lett. 2019, 731, 136622. 10.1016/j.cplett.2019.136622. [DOI] [Google Scholar]
- Sodeyama K.; Igarashi Y.; Nakayama T.; Tateyama Y.; Okada M. Liquid Electrolyte Informatics Using an Exhaustive Search with Linear Regression. Phys. Chem. Chem. Phys. 2018, 20, 22585–22591. 10.1039/C7CP08280K. [DOI] [PubMed] [Google Scholar]
- Heid E.; Fleck M.; Chatterjee P.; Schröder C.; Mackerell A. D. Toward Prediction of Electrostatic Parameters for Force Fields That Explicitly Treat Electronic Polarization. J. Chem. Theory Comput. 2019, 15, 2460–2469. 10.1021/acs.jctc.8b01289. [DOI] [PMC free article] [PubMed] [Google Scholar]
- Bedrov D.; Piquemal J. P.; Borodin O.; MacKerell A. D.; Roux B.; Schröder C. Molecular Dynamics Simulations of Ionic Liquids and Electrolytes Using Polarizable Force Fields. Chem. Rev. 2019, 119, 7940–7995. 10.1021/acs.chemrev.8b00763. [DOI] [PMC free article] [PubMed] [Google Scholar]
- Xie T.; France-Lanord A.; Wang Y.; Shao-Horn Y.; Grossman J. C. Graph Dynamical Networks for Unsupervised Learning of Atomic Scale Dynamics in Materials. Nat. Commun. 2019, 10, 2667. 10.1038/s41467-019-10663-6. [DOI] [PMC free article] [PubMed] [Google Scholar]
- Schütt K. T.; Sauceda H. E.; Kindermans P. J.; Tkatchenko A.; Müller K. R. SchNet - A Deep Learning Architecture for Molecules and Materials. J. Chem. Phys. 2018, 148, 241722. 10.1063/1.5019779. [DOI] [PubMed] [Google Scholar]
- Xu M.; Zhu T.; Zhang J. Z. H. Molecular Dynamics Simulation of Zinc Ion in Water with an Ab Initio Based Neural Network Potential. J. Phys. Chem. A 2019, 123, 6587–6595. 10.1021/acs.jpca.9b04087. [DOI] [PubMed] [Google Scholar]
- Ang S. J.; Wang W.; Schwalbe-Koda D.; Axelrod S.; Gomez-Bombarelli R. Active Learning Accelerates Ab Initio Molecular Dynamics on Pericyclic Reactive Energy Surfaces. Chem 2021, 7 (2), 738. 10.1016/j.chempr.2020.12.009. [DOI] [Google Scholar]
- Ellis L. D.; Buteau S.; Hames S. G.; Thompson L. M.; Hall D. S.; Dahn J. R. A New Method for Determining the Concentration of Electrolyte Components in Lithium-Ion Cells, Using Fourier Transform Infrared Spectroscopy and Machine Learning. J. Electrochem. Soc. 2018, 165, A256–A262. 10.1149/2.0861802jes. [DOI] [Google Scholar]
- Lu H.; Hu X.; Cao B.; Chai W.; Yan F. Prediction of Liquidus Temperature for Complex Electrolyte Systems Na3AlF6-AlF3-CaF2-MgF2-Al2O3-KF-LiF Based on the Machine Learning Methods. Chemom. Intell. Lab. Syst. 2019, 189, 110–120. 10.1016/j.chemolab.2019.03.015. [DOI] [Google Scholar]
- Häse F.; Roch L. M.; Aspuru-Guzik A. Next-Generation Experimentation with Self-Driving Laboratories. Trends Chem. 2019, 1, 282–291. 10.1016/j.trechm.2019.02.007. [DOI] [Google Scholar]
- Deringer V. L.; Csányi G. Machine Learning Based Interatomic Potential for Amorphous Carbon. Phys. Rev. B: Condens. Matter Mater. Phys. 2017, 95, 094203. 10.1103/PhysRevB.95.094203. [DOI] [Google Scholar]
- Li W.; Ando Y.; Minamitani E.; Watanabe S. Study of Li Atom Diffusion in Amorphous Li3PO4 with Neural Network Potential. J. Chem. Phys. 2017, 147, 214106. 10.1063/1.4997242. [DOI] [PubMed] [Google Scholar]
- Deng Z.; Chen C.; Li X. G.; Ong S. P. An Electrostatic Spectral Neighbor Analysis Potential for Lithium Nitride. npj Comput. Mater. 2019, 5, 75. 10.1038/s41524-019-0212-1. [DOI] [Google Scholar]
- Shao Y.; Hellström M.; Yllö A.; Mindemark J.; Hermansson K.; Behler J.; Zhang C. Temperature Effects on the Ionic Conductivity in Concentrated Alkaline Electrolyte Solutions. Phys. Chem. Chem. Phys. 2020, 22, 10426–10430. 10.1039/C9CP06479F. [DOI] [PubMed] [Google Scholar]
- Artrith N.; Urban A.; Ceder G. Constructing First-Principles Phase Diagrams of Amorphous LixSi Using Machine-Learning-Assisted Sampling with an Evolutionary Algorithm. J. Chem. Phys. 2018, 148, 241711. 10.1063/1.5017661. [DOI] [PubMed] [Google Scholar]
- Natarajan A. R.; Van der Ven A. Machine-Learning the Configurational Energy of Multicomponent Crystalline Solids. npj Comput. Mater. 2018, 4, 56. 10.1038/s41524-018-0110-y. [DOI] [Google Scholar]
- Chang J. H.; Kleiven D.; Melander M.; Akola J.; Garcia-Lastra J. M.; Vegge T. CLEASE: a versatile and user-friendly implementation of cluster expansion method. J. Phys.: Condens. Matter 2019, 31, 325901. 10.1088/1361-648X/ab1bbc. [DOI] [PubMed] [Google Scholar]
- Jørgensen P. B.; Bhowmik A.. DeepDFT: Neural Message Passing Network for Accurate Charge Density Prediction. 2020, arXiv:2011.03346. arXiv.org e-Print archive. https://arxiv.org/abs/2011.03346.
- Chen C.; Lu Z.; Ciucci F. Data Mining of Molecular Dynamics Data Reveals Li Diffusion Characteristics in Garnet Li7La3Zr2O12. Sci. Rep. 2017, 7, 40769. 10.1038/srep40769. [DOI] [PMC free article] [PubMed] [Google Scholar]
- Fleischauer M. D.; Topple J. M.; Dahn J. R. Combinatorial Investigations of Si-M (M = Cr + Ni, Fe, Mn) Thin Film Negative Electrode Materials. Electrochem. Solid-State Lett. 2005, 8, A137. 10.1149/1.1850395. [DOI] [Google Scholar]
- Roberts M.; Owen J. High-Throughput Method to Study the Effect of Precursors and Temperature, Applied to the Synthesis of LiNi1/3Co1/3Mn 1/3O2 for Lithium Batteries. ACS Comb. Sci. 2011, 13, 126–134. 10.1021/co100028m. [DOI] [PubMed] [Google Scholar]
- Yanase I.; Ohtaki T.; Watanabe M. Application of Combinatorial Process to LiCo1-XMnXO2 (0 ≤ X ≤ 0.2) Powder Synthesis. Solid State Ionics 2002, 151, 189–196. 10.1016/S0167-2738(02)00709-9. [DOI] [Google Scholar]
- Fujimoto K.; Kato T.; Ito S.; Inoue S.; Watanabe M. Development and Application of Combinatorial Electrostatic Atomization System “M-Ist Combi”. High-Throughput Preparation of Electrode Materials. Solid State Ionics 2006, 177, 2639–2642. 10.1016/j.ssi.2006.04.043. [DOI] [Google Scholar]
- Brown C. R.; McCalla E.; Watson C.; Dahn J. R. Combinatorial Study of the Li-Ni-Mn-Co Oxide Pseudoquaternary System for Use in Li-Ion Battery Materials Research. ACS Comb. Sci. 2015, 17, 381–391. 10.1021/acscombsci.5b00048. [DOI] [PubMed] [Google Scholar]
- Adhikari T.; Hebert A.; Adamič M.; Yao J.; Potts K.; McCalla E. Development of High-Throughput Methods for Sodium-Ion Battery Cathodes. ACS Comb. Sci. 2020, 22, 311–318. 10.1021/acscombsci.9b00181. [DOI] [PubMed] [Google Scholar]
- Roberts M. R.; Vitins G.; Owen J. R. High-Throughput Studies of Li1-XMgx/2FePO4 and LiFe1-YMgyPO4 and the Effect of Carbon Coating. J. Power Sources 2008, 179, 754–762. 10.1016/j.jpowsour.2008.01.034. [DOI] [Google Scholar]
- Song S.-W.; Striebel K. A.; Reade R. P.; Roberts G. A.; Cairns E. J. Electrochemical Studies of Nanoncrystalline Mg[Sub 2]Si Thin Film Electrodes Prepared by Pulsed Laser Deposition. J. Electrochem. Soc. 2003, 150, A121. 10.1149/1.1527937. [DOI] [Google Scholar]
- Dave A.; Mitchell J.; Kandasamy K.; Wang H.; Burke S.; Paria B.; Póczos B.; Whitacre J.; Viswanathan V. Autonomous Discovery of Battery Electrolytes with Robotic Experimentation and Machine Learning. Cell Reports Phys. Sci. 2020, 1, 100264. 10.1016/j.xcrp.2020.100264. [DOI] [Google Scholar]
- Beal M. S.; Hayden B. E.; Le Gall T.; Lee C. E.; Lu X.; Mirsaneh M.; Mormiche C.; Pasero D.; Smith D. C. A.; Weld A.; Yada C.; Yokoishi S. High Throughput Methodology for Synthesis, Screening, and Optimization of Solid State Lithium Ion Electrolytes. ACS Comb. Sci. 2011, 13, 375–381. 10.1021/co100075f. [DOI] [PubMed] [Google Scholar]
- Kim E.; Huang K.; Saunders A.; McCallum A.; Ceder G.; Olivetti E. Materials Synthesis Insights from Scientific Literature via Text Extraction and Machine Learning. Chem. Mater. 2017, 29, 9436–9444. 10.1021/acs.chemmater.7b03500. [DOI] [Google Scholar]
- www.synthesisproject.org (accessed November 2020).
- Jankowski P.; Lastra J. M. G.; Vegge T. Structure of Magnesium Chloride Complexes in Ethereal Systems: Computational Comparison of THF and Glymes as Solvents for Magnesium Battery Electrolytes. Batter. Supercaps 2020, 3, 1350. 10.1002/batt.202000168. [DOI] [Google Scholar]
- Liu T.-J.; Tiu C.; Chen L.-C.; Liu D.. The Influence of Slurry Rheology on Lithium-Ion Electrode Processing. In Printed Batteries; Lanceros-Méndez S., Costa C. M., Eds.; John Wiley & Sons Ltd.: 2018; pp 63–79. [Google Scholar]
- Boston Consulting Group Report. The Future of Battery Production for Electric Vehicles. https://www.bcg.com/publications/2018/future-battery-production-electric-vehicles (accessed September 2018).
- Thon C.; Finke B.; Kwade A.; Schilde C. Artificial Intelligence in Process Engineering. Adv. Intell. Syst. 2021, 3, 2000261. 10.1002/aisy.202000261. [DOI] [Google Scholar]
- Rynne O.; Dubarry M.; Molson C.; Lepage D.; Prébé A.; Aymé-Perrot D.; Rochefort D.; Dollé M. Designs of Experiments for Beginners—A Quick Start Guide for Application to Electrode Formulation. Batteries 2019, 5, 72. 10.3390/batteries5040072. [DOI] [Google Scholar]
- Kwade A.; Haselrieder W.; Leithoff R.; Modlinger A.; Dietrich F.; Droeder K. Current Status and Challenges for Automotive Battery Production Technologies. Nat. Energy 2018, 3, 290–300. 10.1038/s41560-018-0130-3. [DOI] [Google Scholar]
- Wood D. L.; Li J.; Daniel C. Prospects for Reducing the Processing Cost of Lithium Ion Batteries. J. Power Sources 2015, 275, 234–242. 10.1016/j.jpowsour.2014.11.019. [DOI] [Google Scholar]
- Westermeier M.; Reinhart G.; Steber M. Complexity Management for the Start-up in Lithium-Ion Cell Production. Procedia CIRP 2014, 20, 13–19. 10.1016/j.procir.2014.05.026. [DOI] [Google Scholar]
- Günther T.; Billot N.; Schuster J.; Schnell J.; Spingler F. B.; Gasteiger H. A. The Manufacturing of Electrodes: Key Process for the Future Success of Lithium-Ion Batteries. Adv. Mater. Res. 2016, 1140, 304–311. 10.4028/www.scientific.net/AMR.1140.304. [DOI] [Google Scholar]
- Knoche T.; Zinth V.; Schulz M.; Schnell J.; Gilles R.; Reinhart G. In Situ Visualization of the Electrolyte Solvent Filling Process by Neutron Radiography. J. Power Sources 2016, 331, 267–276. 10.1016/j.jpowsour.2016.09.037. [DOI] [Google Scholar]
- Knoche T.; Surek F.; Reinhart G. A Process Model for the Electrolyte Filling of Lithium-Ion Batteries. Procedia CIRP 2016, 41, 405–410. 10.1016/j.procir.2015.12.044. [DOI] [Google Scholar]
- Schnell J.; Nentwich C.; Endres F.; Kollenda A.; Distel F.; Knoche T.; Reinhart G. Data Mining in Lithium-Ion Battery Cell Production. J. Power Sources 2019, 413, 360–366. 10.1016/j.jpowsour.2018.12.062. [DOI] [Google Scholar]
- Kornas T.; Daub R.; Karamat M. Z.; S T.; Herrmann C. Data-and Expert-Driven Analysis of Cause-Effect Relationships in the Production of Lithium-Ion Batteries. IEEE 15th Int. Conf. Autom. Sci. Eng. 2019, 380–385. 10.1109/COASE.2019.8843185. [DOI] [Google Scholar]
- Hsu S. C.; Chien C. F. Hybrid Data Mining Approach for Pattern Extraction from Wafer Bin Map to Improve Yield in Semiconductor Manufacturing. Int. J. Prod. Econ. 2007, 107, 88–103. 10.1016/j.ijpe.2006.05.015. [DOI] [Google Scholar]
- Evans R.; Boreland M.. A Multivariate Approach to Utilizing Mid-Sequence Process Control Data. 2015 IEEE 42nd Photovolt. Spec. Conf. PVSC 2015 2015. 10.1109/PVSC.2015.7356283. [DOI] [Google Scholar]
- Schmidt O.; Thomitzek M.; Röder F.; Thiede S.; Herrmann C.; Krewer U. Modeling the Impact of Manufacturing Uncertainties on Lithium-Ion Batteries. J. Electrochem. Soc. 2020, 167, 060501. 10.1149/1945-7111/ab798a. [DOI] [Google Scholar]
- Brandt R. E.; Kurchin R. C.; Steinmann V.; Kitchaev D.; Roat C.; Levcenco S.; Ceder G.; Unold T.; Buonassisi T. Rapid Photovoltaic Device Characterization through Bayesian Parameter Estimation. Joule 2017, 1, 843–856. 10.1016/j.joule.2017.10.001. [DOI] [Google Scholar]
- Cunha R. P.; Lombardo T.; Primo E. N.; Franco A. A. Artificial Intelligence Investigation of NMC Cathode Manufacturing Parameters Interdependencies. Batter. Supercaps 2020, 3, 60–67. 10.1002/batt.201900135. [DOI] [Google Scholar]
- Liu K.; Wei Z.; Yang Z.; Li K. Mass Load Prediction for Lithium-Ion Battery Electrode Clean Production a Machine Learning Approach. J. Cleaner Prod. 2021, 289, 125159. 10.1016/j.jclepro.2020.125159. [DOI] [Google Scholar]
- Chen Y.-T.; Duquesnoy M.; Tan D. H. S.; Doux J.-M.; Yang H.; Deysher G.; Ridley P.; Franco A. A.; Meng Y. S.; Chen Z. Fabrication of High-Quality Thin Solid-State Electrolyte Films Assisted by Machine Learning. ACS Energy Lett. 2021, 1639–1648. 10.1021/acsenergylett.1c00332. [DOI] [Google Scholar]
- Thiede S.; Turetskyy A.; Kwade A.; Kara S.; Herrmann C. Data Mining in Battery Production Chains towards Multi-Criterial Quality Prediction. CIRP Ann. 2019, 68, 463–466. 10.1016/j.cirp.2019.04.066. [DOI] [Google Scholar]
- García V.; Sánchez J. S.; Rodríguez-Picón L. A.; Méndez-González L. C.; Ochoa-Domínguez H. de J. Using Regression Models for Predicting the Product Quality in a Tubing Extrusion Process. J. Intell. Manuf. 2019, 30, 2535–2544. 10.1007/s10845-018-1418-7. [DOI] [Google Scholar]
- Santosa F.; Symes W. W. Linear Inversion of Band-Limited Reflection Seismograms. SIAM J. Sci. Stat. Comput. 1986, 7, 1307–1330. 10.1137/0907087. [DOI] [Google Scholar]
- Turetskyy A.; Wessel J.; Herrmann C.; Thiede S. Battery Production Design Using Multi-Output Machine Learning Models. Energy Storage Mater. 2021, 38, 93–112. 10.1016/j.ensm.2021.03.002. [DOI] [Google Scholar]
- Yang S.; He R.; Zhang Z.; Cao Y.; Gao X.; Liu X. CHAIN: Cyber Hierarchy and Interactional Network Enabling Digital Solution for Battery Full-Lifespan Management. Matter 2020, 3, 27–41. 10.1016/j.matt.2020.04.015. [DOI] [Google Scholar]
- Primo E. N.; Touzin M.; Franco A. A. Calendering of Li(Ni 0.33 Mn 0.33 Co 0.33)O 2 -Based Cathodes: Analyzing the Link Between Process Parameters and Electrode Properties by Advanced Statistics. Batter. Supercaps 2021, 4, 834. 10.1002/batt.202000324. [DOI] [Google Scholar]
- Franco A. A.; Rucci A.; Brandell D.; Frayret C.; Gaberscek M.; Jankowski P.; Johansson P. Boosting Rechargeable Batteries R&D by Multiscale Modeling: Myth or Reality?. Chem. Rev. 2019, 119, 4569–4627. 10.1021/acs.chemrev.8b00239. [DOI] [PMC free article] [PubMed] [Google Scholar]
- Lombardo T.; Hoock J.; Primo E.; Ngandjong C.; Duquesnoy M.; Franco A. A. Accelerated Optimization Methods for Force-Field Parametrization in Battery Electrode Manufacturing Modeling. Batter. Supercaps 2020, 3, 721. 10.1002/batt.202000049. [DOI] [Google Scholar]
- Bonyadi M. R.; Michalewicz Z. Particle Swarm Optimization for Single Objective Continuous Space Problems: A Review. Evol. Comput. 2017, 25, 1–54. 10.1162/EVCO_r_00180. [DOI] [PubMed] [Google Scholar]
- Olivetti E. A.; Ceder G.; Gaustad G. G.; Fu X. Lithium-Ion Battery Supply Chain Considerations: Analysis of Potential Bottlenecks in Critical Metals. Joule 2017, 1, 229–243. 10.1016/j.joule.2017.08.019. [DOI] [Google Scholar]
- Pfeiffer S. The Vision of “Industrie 4.0” in the Making—a Case of Future Told, Tamed, and Traded. Nanoethics 2017, 11, 107–121. 10.1007/s11569-016-0280-3. [DOI] [PMC free article] [PubMed] [Google Scholar]
- Mubarok K. Redefining Industry 4.0 and Its Enabling Technologies. J. Phys.: Conf. Ser. 2020, 1569, 032025. 10.1088/1742-6596/1569/3/032025. [DOI] [Google Scholar]
- Lin C. C.; Deng D. J.; Chen Z. Y.; Chen K. C. Key Design of Driving Industry 4.0: Joint Energy-Efficient Deployment and Scheduling in Group-Based Industrial Wireless Sensor Networks. IEEE Commun. Mag. 2016, 54, 46–52. 10.1109/MCOM.2016.7588228. [DOI] [Google Scholar]
- Lu Y. Cyber Physical System (CPS)-Based Industry 4.0: A Survey. J. Ind. Integr. Manag. 2017, 02, 1750014. 10.1142/S2424862217500142. [DOI] [Google Scholar]
- Sisinni E.; Saifullah A.; Han S.; Jennehag U.; Gidlund M. Industrial Internet of Things: Challenges, Opportunities, and Directions. IEEE Trans. Ind. Informatics 2018, 14, 4724–4734. 10.1109/TII.2018.2852491. [DOI] [Google Scholar]
- Dai Q.; Kelly J. C.; Gaines L.; Wang M. Life Cycle Analysis of Lithium-Ion Batteries for Automotive Applications. Batteries 2019, 5, 48. 10.3390/batteries5020048. [DOI] [Google Scholar]
- Hiremath M.; Derendorf K.; Vogt T. Comparative Life Cycle Assessment of Battery Storage Systems for Stationary Applications. Environ. Sci. Technol. 2015, 49, 4825–4833. 10.1021/es504572q. [DOI] [PubMed] [Google Scholar]
- Velázquez-Martínez O.; Valio J.; Santasalo-Aarnio A.; Reuter M.; Serna-Guerrero R. A Critical Review of Lithium-Ion Battery Recycling Processes from a Circular Economy Perspective. Batteries 2019, 5, 68. 10.3390/batteries5040068. [DOI] [Google Scholar]
- Uhlemann T. H. J.; Lehmann C.; Steinhilper R. The Digital Twin: Realizing the Cyber-Physical Production System for Industry 4.0. Procedia CIRP 2017, 61, 335–340. 10.1016/j.procir.2016.11.152. [DOI] [Google Scholar]
- Fernandez-Carames T. M.; Fraga-Lamas P. A Review on the Application of Blockchain to the Next Generation of Cybersecure Industry 4.0 Smart Factories. IEEE Access 2019, 7, 45201–45218. 10.1109/ACCESS.2019.2908780. [DOI] [Google Scholar]
- Asakura K.; Abe H.; Kimura M. The Challenge of Constructing an International XAFS Database. J. Synchrotron Radiat. 2018, 25, 967–971. 10.1107/S1600577518006963. [DOI] [PMC free article] [PubMed] [Google Scholar]
- Mathew K.; Zheng C.; Winston D.; Chen C.; Dozier A.; Rehr J. J.; Ong S. P.; Persson K. A. High-Throughput Computational X-Ray Absorption Spectroscopy. Sci. Data 2018, 5, 180151. 10.1038/sdata.2018.151. [DOI] [PMC free article] [PubMed] [Google Scholar]
- Zheng C.; Chen C.; Chen Y.; Ong S. P. Random Forest Models for Accurate Identification of Coordination Environments from X-Ray Absorption Near-Edge Structure. Patterns 2020, 1, 100013. 10.1016/j.patter.2020.100013. [DOI] [PMC free article] [PubMed] [Google Scholar]
- http://nanocrystallography.org/.
- https://icsd.products.fiz-karlsruhe.de/.
- Aguiar J. A.; Gong M. L.; Unocic R. R.; Tasdizen T.; Miller B. D. Decoding Crystallography from High-Resolution Electron Imaging and Diffraction Datasets with Deep Learning. Sci. Adv. 2019, 5, eaaw1949. 10.1126/sciadv.aaw1949. [DOI] [PMC free article] [PubMed] [Google Scholar]
- Lee J. W.; Park W. B.; Lee J. H.; Singh S. P.; Sohn K. S. A Deep-Learning Technique for Phase Identification in Multiphase Inorganic Compounds Using Synthetic XRD Powder Patterns. Nat. Commun. 2020, 11, 86. 10.1038/s41467-019-13749-3. [DOI] [PMC free article] [PubMed] [Google Scholar]
- Tiong L. C. O.; Kim J.; Han S. S.; Kim D. Identification of Crystal Symmetry from Noisy Diffraction Patterns by a Shape Analysis and Deep Learning. npj Comput. Mater. 2020, 6, 196. 10.1038/s41524-020-00466-5. [DOI] [Google Scholar]
- Liu C. H.; Tao Y.; Hsu D.; Du Q.; Billinge S. J. L. Using a Machine Learning Approach to Determine the Space Group of a Structure from the Atomic Pair Distribution Function. Acta Crystallogr., Sect. A: Found. Adv. 2019, 75, 633–643. 10.1107/S2053273319005606. [DOI] [PubMed] [Google Scholar]
- Wang H.; Xie Y.; Li D.; Deng H.; Zhao Y.; Xin M.; Lin J. Rapid Identification of X-Ray Diffraction Patterns Based on Very Limited Data by Interpretable Convolutional Neural Networks. J. Chem. Inf. Model. 2020, 60, 2004–2011. 10.1021/acs.jcim.0c00020. [DOI] [PubMed] [Google Scholar]
- Szymanski N. J.; Bartel C. J.; Zeng Y.; Tu Q.; Ceder G. Probabilistic Deep Learning Approach to Automate the Interpretation of Multi-Phase Diffraction Spectra. Chem. Mater. 2021, 33, 4204. 10.1021/acs.chemmater.1c01071. [DOI] [Google Scholar]
- Aoun B.; Yu C.; Fan L.; Chen Z.; Amine K.; Ren Y. A Generalized Method for High Throughput In-Situ Experiment Data Analysis: An Example of Battery Materials Exploration. J. Power Sources 2015, 279, 246–251. 10.1016/j.jpowsour.2015.01.033. [DOI] [Google Scholar]
- Fehse M.; Iadecola A.; Sougrati M. T.; Conti P.; Giorgetti M.; Stievano L. Applying Chemometrics to Study Battery Materials: Towards the Comprehensive Analysis of Complex Operando Datasets. Energy Storage Mater. 2019, 18, 328–337. 10.1016/j.ensm.2019.02.002. [DOI] [Google Scholar]
- Fehse M.; Darwiche A.; Sougrati M. T.; Kelder E. M.; Chadwick A. V.; Alfredsson M.; Monconduit L.; Stievano L. In-Depth Analysis of the Conversion Mechanism of TiSnSb vs Li by Operando Triple-Edge X-Ray Absorption Spectroscopy: A Chemometric Approach. Chem. Mater. 2017, 29, 10446–10454. 10.1021/acs.chemmater.7b04088. [DOI] [Google Scholar]
- Fehse M.; Sougrati M. T.; Darwiche A.; Gabaudan V.; La Fontaine C.; Monconduit L.; Stievano L. Elucidating the Origin of Superior Electrochemical Cycling Performance: New Insights on Sodiation-Desodiation Mechanism of SnSb from: Operando Spectroscopy. J. Mater. Chem. A 2018, 6, 8724–8734. 10.1039/C8TA02248H. [DOI] [Google Scholar]
- Fehse M.; Bessas D.; Darwiche A.; Mahmoud A.; Rahamim G.; La Fontaine C.; Hermann R. P.; Zitoun D.; Monconduit L.; Stievano L.; Sougrati M. T. The Electrochemical Sodiation of FeSb 2: New Insights from Operando 57 Fe Synchrotron Mössbauer and X-Ray Absorption Spectroscopy. Batter. Supercaps 2019, 2, 66–73. 10.1002/batt.201800075. [DOI] [Google Scholar]
- Assat G.; Iadecola A.; Delacourt C.; Dedryvère R.; Tarascon J. M. Decoupling Cationic-Anionic Redox Processes in a Model Li-Rich Cathode via Operando X-Ray Absorption Spectroscopy. Chem. Mater. 2017, 29, 9714–9724. 10.1021/acs.chemmater.7b03434. [DOI] [Google Scholar]
- Guda A. A.; Guda S. A.; Lomachenko K. A.; Soldatov M. A.; Pankin I. A.; Soldatov A. V.; Braglia L.; Bugaev A. L.; Martini A.; Signorile M.; Groppo E.; Piovano A.; Borfecchia E.; Lamberti C. Quantitative Structural Determination of Active Sites from in Situ and Operando XANES Spectra: From Standard Ab Initio Simulations to Chemometric and Machine Learning Approaches. Catal. Today 2019, 336, 3–21. 10.1016/j.cattod.2018.10.071. [DOI] [Google Scholar]
- Pietsch P.; Wood V. X-Ray Tomography for Lithium Ion Battery Research: A Practical Guide. Annu. Rev. Mater. Res. 2017, 47, 451–479. 10.1146/annurev-matsci-070616-123957. [DOI] [Google Scholar]
- Tan C.; Heenan T. M. M.; Ziesche R. F.; Daemi S. R.; Hack J.; Maier M.; Marathe S.; Rau C.; Brett D. J. L.; Shearing P. R. Four-Dimensional Studies of Morphology Evolution in Lithium-Sulfur Batteries. ACS Appl. Energy Mater. 2018, 1, 5090–5100. 10.1021/acsaem.8b01148. [DOI] [Google Scholar]
- Eastwood D. S.; Yufit V.; Gelb J.; Gu A.; Bradley R. S.; Harris S. J.; Brett D. J. L.; Brandon N. P.; Lee P. D.; Withers P. J.; Shearing P. R. Lithiation-Induced Dilation Mapping in a Lithium-Ion Battery Electrode by 3D X-Ray Microscopy and Digital Volume Correlation. Adv. Energy Mater. 2014, 4, 1300506. 10.1002/aenm.201300506. [DOI] [Google Scholar]
- Pietsch P.; Westhoff D.; Feinauer J.; Eller J.; Marone F.; Stampanoni M.; Schmidt V.; Wood V. Quantifying Microstructural Dynamics and Electrochemical Activity of Graphite and Silicon-Graphite Lithium Ion Battery Anodes. Nat. Commun. 2016, 7, 12909. 10.1038/ncomms12909. [DOI] [PMC free article] [PubMed] [Google Scholar]
- Yu Y. S.; Farmand M.; Kim C.; Liu Y.; Grey C. P.; Strobridge F. C.; Tyliszczak T.; Celestre R.; Denes P.; Joseph J.; Krishnan H.; Maia F. R. N. C.; Kilcoyne A. L. D.; Marchesini S.; Leite T. P. C.; Warwick T.; Padmore H.; Cabana J.; Shapiro D. A. Three-Dimensional Localization of Nanoscale Battery Reactions Using Soft X-Ray Tomography. Nat. Commun. 2018, 9, 921. 10.1038/s41467-018-03401-x. [DOI] [PMC free article] [PubMed] [Google Scholar]
- Yang X.; Kahnt M.; Bruckner D.; Schropp A.; Fam Y.; Becher J.; Grunwaldt J. D.; Sheppard T. L.; Schroer C. G. Tomographic Reconstruction with a Generative Adversarial Network. J. Synchrotron Radiat. 2020, 27, 486–493. 10.1107/S1600577520000831. [DOI] [PMC free article] [PubMed] [Google Scholar]
- Ding G.; Liu Y.; Zhang R.; Xin H. L. A Joint Deep Learning Model to Recover Information and Reduce Artifacts in Missing-Wedge Sinograms for Electron Tomography and Beyond. Sci. Rep. 2019, 9, 12803. 10.1038/s41598-019-49267-x. [DOI] [PMC free article] [PubMed] [Google Scholar]
- Liu Z.; Kettimuthu R.; Gursoy D.; De Carlo F.; Foster I. TomoGAN: Low-Dose Synchrotron x-Ray Tomography with Generative Adversarial Networks: Discussion. J. Opt. Soc. Am. A 2020, 37, 422–434. 10.1364/JOSAA.375595. [DOI] [PubMed] [Google Scholar]
- Garcia-Garcia A.; Orts-Escolano S.; Oprea S.; Villena-Martinez V.; Garcia-Rodriguez J.. A Review on Deep Learning Techniques Applied to Semantic Segmentation. 2017, arXiv:1704.06857. arXiv.org e-Print archive. https://arxiv.org/abs/1704.06857.
- Arganda-Carreras I.; Kaynig V.; Rueden C.; Eliceiri K. W.; Schindelin J.; Cardona A.; Seung H. S. Trainable Weka Segmentation: A Machine Learning Tool for Microscopy Pixel Classification. Bioinformatics 2017, 33, 2424–2426. 10.1093/bioinformatics/btx180. [DOI] [PubMed] [Google Scholar]
- Dixit M. B.; Verma A.; Zaman W.; Zhong X.; Kenesei P.; Park J. S.; Almer J.; Mukherjee P. P.; Hatzell K. B. Synchrotron Imaging of Pore Formation in Li Metal Solid-State Batteries Aided by Machine Learning. ACS Appl. Energy Mater. 2020, 3, 9534–9542. 10.1021/acsaem.0c02053. [DOI] [Google Scholar]
- Furat O.; Finegan D.; Diercks D. Mapping the Architecture of Single Electrode Particles in 3D, Using Electron Backscatter Diffraction and Machine Learning Segmentation. J. Power Sources 2021, 483, 229148. 10.1016/j.jpowsour.2020.229148. [DOI] [Google Scholar]
- Jiang Z.; Li J.; Yang Y.; Mu L.; Wei C.; Yu X.; Pianetta P.; Zhao K.; Cloetens P.; Lin F.; Liu Y. Machine-Learning-Revealed Statistics of the Particle-Carbon/Binder Detachment in Lithium-Ion Battery Cathodes. Nat. Commun. 2020, 11, 2310. 10.1038/s41467-020-16233-5. [DOI] [PMC free article] [PubMed] [Google Scholar]
- LaBonte T.; Martinez C.; Roberts S. A.. We Know Where We Don’t Know: 3D Bayesian CNNs for Credible Geometric Uncertainty. 2019, arXiv:1910.10793. arXiv.org e-Print archive. https://arxiv.org/abs/1910.10793.
- Badmos O.; Kopp A.; Bernthaler T.; Schneider G. Image-Based Defect Detection in Lithium-Ion Battery Electrode Using Convolutional Neural Networks. J. Intell. Manuf. 2020, 31, 885–897. 10.1007/s10845-019-01484-x. [DOI] [Google Scholar]
- Olmos V.; Benítez L.; Marro M.; Loza-Alvarez P.; Piña B.; Tauler R.; de Juan A. Relevant Aspects of Unmixing/Resolution Analysis for the Interpretation of Biological Vibrational Hyperspectral Images. TrAC, Trends Anal. Chem. 2017, 94, 130–140. 10.1016/j.trac.2017.07.004. [DOI] [Google Scholar]
- Baliyan A.; Imai H. Machine Learning Based Analytical Framework for Automatic Hyperspectral Raman Analysis of Lithium-Ion Battery Electrodes. Sci. Rep. 2019, 9, 18241. 10.1038/s41598-019-54770-2. [DOI] [PMC free article] [PubMed] [Google Scholar]
- Wei C.; Xia S.; Huang H.; Mao Y.; Pianetta P.; Liu Y. Mesoscale Battery Science: The Behavior of Electrode Particles Caught on a Multispectral X-Ray Camera. Acc. Chem. Res. 2018, 51, 2484–2492. 10.1021/acs.accounts.8b00123. [DOI] [PubMed] [Google Scholar]
- Nguyen T. T.; Villanova J.; Su Z.; Tucoulou R.; Fleutot B.; Delobel B.; Delacourt C.; Demortière A. 3D Quantification of Microstructural Properties of LiNi0.5Mn0.3Co0.2O2 High-Energy Density Electrodes by X-Ray Holographic Nano-Tomography. Adv. Energy Mater. 2021, 11, 2003529. 10.1002/aenm.202003529. [DOI] [Google Scholar]
- Lu X.; Bertei A.; Finegan D. P.; Tan C.; Daemi S. R.; Weaving J. S.; Regan K. B. O.; Heenan T. M. M.; Hinds G.; Kendrick E.; Brett D. J. L.; Shearing P. R. 3D Microstructure Design of Lithium-Ion Battery Electrodes Assisted by X-Ray Nano-Computed Tomography and Modelling. Nat. Commun. 2020, 11, 2079. 10.1038/s41467-020-15811-x. [DOI] [PMC free article] [PubMed] [Google Scholar]
- Lu X.; Daemi S. R.; Bertei A.; Kok M. D. R.; O’Regan K. B.; Rasha L.; Park J.; Hinds G.; Kendrick E.; Brett D. J. L.; Shearing P. R. Microstructural Evolution of Battery Electrodes During Calendering. Joule 2020, 4, 2746–2768. 10.1016/j.joule.2020.10.010. [DOI] [Google Scholar]
- Li Q.; Yi T.; Wang X.; Pan H.; Quan B.; Liang T.; Guo X.; Yu X.; Wang H.; Huang X.; Chen L.; Li H. In-Situ Visualization of Lithium Plating in All-Solid-State Lithium-Metal Battery. Nano Energy 2019, 63, 103895. 10.1016/j.nanoen.2019.103895. [DOI] [Google Scholar]
- Kazyak E.; Garcia-Mendez R.; LePage W. S.; Sharafi A.; Davis A. L.; Sanchez A. J.; Chen K. H.; Haslam C.; Sakamoto J.; Dasgupta N. P. Li Penetration in Ceramic Solid Electrolytes: Operando Microscopy Analysis of Morphology, Propagation, and Reversibility. Matter 2020, 2, 1025–1048. 10.1016/j.matt.2020.02.008. [DOI] [Google Scholar]
- Eitzinger C.; Zambal S.; Thanner P.. Robotic Inspection Systems. In Integrated Imaging and Vision Techniques for Industrial Inspection. Advances in Computer Vision and Pattern Recognition; Liu Z., Ukida H., Ramuhalli P., Niel K., Eds.; Springer: 2015.
- Thanner P.; Soukup D. Lessons in Training Neural Nets: Limited Data Is a Common Problem When Training CNNs in Industrial Imaging Applications. Imaging Mach. Vis. Eur. 2019, 94, 28. [Google Scholar]
- Someda T. Sparse Modelling with Small Datasets: Takashi Someda, CTO at Hacarus, on the Advantages of Sparse Modelling AI Tools. Imaging Mach. Vis. Eur. 2019, 96, 20. [Google Scholar]
- Song Y.; Liu D.; Liao H.; Peng Y. A Hybrid Statistical Data-Driven Method for on-Line Joint State Estimation of Lithium-Ion Batteries. Appl. Energy 2020, 261, 114408. 10.1016/j.apenergy.2019.114408. [DOI] [Google Scholar]
- Zhang R.; Xia B.; Li B.; Cao L.; Lai Y.; Zheng W.; Wang H.; Wang W. State of the Art of Lithium-Ion Battery SOC Estimation for Electrical Vehicles. Energies 2018, 11, 1820. 10.3390/en11071820. [DOI] [Google Scholar]
- Zheng Y.; Ouyang M.; Han X.; Lu L.; Li J. Investigating the Error Sources of the Online State of Charge Estimation Methods for Lithium-Ion Batteries in Electric Vehicles. J. Power Sources 2018, 377, 161–188. 10.1016/j.jpowsour.2017.11.094. [DOI] [Google Scholar]
- Talaie E.; Bonnick P.; Sun X.; Pang Q.; Liang X.; Nazar L. F. Methods and Protocols for Electrochemical Energy Storage Materials Research. Chem. Mater. 2017, 29, 90–105. 10.1021/acs.chemmater.6b02726. [DOI] [Google Scholar]
- Bloom I.; Cole B. W.; Sohn J. J.; Jones S. A.; Polzin E. G.; Battaglia V. S.; Henriksen G. L.; Motloch C.; Richardson R.; Unkelhaeuser T.; Ingersoll D.; Case H. L. An Accelerated Calendar and Cycle Life Study of Li-Ion Cells. J. Power Sources 2001, 101, 238–247. 10.1016/S0378-7753(01)00783-2. [DOI] [Google Scholar]
- Broussely M.; Herreyre S.; Biensan P.; Kasztejna P.; Nechev K.; Staniewicz R. J. Aging Mechanism in Li Ion Cells and Calendar Life Predictions. J. Power Sources 2001, 97–98, 13–21. 10.1016/S0378-7753(01)00722-4. [DOI] [Google Scholar]
- Pinson M. B.; Bazant M. Z. Theory of SEI Formation in Rechargeable Batteries: Capacity Fade, Accelerated Aging and Lifetime Prediction. J. Electrochem. Soc. 2013, 160, A243–A250. 10.1149/2.044302jes. [DOI] [Google Scholar]
- Christensen J.; Newman J. A Mathematical Model for the Lithium-Ion Negative Electrode Solid Electrolyte Interphase. J. Electrochem. Soc. 2004, 151, A1977–A1988. 10.1149/1.1804812. [DOI] [Google Scholar]
- Arora P.; Doyle M.; White R. E. Mathematical Modeling of the Lithium Deposition Overcharge Reaction in Lithium-Ion Batteries Using Carbon-Based Negative Electrodes. J. Electrochem. Soc. 1999, 146, 3543–3553. 10.1149/1.1392512. [DOI] [Google Scholar]
- Yang X. G.; Leng Y.; Zhang G.; Ge S.; Wang C. Y. Modeling of Lithium Plating Induced Aging of Lithium-Ion Batteries: Transition from Linear to Nonlinear Aging. J. Power Sources 2017, 360, 28–40. 10.1016/j.jpowsour.2017.05.110. [DOI] [Google Scholar]
- Christensen J.; Newman J. Cyclable Lithium and Capacity Loss in Li-Ion Cells. J. Electrochem. Soc. 2005, 152, A818. 10.1149/1.1870752. [DOI] [Google Scholar]
- Zhang Q.; White R. E. Capacity Fade Analysis of a Lithium Ion Cell. J. Power Sources 2008, 179, 793–798. 10.1016/j.jpowsour.2008.01.028. [DOI] [Google Scholar]
- Wright R. B.; Christophersen J. P.; Motloch C. G.; Belt J. R.; Ho C. D.; Battaglia V. S.; Barnes J. A.; Duong T. Q.; Sutula R. A. Power Fade and Capacity Fade Resulting from Cycle-Life Testing of Advanced Technology Development Program Lithium-Ion Batteries. J. Power Sources 2003, 119–121, 865–869. 10.1016/S0378-7753(03)00190-3. [DOI] [Google Scholar]
- Ramadesigan V.; Chen K.; Burns N. A.; Boovaragavan V.; Braatz R. D.; Subramanian V. R. Parameter Estimation and Capacity Fade Analysis of Lithium-Ion Batteries Using Reformulated Models. J. Electrochem. Soc. 2011, 158, A1048. 10.1149/1.3609926. [DOI] [Google Scholar]
- Cordoba-Arenas A.; Onori S.; Guezennec Y.; Rizzoni G. Capacity and Power Fade Cycle-Life Model for Plug-in Hybrid Electric Vehicle Lithium-Ion Battery Cells Containing Blended Spinel and Layered-Oxide Positive Electrodes. J. Power Sources 2015, 278, 473–483. 10.1016/j.jpowsour.2014.12.047. [DOI] [Google Scholar]
- Waldmann T.; Gorse S.; Samtleben T.; Schneider G.; Knoblauch V.; Wohlfahrt-Mehrens M. A Mechanical Aging Mechanism in Lithium-Ion Batteries. J. Electrochem. Soc. 2014, 161, A1742–A1747. 10.1149/2.1001410jes. [DOI] [Google Scholar]
- Waldmann T.; Bisle G.; Hogg B.-I.; Stumpp S.; Danzer M. A.; Kasper M.; Axmann P.; Wohlfahrt-Mehrens M. Influence of Cell Design on Temperatures and Temperature Gradients in Lithium-Ion Cells: An In Operando Study. J. Electrochem. Soc. 2015, 162, A921–A927. 10.1149/2.0561506jes. [DOI] [Google Scholar]
- Bach T. C.; Schuster S. F.; Fleder E.; Müller J.; Brand M. J.; Lorrmann H.; Jossen A.; Sextl G. Nonlinear Aging of Cylindrical Lithium-Ion Cells Linked to Heterogeneous Compression. J. Energy Storage 2016, 5, 212–223. 10.1016/j.est.2016.01.003. [DOI] [Google Scholar]
- Harris S. J.; Lu P. Effects of Inhomogeneities -Nanoscale to Mesoscale -on the Durability of Li-Ion Batteries. J. Phys. Chem. C 2013, 117, 6481–6492. 10.1021/jp311431z. [DOI] [Google Scholar]
- Lewerenz M.; Marongiu A.; Warnecke A.; Sauer D. U. Differential Voltage Analysis as a Tool for Analyzing Inhomogeneous Aging: A Case Study for LiFePO4|Graphite Cylindrical Cells. J. Power Sources 2017, 368, 57–67. 10.1016/j.jpowsour.2017.09.059. [DOI] [Google Scholar]
- Gu R.; Malysz P.; Yang H.; Emadi A. On the Suitability of Electrochemical-Based Modeling for Lithium-Ion Batteries. IEEE Trans. Transp. Electrif. 2016, 2, 417–431. 10.1109/TTE.2016.2571778. [DOI] [Google Scholar]
- Xiong R.; Li L.; Li Z.; Yu Q.; Mu H. An Electrochemical Model Based Degradation State Identification Method of Lithium-Ion Battery for All-Climate Electric Vehicles Application. Appl. Energy 2018, 219, 264–275. 10.1016/j.apenergy.2018.03.053. [DOI] [Google Scholar]
- Pan Y.-w.; Hua Y.; Zhou S.; He R.; Zhang Y.; Yang S.; Liu X.; Lian Y.; Yan X.; Wu B. A Computational Multi-Node Electro-Thermal Model for Large Prismatic Lithium-Ion Batteries. J. Power Sources 2020, 459, 228070. 10.1016/j.jpowsour.2020.228070. [DOI] [Google Scholar]
- Downey A.; Lui Y. H.; Hu C.; Laflamme S.; Hu S. Physics-Based Prognostics of Lithium-Ion Battery Using Non-Linear Least Squares with Dynamic Bounds. Reliab. Eng. Syst. Saf. 2019, 182, 1–12. 10.1016/j.ress.2018.09.018. [DOI] [Google Scholar]
- Schmalstieg J.; Käbitz S.; Ecker M.; Sauer D. U. A Holistic Aging Model for Li(NiMnCo)O2 Based 18650 Lithium-Ion Batteries. J. Power Sources 2014, 257, 325–334. 10.1016/j.jpowsour.2014.02.012. [DOI] [Google Scholar]
- Guha A.; Patra A. State of Health Estimation of Lithium-Ion Batteries Using Capacity Fade and Internal Resistance Growth Models. IEEE Trans. Transp. Electrif. 2018, 4, 135–146. 10.1109/TTE.2017.2776558. [DOI] [Google Scholar]
- Bahramipanah M.; Torregrossa D.; Cherkaoui R.; Paolone M. Enhanced Equivalent Electrical Circuit Model of Lithium-Based Batteries Accounting for Charge Redistribution, State-of-Health, and Temperature Effects. IEEE Trans. Transp. Electrif. 2017, 3, 589–599. 10.1109/TTE.2017.2739344. [DOI] [Google Scholar]
- Hu X.; Feng F.; Liu K.; Zhang L.; Xie J.; Liu B. State Estimation for Advanced Battery Management: Key Challenges and Future Trends. Renewable Sustainable Energy Rev. 2019, 114, 109334. 10.1016/j.rser.2019.109334. [DOI] [Google Scholar]
- Chang Y.; Fang H.; Zhang Y. A New Hybrid Method for the Prediction of the Remaining Useful Life of a Lithium-Ion Battery. Appl. Energy 2017, 206, 1564–1578. 10.1016/j.apenergy.2017.09.106. [DOI] [Google Scholar]
- Liu K.; Li K.; Peng Q.; Zhang C. A Brief Review on Key Technologies in the Battery Management System of Electric Vehicles. Front. Mech. Eng. 2019, 14, 47–64. 10.1007/s11465-018-0516-8. [DOI] [Google Scholar]
- Tang X.; Zou C.; Yao K.; Lu J.; Xia Y.; Gao F. Aging Trajectory Prediction for Lithium-Ion Batteries via Model Migration and Bayesian Monte Carlo Method. Appl. Energy 2019, 254, 113591. 10.1016/j.apenergy.2019.113591. [DOI] [Google Scholar]
- Burns J. C.; Jain G.; Smith A. J.; Eberman K. W.; Scott E.; Gardner J. P.; Dahn J. R. Evaluation of Effects of Additives in Wound Li-Ion Cells Through High Precision Coulometry. J. Electrochem. Soc. 2011, 158, A255. 10.1149/1.3531997. [DOI] [Google Scholar]
- Burns J. C.; Kassam A.; Sinha N. N.; Downie L. E.; Solnickova L.; Way B. M.; Dahn J. R. Predicting and Extending the Lifetime of Li-Ion Batteries. J. Electrochem. Soc. 2013, 160, A1451–A1456. 10.1149/2.060309jes. [DOI] [Google Scholar]
- Chen C. H.; Liu J.; Amine K. Symmetric Cell Approach and Impedance Spectroscopy of High Power Lithium-Ion Batteries. J. Power Sources 2001, 96, 321–328. 10.1016/S0378-7753(00)00666-2. [DOI] [Google Scholar]
- Tröltzsch U.; Kanoun O.; Tränkler H. R. Characterizing Aging Effects of Lithium Ion Batteries by Impedance Spectroscopy. Electrochim. Acta 2006, 51, 1664–1672. 10.1016/j.electacta.2005.02.148. [DOI] [Google Scholar]
- Love C. T.; Virji M. B. V.; Rocheleau R. E.; Swider-Lyons K. E. State-of-Health Monitoring of 18650 4S Packs with a Single-Point Impedance Diagnostic. J. Power Sources 2014, 266, 512–519. 10.1016/j.jpowsour.2014.05.033. [DOI] [Google Scholar]
- Tang X.; Yao K.; Liu B.; Hu W.; Gao F. Long-Term Battery Voltage, Power, and Surface Temperature Prediction Using a Model-Based Extreme Learning Machine. Energies 2018, 11, 86. 10.3390/en11010086. [DOI] [Google Scholar]
- Li W.; Zhu J.; Xia Y.; Gorji M. B.; Wierzbicki T. Data-Driven Safety Envelope of Lithium-Ion Batteries for Electric Vehicles. Joule 2019, 3, 2703–2715. 10.1016/j.joule.2019.07.026. [DOI] [Google Scholar]
- Zhou X.; Hsieh S. J.; Peng B.; Hsieh D. Cycle Life Estimation of Lithium-Ion Polymer Batteries Using Artificial Neural Network and Support Vector Machine with Time-Resolved Thermography. Microelectron. Reliab. 2017, 79, 48–58. 10.1016/j.microrel.2017.10.013. [DOI] [Google Scholar]
- Choi Y.; Ryu S.; Park K.; Kim H. Machine Learning-Based Lithium-Ion Battery Capacity Estimation Exploiting Multi-Channel Charging Profiles. IEEE Access 2019, 7, 75143–75152. 10.1109/ACCESS.2019.2920932. [DOI] [Google Scholar]
- Ren L.; Zhao L.; Hong S.; Zhao S.; Wang H.; Zhang L. Remaining Useful Life Prediction for Lithium-Ion Battery: A Deep Learning Approach. IEEE Access 2018, 6, 50587–50598. 10.1109/ACCESS.2018.2858856. [DOI] [Google Scholar]
- Qu J.; Liu F.; Ma Y.; Fan J. A Neural-Network-Based Method for RUL Prediction and SOH Monitoring of Lithium-Ion Battery. IEEE Access 2019, 7, 87178–87191. 10.1109/ACCESS.2019.2925468. [DOI] [Google Scholar]
- Gao D.; Miaohua H. Prediction of Remaining Useful Life of Lithium-Ion Battery Based on Multi-Kernel Support Vector Machine with Particle Swarm Optimization. J. Power Electron. 2017, 17, 1288–1297. [Google Scholar]
- Yang D.; Zhang X.; Pan R.; Wang Y.; Chen Z. A Novel Gaussian Process Regression Model for State-of-Health Estimation of Lithium-Ion Battery Using Charging Curve. J. Power Sources 2018, 384, 387–395. 10.1016/j.jpowsour.2018.03.015. [DOI] [Google Scholar]
- Richardson R. R.; Osborne M. A.; Howey D. A. Gaussian Process Regression for Forecasting Battery State of Health. J. Power Sources 2017, 357, 209–219. 10.1016/j.jpowsour.2017.05.004. [DOI] [Google Scholar]
- Liu K.; Hu X.; Wei Z.; Li Y.; Jiang Y. Modified Gaussian Process Regression Models for Cyclic Capacity Prediction of Lithium-Ion Batteries. IEEE Trans. Transp. Electrif. 2019, 5, 1225–1236. 10.1109/TTE.2019.2944802. [DOI] [Google Scholar]
- Richardson R. R.; Birkl C. R.; Osborne M. A.; Howey D. A. Gaussian Process Regression for in Situ Capacity Estimation of Lithium-Ion Batteries. IEEE Trans. Ind. Informatics 2019, 15, 127–138. 10.1109/TII.2018.2794997. [DOI] [Google Scholar]
- Zhu S.; Zhao N.; Sha J. Predicting Battery Life with Early Cyclic Data by Machine Learning. Energy Storage 2019, 1, e98. 10.1002/est2.98. [DOI] [Google Scholar]
- Zou H.; Hastie T. Regularization and Variable Selection via the Elastic Net. J. R. Stat. Soc. Ser. B Stat. Methodol. 2005, 67, 301–320. 10.1111/j.1467-9868.2005.00503.x. [DOI] [Google Scholar]
- Harlow J. E.; Ma X.; Li J.; Logan E.; Liu Y.; Zhang N.; Ma L.; Glazier S. L.; Cormier M. M. E.; Genovese M.; et al. A Wide Range of Testing Results on an Excellent Lithium-Ion Cell Chemistry to be used as Benchmarks for New Battery Technologies. J. Electrochem. Soc. 2019, 166, A3031. 10.1149/2.0981913jes. [DOI] [Google Scholar]
- Attia P.; Deetjen M.; Witmer J.. Accelerating Battery Development via Early Prediction of Cell Lifetime. [Google Scholar]
- Bhowmik A.; Vegge T. AI Fast Track to Battery Fast Charge. Joule 2020, 4, 717–719. 10.1016/j.joule.2020.03.016. [DOI] [Google Scholar]
- Attia P. M.; Grover A.; Jin N.; Severson K. A.; Markov T. M.; Liao Y.-H.; Chen M. H.; Cheong B.; Perkins N.; Yang Z.; Herring P. K.; Aykol M.; Harris S. J.; Braatz R. D.; Ermon S.; Chueh W. C. Closed-Loop Optimization of Fast-Charging Protocols for Batteries with Machine Learning. Nature 2020, 578, 397–402. 10.1038/s41586-020-1994-5. [DOI] [PubMed] [Google Scholar]
- Hoffman M. W.; Shahriari B.; De Freitas N. On Correlation and Budget Constraints in Model-Based Bandit Optimization with Application to Automatic Machine Learning. J. Mach. Learn. Res. 2014, 33, 365–374. [Google Scholar]
- Grover A.; Gummadi R.; Lázaro-Gredilla M.; Schuurmans D.; Ermon S.. Variational Rejection Sampling. 2018, arXiv:1804.01712. arXiv.org e-Print archive. https://arxiv.org/abs/1804.01712.
- http://ti.arc.nasa.gov/project/prognostic-data-repository.
- Qin T.; Zeng S.; Guo J. Robust Prognostics for State of Health Estimation of Lithium-Ion Batteries Based on an Improved PSO-SVR Model. Microelectron. Reliab. 2015, 55, 1280–1284. 10.1016/j.microrel.2015.06.133. [DOI] [Google Scholar]
- Wei J.; Dong G.; Chen Z. Remaining Useful Life Prediction and State of Health Diagnosis for Lithium-Ion Batteries Using Particle Filter and Support Vector Regression. IEEE Trans. Ind. Electron. 2018, 65, 5634–5643. 10.1109/TIE.2017.2782224. [DOI] [Google Scholar]
- Dong H.; Jin X.; Lou Y.; Wang C. Lithium-Ion Battery State of Health Monitoring and Remaining Useful Life Prediction Based on Support Vector Regression-Particle Filter. J. Power Sources 2014, 271, 114–123. 10.1016/j.jpowsour.2014.07.176. [DOI] [Google Scholar]
- Wang Y.; Ni Y.; Lu S.; Wang J.; Zhang X. Remaining Useful Life Prediction of Lithium-Ion Batteries Using Support Vector Regression Optimized by Artificial Bee Colony. IEEE Trans. Veh. Technol. 2019, 68, 9543–9553. 10.1109/TVT.2019.2932605. [DOI] [Google Scholar]
- Sarle W. S.Neural Networks and Statistical Model. Proceedings of the Nineteenth Annual SAS Users Group International Conference, 1994.
- Zhou D.; Li Z.; Zhu J.; Zhang H.; Hou L. State of Health Monitoring and Remaining Useful Life Prediction of Lithium-Ion Batteries Based on Temporal Convolutional Network. IEEE Access 2020, 8, 53307–53320. 10.1109/ACCESS.2020.2981261. [DOI] [Google Scholar]
- Kwon S. J.; Han D.; Choi J. H.; Lim J. H.; Lee S. E.; Kim J. Remaining-Useful-Life Prediction via Multiple Linear Regression and Recurrent Neural Network Reflecting Degradation Information of 20Ah LiNixMnyCo1-x-yO2 Pouch Cell. J. Electroanal. Chem. 2020, 858, 113729. 10.1016/j.jelechem.2019.113729. [DOI] [Google Scholar]
- Liu J.; Saxena A.; Goebel K.; Saha B.; Wang W.. An Adaptive Recurrent Neural Network for Remaining Useful Life Prediction of Lithium-Ion Batteries. Annual Conference of the Prognostics and Health Management Society, 2010.
- Christophersen J. P.; Bloom I.; Thomas E. V.; Gering K. L.; Henriksen G. L.; Battaglia V. S.; Howell D.. Advanced Technology Development Program for Lithium-Ion Batteries: Gen 2 Performance Evaluation Final Report. Idaho National Laboratory, 2006.
- Liu J.; Wang W.; Golnaraghi F. A Multi-Step Predictor with a Variable Input Pattern for System State Forecasting. Mech. Syst. Signal Process. 2009, 23, 1586–1599. 10.1016/j.ymssp.2008.09.006. [DOI] [Google Scholar]
- Ng S. S. Y.; Xing Y.; Tsui K. L. A Naive Bayes Model for Robust Remaining Useful Life Prediction of Lithium-Ion Battery. Appl. Energy 2014, 118, 114–123. 10.1016/j.apenergy.2013.12.020. [DOI] [Google Scholar]
- Cheng Y.; Lu C.; Li T.; Tao L. Residual Lifetime Prediction for Lithium-Ion Battery Based on Functional Principal Component Analysis and Bayesian Approach. Energy 2015, 90, 1983–1993. 10.1016/j.energy.2015.07.022. [DOI] [Google Scholar]
- Lu J.; Gao F. Model Migration with Inclusive Similarity for Development of a New Process Model. Ind. Eng. Chem. Res. 2008, 47, 9508–9516. 10.1021/ie800595a. [DOI] [Google Scholar]
- Lu J.; Yao K.; Gao F. Process Similarity and Developing New Process Models Through Migration. AIChE J. 2009, 55, 2318–2328. 10.1002/aic.11822. [DOI] [Google Scholar]
- Peng Y.; Hou Y.; Song Y.; Pang J.; Liu D. Lithium-Ion Battery Prognostics with Hybrid Gaussian Process Function Regression. Energies 2018, 11, 1420. 10.3390/en11061420. [DOI] [Google Scholar]
- Raccuglia P.; Elbert K. C.; Adler P. D. F.; Falk C.; Wenny M. B.; Mollo A.; Zeller M.; Friedler S. A.; Schrier J.; Norquist A. J. Machine-Learning-Assisted Materials Discovery Using Failed Experiments. Nature 2016, 533, 73–76. 10.1038/nature17439. [DOI] [PubMed] [Google Scholar]
- Weng C.; Cui Y.; Sun J.; Peng H. On-Board State of Health Monitoring of Lithium-Ion Batteries Using Incremental Capacity Analysis with Support Vector Regression. J. Power Sources 2013, 235, 36–44. 10.1016/j.jpowsour.2013.02.012. [DOI] [Google Scholar]
- Weng C.; Feng X.; Sun J.; Peng H. State-of-Health Monitoring of Lithium-Ion Battery Modules and Packs via Incremental Capacity Peak Tracking. Appl. Energy 2016, 180, 360–368. 10.1016/j.apenergy.2016.07.126. [DOI] [Google Scholar]
- Berecibar M.; Garmendia M.; Gandiaga I.; Crego J.; Villarreal I. State of Health Estimation Algorithm of LiFePO4 Battery Packs Based on Differential Voltage Curves for Battery Management System Application. Energy 2016, 103, 784–796. 10.1016/j.energy.2016.02.163. [DOI] [Google Scholar]
- Berecibar M.; Devriendt F.; Dubarry M.; Villarreal I.; Omar N.; Verbeke W.; Van Mierlo J. Online State of Health Estimation on NMC Cells Based on Predictive Analytics. J. Power Sources 2016, 320, 239–250. 10.1016/j.jpowsour.2016.04.109. [DOI] [Google Scholar]
- Zhang Y.; Tang Q.; Zhang Y.; Wang J.; Stimming U.; Lee A. A. Identifying Degradation Patterns of Lithium Ion Batteries from Impedance Spectroscopy Using Machine Learning. Nat. Commun. 2020, 11, 1706. 10.1038/s41467-020-15235-7. [DOI] [PMC free article] [PubMed] [Google Scholar]
- Barré A.; Deguilhem B.; Grolleau S.; Gérard M.; Suard F.; Riu D. A Review on Lithium-Ion Battery Ageing Mechanisms and Estimations for Automotive Applications. J. Power Sources 2013, 241, 680–689. 10.1016/j.jpowsour.2013.05.040. [DOI] [Google Scholar]
- Huang M.; Kumar M.; Yang C.; Soderlund A. Aging Estimation of Lithium-Ion Battery Cell Using an Electrochemical Model-Based Extended Kalman Filter. AIAA Scitech 2019 Forum 2019, (January), 1–13. 10.2514/6.2019-0785. [DOI] [Google Scholar]
- De Sutter L.; Firouz Y.; De Hoog J.; Omar N.; Van Mierlo J. Battery Aging Assessment and Parametric Study of Lithium-Ion Batteries by Means of a Fractional Differential Model. Electrochim. Acta 2019, 305, 24–36. 10.1016/j.electacta.2019.02.104. [DOI] [Google Scholar]
- Ahmed R.; Gazzarri J.; Onori S.; Habibi S.; Jackey R.; Rzemien K.; Tjong J.; Lesage J. Model-Based Parameter Identification of Healthy and Aged Li-Ion Batteries for Electric Vehicle Applications. SAE Int. J. Altern. Powertrains 2015, 4, 233–247. 10.4271/2015-01-0252. [DOI] [Google Scholar]
- Patil M. A.; Tagade P.; Hariharan K. S.; Kolake S. M.; Song T.; Yeo T.; Doo S. A Novel Multistage Support Vector Machine Based Approach for Li Ion Battery Remaining Useful Life Estimation. Appl. Energy 2015, 159, 285–297. 10.1016/j.apenergy.2015.08.119. [DOI] [Google Scholar]
- Klass V.; Behm M.; Lindbergh G. A Support Vector Machine-Based State-of-Health Estimation Method for Lithium-Ion Batteries under Electric Vehicle Operation. J. Power Sources 2014, 270, 262–272. 10.1016/j.jpowsour.2014.07.116. [DOI] [Google Scholar]
- Klass V.; Behm M.; Lindbergh G. Evaluating Real-Life Performance of Lithium-Ion Battery Packs in Electric Vehicles. J. Electrochem. Soc. 2012, 159, A1856–A1860. 10.1149/2.047211jes. [DOI] [Google Scholar]
- Nuhic A.; Terzimehic T.; Soczka-Guth T.; Buchholz M.; Dietmayer K. Health Diagnosis and Remaining Useful Life Prognostics of Lithium-Ion Batteries Using Data-Driven Methods. J. Power Sources 2013, 239, 680–688. 10.1016/j.jpowsour.2012.11.146. [DOI] [Google Scholar]
- Guo P.; Cheng Z.; Yang L. A Data-Driven Remaining Capacity Estimation Approach for Lithium-Ion Batteries Based on Charging Health Feature Extraction. J. Power Sources 2019, 412, 442–450. 10.1016/j.jpowsour.2018.11.072. [DOI] [Google Scholar]
- Yang D.; Wang Y.; Pan R.; Chen R.; Chen Z. State-of-Health Estimation for the Lithium-Ion Battery Based on Support Vector Regression. Appl. Energy 2018, 227, 273–283. 10.1016/j.apenergy.2017.08.096. [DOI] [Google Scholar]
- Chen T.; Morris J.; Martin E. Gaussian Process Regression for Multivariate Spectroscopic Calibration. Chemom. Intell. Lab. Syst. 2007, 87, 59–71. 10.1016/j.chemolab.2006.09.004. [DOI] [Google Scholar]
- Tosun N. Determination of Optimum Parameters for Multi-Performance Characteristics in Drilling by Using Grey Relational Analysis. Int. J. Adv. Manuf. Technol. 2006, 28, 450–455. 10.1007/s00170-004-2386-y. [DOI] [Google Scholar]
- Liu D.; Pang J.; Zhou J.; Peng Y.; Pecht M. Prognostics for State of Health Estimation of Lithium-Ion Batteries Based on Combination Gaussian Process Functional Regression. Microelectron. Reliab. 2013, 53, 832–839. 10.1016/j.microrel.2013.03.010. [DOI] [Google Scholar]
- Peikun S.; Zhenpo W. Research of the Relationship between Li-Ion Battery Charge Performance and SOH Based on MIGA-GPR Method. Energy Procedia 2016, 88, 608–613. 10.1016/j.egypro.2016.06.086. [DOI] [Google Scholar]
- Richardson R. R.; Birkl C. R.; Osborne M. A.; Howey D. A. Gaussian Process Regression for In-Situ Capacity Estimation of Lithium-Ion Batteries. IEEE Trans. Ind. Inf. 2019, 15, 127–138. 10.1109/TII.2018.2794997. [DOI] [Google Scholar]
- Hu X.; Jiang J.; Cao D.; Egardt B. Battery Health Prognosis for Electric Vehicles Using Sample Entropy and Sparse Bayesian Predictive Modeling. IEEE Trans. Ind. Electron. 2015, 63, 2645–2656. 10.1109/TIE.2015.2461523. [DOI] [Google Scholar]
- Zhang J.; Walter G. G.; Miao Y.; Lee W. N. W. Wavelet Neural Network for Function Learning. IEEE Trans. SIGNAL Process. 1995, 43, 1485–1497. 10.1109/78.388860. [DOI] [Google Scholar]
- Dong G.; Zhang X.; Zhang C.; Chen Z. A Method for State of Energy Estimation of Lithium-Ion Batteries Based on Neural Network Model. Energy 2015, 90, 879–888. 10.1016/j.energy.2015.07.120. [DOI] [Google Scholar]
- Sandberg I. W.; Fancourt C. L.; Principe J. C.; Katagiri S.; Haykin S.. Nonlinear Dynamical Systems: Feedforward Neural Network Perspectives; Springer: 2001. [Google Scholar]
- Wu J.; Zhang C.; Chen Z. An Online Method for Lithium-Ion Battery Remaining Useful Life Estimation Using Importance Sampling and Neural Networks. Appl. Energy 2016, 173, 134–140. 10.1016/j.apenergy.2016.04.057. [DOI] [Google Scholar]
- Feng F.; Teng S.; Liu K.; Xie J.; Xie Y.; Liu B.; Li K. Co-Estimation of Lithium-Ion Battery State of Charge and State of Temperature Based on a Hybrid Electrochemical-Thermal-Neural-Network Model. J. Power Sources 2020, 455, 227935. 10.1016/j.jpowsour.2020.227935. [DOI] [Google Scholar]
- Zhang Y.; Xiong R.; He H.; Pecht M. G. Long Short-Term Memory Recurrent Neural Network for Remaining Useful Life Prediction of Lithium-Ion Batteries. IEEE Trans. Veh. Technol. 2018, 67, 5695–5705. 10.1109/TVT.2018.2805189. [DOI] [Google Scholar]
- You G. W.; Park S.; Oh D. Diagnosis of Electric Vehicle Batteries Using Recurrent Neural Networks. IEEE Trans. Ind. Electron. 2017, 64, 4885–4893. 10.1109/TIE.2017.2674593. [DOI] [Google Scholar]
- Chen X.; Ye L.; Wang Y.; Li X. Beyond Expert-Level Performance Prediction for Rechargeable Batteries by Unsupervised Machine Learning. Adv. Intell. Syst. 2019, 1, 1900102. 10.1002/aisy.201900102. [DOI] [Google Scholar]
- Shen S.; Sadoughi M.; Chen X.; Hong M.; Hu C. A Deep Learning Method for Online Capacity Estimation of Lithium-Ion Batteries. J. Energy Storage 2019, 25, 100817. 10.1016/j.est.2019.100817. [DOI] [Google Scholar]
- Li Y.; Zhong S.; Zhong Q.; Shi K. Lithium-Ion Battery State of Health Monitoring Based on Ensemble Learning. IEEE Access 2019, 7, 8754–8762. 10.1109/ACCESS.2019.2891063. [DOI] [Google Scholar]
- Naha A.; Khandelwal A.; Agarwal S.; Tagade P.; Hariharan K. S.; Kaushik A.; Yadu A.; Kolake S. M.; Han S.; Oh B. Internal Short Circuit Detection in Li-Ion Batteries Using Supervised Machine Learning. Sci. Rep. 2020, 10, 1301. 10.1038/s41598-020-58021-7. [DOI] [PMC free article] [PubMed] [Google Scholar]
- Lewis P. A. W.; Stevens J. G. Nonlinear Modeling of Time Series Using Multivariate Adaptive Regression Splines (MARS). J. Am. Stat. Assoc. 1991, 86, 864–877. 10.1080/01621459.1991.10475126. [DOI] [Google Scholar]
- Chan C. C.; Lo E. W. C.; Weixiang S. Available Capacity Computation Model Based on Artificial Neural Network for Lead-Acid Batteries in Electric Vehicles. J. Power Sources 2000, 87, 201–204. 10.1016/S0378-7753(99)00502-9. [DOI] [Google Scholar]
- Elith J.; Leathwick J. Predicting Species Distributions from Museum and Herbarium Records Using Multiresponse Models Fitted with Multivariate Adaptive Regression Splines. Divers. Distrib. 2007, 13, 265–275. 10.1111/j.1472-4642.2007.00340.x. [DOI] [Google Scholar]
- Leathwick J. R.; Elith J.; Hastie T. Comparative Performance of Generalized Additive Models and Multivariate Adaptive Regression Splines for Statistical Modelling of Species Distributions. Ecol. Modell. 2006, 199, 188–196. 10.1016/j.ecolmodel.2006.05.022. [DOI] [Google Scholar]
- Leathwick J. R.; Rowe D.; Richardson J.; Elith J.; Hastie T. Using Multivariate Adaptive Regression Splines to Predict the Distributions of New Zealand’s Freshwater Diadromous Fish. Freshwater Biol. 2005, 50, 2034–2052. 10.1111/j.1365-2427.2005.01448.x. [DOI] [Google Scholar]
- Zeileis A.; Hothorn T.; Hornik K. Model-Based Recursive Partitioning. J. Comput. Graph. Stat. 2008, 17, 492–514. 10.1198/106186008X319331. [DOI] [Google Scholar]
- Balshi M. S.; McGuire A. D.; Duffy P.; Flannigan M.; Walsh J.; Melillo J. Assessing the Response of Area Burned to Changing Climate in Western Boreal North America Using a Multivariate Adaptive Regression Splines (MARS) Approach. Glob. Chang. Biol. 2009, 15, 578–600. 10.1111/j.1365-2486.2008.01679.x. [DOI] [Google Scholar]
- Quirós E.; Felicísimo Á. M.; Cuartero A. Testing Multivariate Adaptive Regression Splines (MARS) as a Method of Land Cover Classification of TERRA-ASTER Satellite Images. Sensors 2009, 9, 9011–9028. 10.3390/s91109011. [DOI] [PMC free article] [PubMed] [Google Scholar]
- Friedman J. H. Multivariate Adaptive Regression Splines. Ann. Stat. 1991, 19, 1–67. 10.1214/aos/1176347963. [DOI] [Google Scholar]
- Friedman J. H.; Roosen C. B. An Introduction to Multivariate Adaptive Regression Splines. Stat. Methods Med. Res. 1995, 4, 197–217. 10.1177/096228029500400303. [DOI] [PubMed] [Google Scholar]
- Vyas M.; Pareek K.; Spare S.; Garg A.; Gao L. State-of-charge Prediction of Lithium Ion Battery through Multivariate Adaptive Recursive Spline and Principal Component Analysis. Energy Storage 2021, 3, e147. 10.1002/est2.147. [DOI] [Google Scholar]
- Northrop P. W. C.; Pathak M.; Rife D.; De S.; Santhanagopalan S.; Subramanian V. R. Efficient Simulation and Model Reformulation of Two-Dimensional Electrochemical Thermal Behavior of Lithium-Ion Batteries. J. Electrochem. Soc. 2015, 162, A940–A951. 10.1149/2.0341506jes. [DOI] [Google Scholar]
- Newman J.; Tiedemann W. Porous-electrode Theory with Battery Applications. AIChE J. 1975, 21, 25–41. 10.1002/aic.690210103. [DOI] [Google Scholar]
- Gallagher K. G.; Trask S. E.; Bauer C.; Woehrle T.; Lux S. F.; Tschech M.; Lamp P.; Polzin B. J.; Ha S.; Long B.; Wu Q.; Lu W.; Dees D. W.; Jansen A. N. Optimizing Areal Capacities through Understanding the Limitations of Lithium-Ion Electrodes. J. Electrochem. Soc. 2016, 163, A138–A149. 10.1149/2.0321602jes. [DOI] [Google Scholar]
- Du Z.; Wood D. L.; Daniel C.; Kalnaus S.; Li J. Understanding Limiting Factors in Thick Electrode Performance as Applied to High Energy Density Li-Ion Batteries. J. Appl. Electrochem. 2017, 47, 405–415. 10.1007/s10800-017-1047-4. [DOI] [Google Scholar]
- Malifarge S.; Delobel B.; Delacourt C. Experimental and Modeling Analysis of Graphite Electrodes with Various Thicknesses and Porosities for High-Energy-Density Li-Ion Batteries. J. Electrochem. Soc. 2018, 165, A1275–A1287. 10.1149/2.0301807jes. [DOI] [Google Scholar]
- Xue N.; Du W.; Gupta A.; Shyy W.; Marie Sastry A.; Martins J. R. R. A. Optimization of a Single Lithium-Ion Battery Cell with a Gradient-Based Algorithm. J. Electrochem. Soc. 2013, 160, A1071–A1078. 10.1149/2.036308jes. [DOI] [Google Scholar]
- Lenze G.; Röder F.; Bockholt H.; Haselrieder W.; Kwade A.; Krewer U. Simulation-Supported Analysis of Calendering Impacts on the Performance of Lithium-Ion-Batteries. J. Electrochem. Soc. 2017, 164, A1223–A1233. 10.1149/2.1141706jes. [DOI] [Google Scholar]
- Dawson-Elli N.; Lee S. B.; Pathak M.; Mitra K.; Subramanian V. R. Data Science Approaches for Electrochemical Engineers: An Introduction through Surrogate Model Development for Lithium-Ion Batteries. J. Electrochem. Soc. 2018, 165, A1–A15. 10.1149/2.1391714jes. [DOI] [Google Scholar]
- Wu B.; Han S.; Shin K. G.; Lu W. Application of Artificial Neural Networks in Design of Lithium-Ion Batteries. J. Power Sources 2018, 395, 128–136. 10.1016/j.jpowsour.2018.05.040. [DOI] [Google Scholar]
- Lin N.; Xie X.; Schenkendorf R.; Krewer U. Efficient Global Sensitivity Analysis of 3D Multiphysics Model for Li-Ion Batteries. J. Electrochem. Soc. 2018, 165, A1169–A1183. 10.1149/2.1301805jes. [DOI] [Google Scholar]
- Hutzenlaub T.; Thiele S.; Paust N.; Spotnitz R.; Zengerle R.; Walchshofer C. Three-Dimensional Electrochemical Li-Ion Battery Modelling Featuring a Focused Ion-Beam/Scanning Electron Microscopy Based Three-Phase Reconstruction of a LiCoO2 Cathode. AABC Asia 2014 - Adv. Automot. Batter. Confernce, AABTAM Symp. - Adv. Automot. Batter. Technol. Appl. Mark. AABTAM 2014 2014, 21, 131–139. [Google Scholar]
- Guo M.; Kim G. H.; White R. E. A Three-Dimensional Multi-Physics Model for a Li-Ion Battery. J. Power Sources 2013, 240, 80–94. 10.1016/j.jpowsour.2013.03.170. [DOI] [Google Scholar]
- Allu S.; Kalnaus S.; Elwasif W.; Simunovic S.; Turner J. A.; Pannala S. A New Open Computational Framework for Highly-Resolved Coupled Three-Dimensional Multiphysics Simulations of Li-Ion Cells. J. Power Sources 2014, 246, 876–886. 10.1016/j.jpowsour.2013.08.040. [DOI] [Google Scholar]
- Schmidt A. P.; Bitzer M.; Imre Á. W.; Guzzella L. Experiment-Driven Electrochemical Modeling and Systematic Parameterization for a Lithium-Ion Battery Cell. J. Power Sources 2010, 195, 5071–5080. 10.1016/j.jpowsour.2010.02.029. [DOI] [Google Scholar]
- Yamanaka T.; Takagishi Y.; Yamaue T. A Framework for Optimal Safety Li-Ion Batteries Design Using Physics-Based Models and Machine Learning Approaches. J. Electrochem. Soc. 2020, 167, 100516. 10.1149/1945-7111/ab975c. [DOI] [Google Scholar]
- Zhou Z.; Duan B.; Kang Y.; Shang Y.; Cui N.; Chang L.; Zhang C. An Efficient Screening Method for Retired Lithium-Ion Batteries Based on Support Vector Machine. J. Cleaner Prod. 2020, 267, 121882. 10.1016/j.jclepro.2020.121882. [DOI] [Google Scholar]
- Garg A.; Yun L.; Gao L.; Putungan D. B. Development of Recycling Strategy for Large Stacked Systems: Experimental and Machine Learning Approach to Form Reuse Battery Packs for Secondary Applications. J. Cleaner Prod. 2020, 275, 124152. 10.1016/j.jclepro.2020.124152. [DOI] [Google Scholar]
- Senthilselvi A.; Sellam V.; Alahmari S. A.; Rajeyyagari S. Accuracy Enhancement in Mobile Phone Recycling Process Using Machine Learning Technique and MEPH Process. Environ. Technol. Innov. 2020, 20, 101137. 10.1016/j.eti.2020.101137. [DOI] [Google Scholar]
- Zhu F.; Patumcharoenpol P.; Zhang C.; Yang Y.; Chan J.; Meechai A.; Vongsangnak W.; Shen B. Biomedical Text Mining and Its Applications in Cancer Research. J. Biomed. Inf. 2013, 46, 200–211. 10.1016/j.jbi.2012.10.007. [DOI] [PubMed] [Google Scholar]
- Krallinger M.; Leitner F.; Valencia A.. Analysis of Biological Processes and Diseases Using Text Mining Approaches; Springer: 2009. [DOI] [PubMed] [Google Scholar]
- Krallinger M.; Erhardt R. A. A.; Valencia A. Text-Mining Approaches in Molecular Biology and Biomedicine. Drug Discovery Today 2005, 10, 439–445. 10.1016/S1359-6446(05)03376-3. [DOI] [PubMed] [Google Scholar]
- Roberts P. M. Mining Literature for Systems Biology. Briefings Bioinf. 2006, 7, 399–406. 10.1093/bib/bbl037. [DOI] [PubMed] [Google Scholar]
- Nuzzo A.; Mulas F.; Gabetta M.; Arbustini E.; Zupan B.; Larizza C.; Bellazzi R. Text Mining Approaches for Automated Literature Knowledge Extraction and Representation. Stud. Health Technol. Inform. 2010, 160, 954–958. [PubMed] [Google Scholar]
- Structured vs Unstructured Data. Available at https://www.datamation.com/big-data/structured-vs-unstructured-data.html (accessed June 2020).
- Torayev A.; Magusin P. C. M. M.; Grey C. P.; Merlet C.; Franco A. A. Text Mining Assisted Review of the Literature on Li-O 2 Batteries. J. Phys. Mater. 2019, 2, 044004. 10.1088/2515-7639/ab3611. [DOI] [Google Scholar]
- Ghadbeigi L.; Sparks T. D.; Harada J. K.; Lettiere B. R. Data-Mining Approach for Battery Materials. 2015 IEEE Conf. Technol. Sustain. SusTech 2015 2015, 239–244. 10.1109/SusTech.2015.7314353. [DOI] [Google Scholar]
- https://chemistry-europe.onlinelibrary.wiley.com/doi/10.1002/batt.202100076 (accessed in May 2021).
- Swain M. C.; Cole J. M. ChemDataExtractor: A Toolkit for Automated Extraction of Chemical Information from the Scientific Literature. J. Chem. Inf. Model. 2016, 56, 1894–1904. 10.1021/acs.jcim.6b00207. [DOI] [PubMed] [Google Scholar]
- Huang S.; Cole J. M. A Database of Battery Materials Auto-Generated Using ChemDataExtractor. Sci. Data 2020, 7, 260. 10.1038/s41597-020-00602-2. [DOI] [PMC free article] [PubMed] [Google Scholar]
- http://chemdataextractor.org/ (accessed November 2020).
- Kononova O.; Huo H.; He T.; Rong Z.; Botari T.; Sun W.; Tshitoyan V.; Ceder G. Text-Mined Dataset of Inorganic Materials Synthesis Recipes. Sci. Data 2019, 6, 203. 10.1038/s41597-019-0224-1. [DOI] [PMC free article] [PubMed] [Google Scholar]
- Kuniyoshi F.; Makino K.; Ozawa J.; Miwa M.. Annotating and Extracting Synthesis Process of All-Solid-State Batteries from Scientific Literature. 2020, arXiv:2002.07339. arXiv.org e-Print archive. https://arxiv.org/abs/2002.07339.
- Writer B.Lithium-Ion Batteries: A Machine-Generated Summary of Current Research; Springer: 2019. [Google Scholar]
- Kennedy G. F.; Zhang J.; Bond A. M. Automatically Identifying Electrode Reaction Mechanisms Using Deep Neural Networks. Anal. Chem. 2019, 91, 12220–12227. 10.1021/acs.analchem.9b01891. [DOI] [PubMed] [Google Scholar]
- Flores-Leonar M. M.; Mejía-Mendoza L. M.; Aguilar-Granda A.; Sanchez-Lengeling B.; Tribukait H.; Amador-Bedolla C.; Aspuru-Guzik A. Materials Acceleration Platforms: On the Way to Autonomous Experimentation. Curr. Opin. Green Sustain. Chem. 2020, 25, 100370. 10.1016/j.cogsc.2020.100370. [DOI] [Google Scholar]
- https://materialsproject.org/ (accessed November 2020).
- Himanen L.; Geurts A.; Foster A. S.; Rinke P. Data-Driven Materials Science: Status, Challenges, and Perspectives. Adv. Sci. 2019, 6, 1900808. 10.1002/advs.201900808. [DOI] [PMC free article] [PubMed] [Google Scholar]
- Stephan A. K. Standardized Battery Reporting Guidelines. Joule 2021, 5, 1–2. 10.1016/j.joule.2020.12.026. [DOI] [Google Scholar]
- https://www.flow-machines.com (accessed November 2020).
- Majid al-Rifaie M.Weak and Strong Computational Creativity. Computational Creativity Research: Towards Creative Machines; Springer: 2014. [Google Scholar]
- Nath R.; Sahu V. The Problem of Machine Ethics in Artificial Intelligence. AI Soc. 2020, 35, 103–111. 10.1007/s00146-017-0768-6. [DOI] [Google Scholar]
Associated Data
This section collects any data citations, data availability statements, or supplementary materials included in this article.