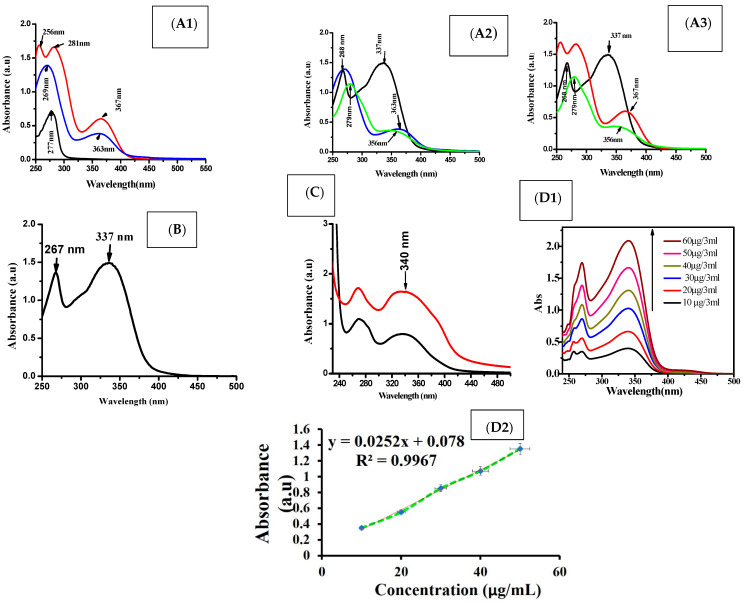
Figure 2.
UV spectra for folic acid (red color), albumin (black color), free capsule (blue color), encapsulated apigenin (green color) (A1–A3) and apigenin (black color) (B). Standard curve for different apigenin concentrations (D1,D2) and the loading capacity of apigenin concentration after encapsulation (C).

