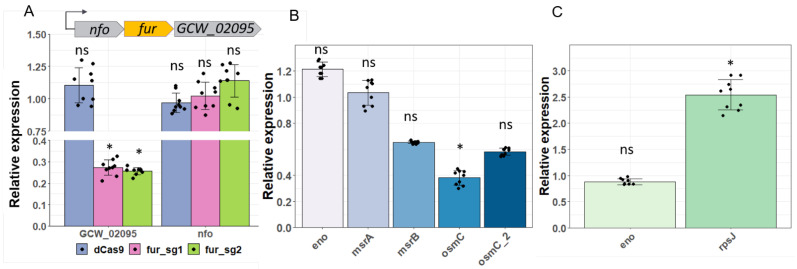
Figure 5.
The effect of gene repression (A) Quantitative RT-PCR analysis showing levels of each gene of fur-containing operon in dcas9 and fur-sgRNAs-expressing transformants compared to those in wild-type bacteria. Top panel is a scheme of operon structure. (B) Expression changes of SpxA-regulated genes in transformants expressing dcas9 and the spxA-sgRNA1 (spxA-sg1) compared to dcas9-expressing transformants. As a control, expression change of eno is shown. (C) Expression level of rpsJ–target of transcription factor WhiA–in the simultaneous dcas9 and whiA-sgRNA2 (whiA-sg2) expressing mycoplasma compared to dcas9-expressing transformants. (*: p-value < 0.05; ns: not significant).

