Abstract
In this work, we demonstrate accurate and precise measurement of manganese (Mn) concentration in human whole blood with indium tin oxide (ITO) electrode using square wave stripping voltammetry. While an essential trace metal for human health, elevated levels of Mn due to environmental or occupational exposure have been associated with severe neuromotor dysfunction characterized by parkinsonism and cognitive dysfunction making the monitoring of Mn in whole blood necessary. Pediatric populations are particularly susceptible to Mn given their developing brain and potential long-term impacts on neurodevelopment. The current gold standard for whole blood Mn measurements is by ICP-MS, which is costly and time consuming. The electrochemical detection with ITO working electrode in this work showed a limit of detection of 0.5 μg l−1 and a linear range of 5 to 500 μg l−1, which encompasses the physiological Mn levels in human whole blood (5–18 μg l−1). Our results of Mn measurement in whole blood show an average precision of 96.5% and an average accuracy of 90.3% compared to ICP-MS for both the normal range (5–18 μg l−1) and the elevated levels (>36 μg l−1) that require medical intervention. These results demonstrate the feasibility of Mn measurements in human blood with electrochemical sensors.
1. Introduction
Manganese (Mn) is an essential trace element that plays a critical role in many enzyme-related physiological processes, including metabolism, immune system function, cellular energy regulation, and neurotransmitter synthesis1–3. Nevertheless, elevated Mn levels lead to neurotoxicity, with adverse health effects that include tremors, difficulty walking, and facial muscle spasms4–7. Studies also suggest that children with high level of Mn may have developmental problems with low performance in school, diminished memory, and attention deficits8–12. Mn is under tight homeostatic control whereas it is Mn is removed from the blood by the liver where it conjugates with bile and is excreted into the intestine13,14. However, exposure to elevated concentrations of airborne Mn, such as steel production, welding, mining, and residential proximity to industrial sources, can result in an inverted-U shaped relationship between exposure and health outcomes15. Mn can enter the brain by passing through the brain-blood-barrier16–20 and has been shown in animal studies to enter the brain directly along the olfactory neurons21,22. Whole blood Mn has been a reliable indicator of elevated Mn exposure23–26. Normal range of Mn in adults is 5–18 μg l−1 in whole blood, and values greater than twice the upper limit of normal correlate with overt disease outcomes, which exhibits central nervous system symptoms resembling idiopathic Parkinson’s disease27.
The clinical gold standard for determination of Mn in blood is by inductively coupled plasma mass spectrometry (ICP-MS). This method offers high accuracy, sensitivity, and the low limit of quantification of ~ 0.1 μg l−1 28–30. However, the bulky instrumentation and need for highly-trained personnel increases cost and turn-around time of the analysis. The approach also requires a relatively large blood sample that must be collected by venipuncture, which makes it problematic for pediatric patients. These requirements limit ICP-MS use to centralized laboratories and make the approach unfeasible for point-of-use (POU) applications.
Stripping voltammetry offers an attractive alternative, and can be inexpensive and miniaturizable. It offers exceptionally low limits of detection, a necessity when working with trace metal analytes at μg l−1 level. With a preconcentration step by either electrodeposition or adsorption, the analyte is first accumulated onto the working electrode surface before the working electrode potential is swept to strip the analyte off the electrode surface, generating a detectable faradaic current that is proportional to the analyte concentration in solution. Both anodic and cathodic stripping voltammetry have been used to detect Mn with various electrodes, including glassy carbon31, mercury32,33, bismuth34, palladium35, platinum36,37, and ITO38,39. However, most of the demonstrations are performed in buffer or inorganic sample solutions. Determination of Mn in biological samples presents a significant challenge for the electroanalytic detection due to the complexity of the sample matrix, which causes biofouling on the sensor and diminished signal40–42. Rusinek et al. demonstrated measurement of Mn in a bovine blood sample of 50 μg l−1, with accuracy of 80% as compared with ICP-MS.39 However, the normal Mn concentration range in bovine blood is 70 ~ 90 μg l−1 43–46, which is much higher than that in human blood. Also, differences in Mn distribution in blood fractions between human blood and bovine blood can make the Mn detection in human blood more challenging,47,48 For human samples, Wang et al. detected 25–50 μg l−1 Mn spiked in human plasma with a mercury electrode, showing good accuracy in comparison with GF-AAS49. However, the Mn levels detected were at 3–25× higher than what is expected physiologically. Thus, electrochemical determination of Mn in human blood within the physiological range remains as a challenge and is yet to be reported.
In this paper, for the first time, we report on accurate Mn determination in human whole blood by cathodic stripping voltammetry (CSV) using an ITO electrode. Our prior work38,39 showed that ITO electrodes exhibit superior performance for detection of Mn in buffer and bovine blood, while Pt electrodes lose majority of the signal in human blood despite successful detection of Mn in buffer and drinking water.36,37 Herein, a blood digestion protocol was optimized to fully de-complex Mn bound to protein, with minimal dilution. CSV preconcentration parameters (potential and time), stripping waveform parameters (period and amplitude), and pH of the electrolyte solution were optimized. The ITO sensors exhibited a linear range of 5 to 500 μg l−1, which totally encompasses the physiological Mn levels in human whole blood (5–18 μg l−1), and ~90.3% accuracy and ~96.5% precision as compared with ICP-MS.
2. Experimental methods
2.1. Reagents
Trace Metal grade nitric acid (67 ~ 70%) and sodium hydroxide monohydrate (Honeywell, Fluka) for trace analysis were purchased from Fisher Scientific. Hydrogen peroxide solution (30%) for ultra-trace analysis, sodium acetate buffer (3.0 M, pH 5.2 ± 0.1) were purchased from Sigma Aldrich. A 1000 mg l−1 Mn2+ atomic absorption standard was purchased from Acros Organics. A 5.0 M sodium hydroxide solution was prepared by dissolving 2.9 g sodium hydroxide in 10 ml of deionized (DI) water. A 0.1 M acetate buffer was prepared by dilution from 3.0 M acetate buffer stock solution. Mn solutions with desired concentrations were prepared by diluting 1000 mg l−1Mn standard with 0.1 M acetate buffer.
2.2. Blood digestion
We performed both hot block digestion and microwave digestion to compare their efficiency and efficacy. To prevent Mn contamination during the digestion process, Pyrex and quartz digestion tubes were acid washed by soaking in 20% nitric acid for 24 h and rinsed with DI water before use. To confirm the absence of Mn, digestion tubes were first run with blanks. For this, a 0.5 ml DI water, 1 ml trace metal grade nitric acid, and 0.5 ml trace metal grade hydrogen peroxide were mixed and microwave digested at 200 °C for 3 min. After the digestion, the solutions were analyzed with ICP-MS to confirm the absence of Mn.
Human whole blood in BD Vacutainer® with K2 EDTA anticoagulant was purchased from ZenBio Inc. The blood samples were refrigerated at 4°C prior to testing. The digestion started by vortexing the blood sample thoroughly to provide a homogenous matrix. For hot block digestion, we adopted the conditions previously developed by collaborators for bovine blood digestion39. Specifically, 0.25 ml human blood was pipetted into a 10 ml digestion vial and digested with 0.7 ml HNO3 at 90 °C for 30 min and then 120 °C for 90 min. The vial was then removed from the hot block and allowed to cool for 10 min. A 0.18 ml 30% H2O2 aliquot was added into the vial and heated at 120 °C for another 90 min. The sample was then cooled down again and finally heated at 120 °C for 45 min with additional 0.12 ml 30% H2O2. The entire process took about 5 h and the resulting dilution factor of the digestion was 5×.
Microwave blood digestions were performed with a Discover SP-D Clinical microwave digestion system (CEM Inc.). A 0.25 ml blood sample was pipetted into a 10 mL digestion vial, followed by 0.5 ml HNO3 and 0.25 ml H2O2. The digestion vial was gently agitated to mix, and allowed to rest for 5 min. The vial was sealed with a PTFE cap and digested at 200 °C with 7 min ramp-up, 3 min hold time, and 300 psi maximum pressure. The resulting dilution factor of the digestion was 4×. To assess efficiency and potential contamination during the digestion process, the digested blood sample and the original whole blood sample were analyzed with ICP-MS. After the digestion, the blood was titrated with 5.0 M NaOH to adjust pH to desired values. To eliminate any Mn contamination during sample transfer and reagent pipetting, trace metal free pipette tips (Cole-Palmer) were used.
2.3. Analytical Experiments
Potentiostat/Galvanostat (Reference 600+, Gamry Instrument) was used in all electrochemical experiments. Cyclic voltammetry (CV) and CSV measurements were executed in a 20 ml conventional three electrode cell consisting of ITO working electrode, a Ag/AgCl reference electrode (3.0 M KCl solution), and a platinum (Pt) wire auxiliary electrode. The ITO electrode was formed by coating 1.1 mm thick glass slides that are 10 mm × 28 mm in size (1737F, Corning) with a 135 nm thick, 11−50 Ω/sq layer of ITO (Thin Film Devices, Anaheim, CA). In all the experiment, a 750 μl sample of whole blood was digested and pH adjusted, yielding ~8 ml sample solution volume under test (due to ~10.5 dilution factor).
CV was performed to investigate the potential window and the redox peak potentials of Mn2+ with the ITO sensor in the digested and pH adjusted blood. The sweep rate for CV was 100 mV s−1. For CSV, after a series of optimizations of pH values, preconcentration conditions and stripping waveform parameters, we selected pH of 5.0, 1.2 V as the preconcentration potential with 180 s duration, a stripping range from 1.2 to 0.2 V, and waveform parameters of 70 ms period, 5 mV increment, and 25 mV amplitude. CSV was performed in both blood sample and 0.1 M sodium acetate buffer to compare performance of the ITO electrode in different matrices. The CSV parameters of the platinum and glassy carbon electrodes were: 900 s preconcentration at 1.0 V, a stripping range from 1.0 to 0.4 V, and waveform parameters of 70 ms period, 4 mV increment, and 25 mV amplitude. The extrapolated baseline current method described by Kissinger and Heineman was used to measure peak current height and area50. The current sign of CSV measurements was not shown with IUPAC convention, and thus the reduction/cathodic current exhibits a positive sign. Independent measurements of the blood samples were performed using Thermo iCAP Q ICP-MS instrument (ThermoFisher Scientific, Waltham, MA).
3. Results and discussion
3.1. Validation of microwave digestion with ICP-MS
To demonstrate electroanalytical measurement of Mn in blood, the first step is to free-up the metal ions. In human blood, the majority of Mn2+ ions are bound to protein, with about 80% bound to hemoglobin in erythrocytes and another 20% to proteins in plasma such as transferrin and globulin51,52. To free-up this protein-bound Mn (II) for electrochemical measurements, blood needs to be fully digested to mineralize the proteins to release all the Mn2+ ions. Conventionally, blood is digested on a hot block in a strong oxidizer (e.g., nitric acid or a mixture of nitric acid and hydrogen peroxide) at elevated temperature, which mineralizes proteins and releases Mn2+. However, for the hot block system with open vials, the digestion temperature is limited to 120 °C by the boiling temperature of 68% nitric acid, leading to a low digestion efficiency. Further, the large amount of acid needed for digestion causes significant dilution and thus lower Mn concentration in the digested blood, creating a challenge with respect to detection limit for the subsequent detection step.
Microwave digestion, on the other hand, can circumvent the temperature limitation of the hot block digestion by using a sealed vial, with pressure increasing from several hundreds to one thousand PSI. Thus, higher temperature can be used to shorten the digestion time and to minimize volume of acid. In addition, the closed vial system can prevent the analyte loss due to volatilization as well as any accidental contamination. Further, the microwave digestion process rapidly heats the sample, resulting in significant time savings.
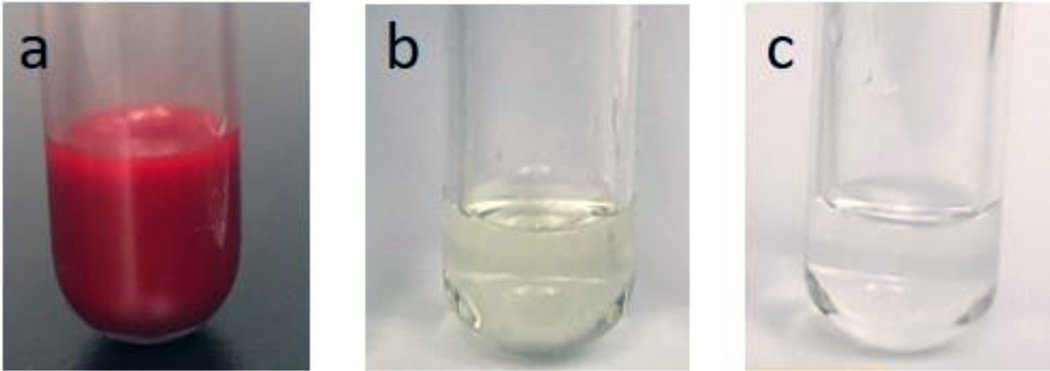
In this work, we have performed both hot block and microwave digestions to evaluate and compare their efficiency and efficacy. The representative digested samples are shown in Fig. 1. As the figure illustrates, the color of the sample digested by hot block for 5 h with a dilution factor of 5× is still yellowish, suggesting an incomplete digestion. In contrast, the sample obtained by microwave digestion within 15 min and with a dilution factor of 4× is clear and colorless. From these results we conclude that microwave digestion is substantially faster, yielding a fully digested sample after only 15 min, and requires less acid, giving a lower dilution factor. This suggests superior efficiency and efficacy. Thus, the microwave digested sample with dilution factor 4× was selected for the subsequent electrochemical sensors experiments.
Figure 1.
Comparison of the whole blood digestion methods. (a) Whole blood sample prior to digestion. (b) Blood sample after hot block digestion for 5 h with dilution factor of 5×. (c) Blood sample after microwave digestion for 15 min with dilution factor of 4×.
Mn contamination from the digestion should be carefully avoided to ensure accurate measurement results. The average Mn content is 5000 μg l−1 in Pyrex glass and 10 μg l−1 in quartz53. Since neither Pyrex glass nor quartz digestion tubes are metal free, proper cleaning of the digestion tubes and validation with blank samples are necessary. Table 1 shows the ICP-MS data for Mn concentration in blank samples digested in the Pyrex glass and quartz tubes. Without acid washing, the blank samples digested in two Pyrex glass tubes show >1 μg l−1 of Mn, indicating that the sample picked up contamination from the tubes. This is obviously problematic when performing sensor measurements in the single μg l−1 range. After acid washing, Mn concentration of the blank samples decreased to 0.18 μg l−1, which suggests acid washing effectively removes majority of Mn contamination, as expected. Similarly, acid-washed quartz tubes exhibited very low Mn contamination level, <0.05 μg l−1. Since Mn in blood is at low μg l−1 level, the contamination picked up in the acid-washed tubes can be considered negligible. Based on these results, all the blood digestion in this work was performed in the acid-washed quartz tubes.
Table 1.
Mn concentration of blank samples (DI water, trace metal grade nitric acid, trace metal grade hydrogen peroxide) digested in Pyrex and quartz digestion tubes without and with acid cleaning.
| Mn in blank #1 (μg l−1) | Mn in blank #2 ( μg l−1) | |
|---|---|---|
| Pyrex tube without acid cleaning | 1.61 | 1.23 |
| Pyrex tube with acid cleaning | 0.18 | 0.18 |
| Quartz tube with acid cleaning | 0.05 | 0.04 |
After eliminating contamination from the digestion step, we next examined whether there was Mn loss due to volatilization during the blood digestion process. To do this, the digested blood and the corresponding original whole blood samples were analyzed with ICP-MS. Since the ICP-MS requires acid concentration of the samples to be 3% - 5%, we further diluted the digested blood samples about 7.5 times to meet the requirement, resulting a final dilution factor of ~30 for the digested blood samples undergoing ICP-MS measurements. Table 2 shows the results of four pairs of digested blood and the corresponding whole blood samples. As the table indicates, all the Mn concentrations in the digested blood samples match with the corresponding whole blood samples once adjusted for the dilution factor. On average, the recovery rage of the digestion process is estimated at 96.5% (±1.9). Thus, we conclude that our microwave digestion process exhibits minimal loss and contamination during analysis, while maintaining a high rate of recovery.
Table 2.
Comparison of Mn concentrations in whole blood samples and digested blood samples analyzed by ICP-MS. The recovery rate ~96.5% (±1.9) shows minimal Mn loss and no contamination during the microwave digestion process.
| Whole blood sample | Mn in whole blood (μg l−1) | Mn in digested sample (μg l−1) | Dilution factor | Calculated Mn in whole blood (μg l−1) | Recovery (%) |
|---|---|---|---|---|---|
| A | 8.95 | 0.27 | 31.0 | 8.37 | 93.5 |
| B | 7.61 | 0.25 | 29.6 | 7.40 | 97.2 |
| C | 29.07 | 0.88 | 32.3 | 28.42 | 97.8 |
| D | 27.93 | 0.84 | 32.4 | 27.25 | 97.4 |
3.2. Cyclic voltammetry
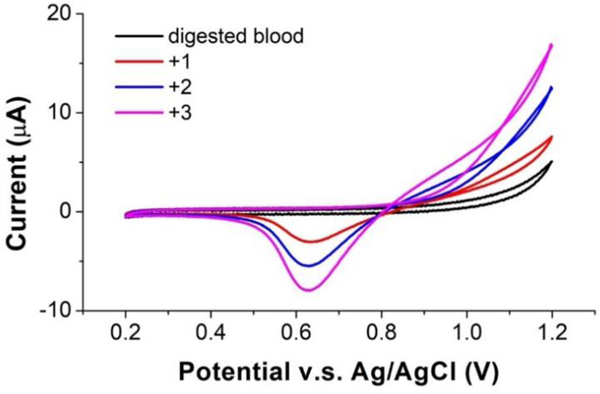
Cyclic voltammetry was performed to initially investigate the potential window of the ITO sensor and the electrochemistry (redox peaks) of Mn2+ at ITO in the blood samples. In previous work38, sodium acetate buffer with pH 5 showed the best performance for Mn measurement with an ITO sensor. Thus, herein the digested blood sample was titrated with 5 M NaOH to pH 5 for CV measurements. Fig. 2 shows representative cyclic voltammograms of the digested and pH-adjusted blood sample, and the sample spiked with 1 mg l−1, 2 mg l−1 and 3 mg l−1 Mn. As the figure indicates, the voltammogram of the original pH adjusted blood sample exhibited a flat region from 0.2 V to 1.1 V, which is well-suited for Mn stripping analysis. For the solutions containing Mn, the forward scan of the voltammogram shows an anodic wave commencing around +800 mV for the oxidation of Mn2+ to MnO2, which deposits on the ITO surface; the reverse scan shows a cathodic wave at ca. +625 mV which is attributed to the reduction of MnO2 back to Mn2+. This reduction wave exhibits the characteristic for reduction of a surface deposited material in that the current drops rapidly back toward zero current after passing the peak potential since diffusion is not involved. This reduction peak is well separated from the positive potential limit of ITO of 1.2 V making the peak current easy to measure for quantitation. The peak current increased as the Mn concentration increased from 1 to 3 mg l−1, as expected. In the spiked samples, anodic current for oxidation of Mn2+ also climbed with increased Mn concentration at positive potentials beyond +0.8 V as expected. Although the oxidation peak was incomplete when reaching the upper limit of the ITO potential range at 1.2 V, it clearly showed that potentials higher than +0.8 V can induce oxidation of Mn2+. For the CSV measurement, this is sufficient as long as the preconcentration potential can induce oxidation for deposition on MnO2 at the electrode, and only the complete, well-defined reduction peak is critical for accurately correlating peak area/current with Mn concentration.
Figure 2.
Cyclic voltammograms of ITO in digested blood. Increasing reduction peaks at a potential of 0.625 V are shown for blood spiked with 1 mg l−1, 2 mg l−1 and 3 mg l−1 Mn.
3.3. Cathodic stripping voltammetry
Square wave cathodic stripping voltammetry was used for Mn determination to achieve low limits of detection by minimizing non-faradaic current54,55. During the measurement, the working electrode was firstly biased at a positive potential to deposit insoluble MnO2 on the electrode surface by oxidizing Mn2+, following the reaction below:
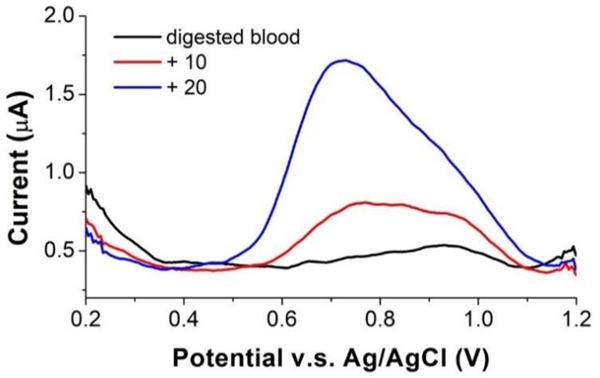
When the preconcentration step is done, the electrode potential is then swept negatively to reduce insoluble MnO2 back to Mn2+ and strip it off the surface. And the cathodic current was measured and correlated to the concentration of Mn2+ in the solution. Fig. 3 shows voltammograms for Mn2+ measurement in the digested blood. A single well-defined reduction peak was obtained in the digested blood sample. The peak height and area increased, and some peak broadening occurred as 10 μg l−1 and 20 μg l−1 Mn2+ were spiked into the sample. In addition, the voltammogram in Fig. 3 shows current peaks at two different potentials. In the original digested blood with lower Mn concentration, the dominant current peak was at ~ 0.9 V. As Mn spiked into the blood sample, the peak at ca. 0.75 V grew and eventually dominated. The first current peak at ~0.9 V was due to the reduction of first deposited monolayer of MnO2 on ITO, and stopped increasing with concentration, while the second current peak at ~0.7 V was due to the reduction of additional deposited MnO2 layers and thus continued to grow very large with increasing concentration. We also compared quantitation by measuring peak current versus peak area (charge) and found the latter to give the lower LOD, probably because of the peak broadening as concentration increases. Due to the peak potential shift and the peak broadening, we then decided to use peak area as the signal.
Figure 3.
Stripping voltammograms of digested blood samples on ITO electrode. The voltammograms show a well-defined peak for the blood sample and increased peaks as 10 μg l−1 and 20 μg l−1 of Mn were spiked into the blood sample.
3.4. Optimization of SWSV
To obtain the optimal conditions for Mn measurements, impacts of sample pH and preconcentration potential were examined first. 15 μg l−1 Mn was used for the test and the preconcentration time was kept at 3 mins. The pH was varied from 3.0 to 7.0 in one-unit increments, while potential was varied from 0.9 V to 1.4 V in 0.1 V increments. The CSV measurements were performed repeatedly, in a full factorial design. Fig. 4(a) illustrates voltammograms with fixed preconcentration potential of 1.2 V and pH ranging from 3.0 to 7.0. The most acidic solutions, at lower pH, prevented Mn2+ oxidation, while the neutral solution caused formation of insoluble manganese hydroxide and precipitation in solution, also deterring oxidation of Mn2+. Thus, a weakly acidic solution at pH 5.0 ~ 6.0 yielded the highest signal. Fig. 4(b) shows voltammograms with fixed pH of 5.0 and the preconcentration potential ranging from 1.0 V to 1.4 V. The lower potential was insufficient to oxidize Mn2+ at the maximum possible rate, resulting in a smaller peak; while the higher potential led to bubble formation on the electrode surface which hindered mass transport of Mn2+ to the electrode surface, also resulting in a smaller peak. Preconcentration potential of 1.2 V resulted in the largest peak. Plotting the 25 pair combinations of pH and preconcentration potential as a surface plot (Fig. 4(c)) makes it easy to discern that pH 5 at 1.2 V, and pH 6 at 1.1 – 1.2 V show the regions giving the largest peak charges. The former was chosen for all subsequent experiments, as it simplified pH adjustment of the digested sample and reduced the necessary sample dilution.
Figure 4.
Optimization of pH and preconcentration potential for square wave stripping voltammetry by comparisons of the peak area for digested blood sample. (a) Voltammograms of ITO in digested blood at pH 5.0 with the preconcentration potential ranging from 1.0 to 1.4 V. (b) Voltammograms of ITO in digested blood with 1.2 V preconcentration potential and pH ranging from 3.0 to 7.0. (c) Measured peak area (charge in μC) as a function of pH and preconcentration potential.
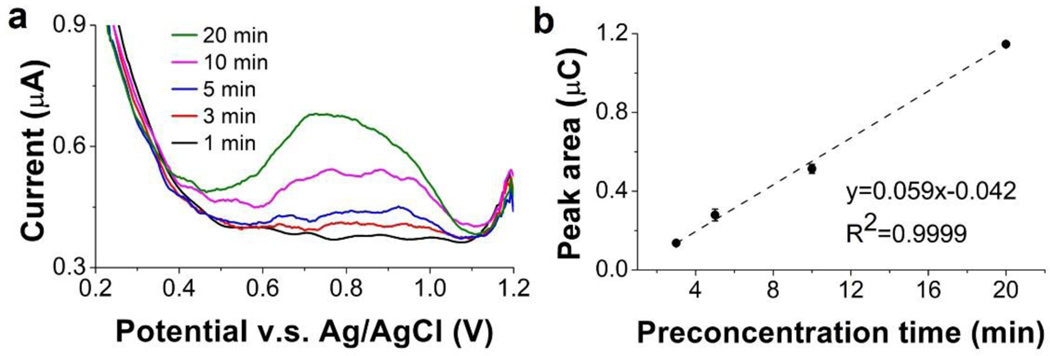
Next, we investigated the impact of the preconcentration time, which can affect current response and yield higher stripping current signal due to larger quantity of the deposited metal. We optimized preconcentration time with a blood sample containing the lowest Mn concentration among the blood samples we obtained. The Mn concentration was 5 μg l−1 in the whole blood sample; after digestion and pH adjustment, the blood sample was diluted 10×, resulting in a digested blood sample with 0.5 μg l−1 Mn. Preconcentration times of 1 to 20 min were applied in the CSV measurement. As shown in Fig. 5, with 1 min preconcentration time, there was no measurable peak, indicating an insufficient preconcentration. For the preconcentration time of 3 min, a well-defined peak was observed. The peak area increased linearly with the preconcentration time from 3 to 20 min. Since the experiment was executed in 10 ml digested blood sample, 20 min was not sufficiently long for the electrode to accumulate all Mn2+ in the sample during the deposition step and yield a saturated signal. In the interest of a faster analysis, the shortest time capable of generating detectable signal for 0.5 μg l−1 Mn (i.e., 3 min) was selected. For Mn concentrations below 0.5 μg l−1, which were not encountered in this work, longer preconcentration time such as 5 and 10 min can also be used.
Figure 5.
Optimization of preconcentration time. (a) Voltammograms of ITO in the digested blood sample containing 0.5 μg l−1 Mn. (b) Measured peak area as a function of preconcentration time.
3.5. Calibration in digested blood
With the optimized CSV parameters, a calibration curve was constructed to investigate linearity, sensitivity, and detection limits of the ITO sensor in digested blood. The initial Mn concentration in the blood sample was confirmed with ICP-MS to ensure measurement accuracy. Fig. 6(a) shows stripping voltammograms of the ITO sensor in the digested blood with the Mn concentration ranging from 0.7 μg l−1 to 53 μg l−1. For comparison, Fig. 6(b) shows voltammograms of the ITO sensor in 0.1 M acetate buffer with Mn concentrations ranging from 0 to 50 μg l−1.
Figure 6.
Voltammograms of ITO in digested blood (pH: 5.0) with Mn concentration ranging from 0.7 μg l−1 to 53 μg l−1 (a) and 0.1 M sodium acetate buffer (pH: 4.65) with Mn concentration ranging from 0 μg l−1 to 50 μg l−1 (b). (c) Calibration curve of ITO sensor in digested blood and acetate buffer based on peak area.
The two sets of voltammograms were used to develop calibration curves for the ITO sensor. Fig. 6(c) illustrates the calibration curves based on the peak area, which is an approach we used previously36. Sensitivity in the digested blood was 215 nC (μg l−1)−1, which is comparable to 198 nC (μg l−1) −1 in the acetate buffer. Both calibration curves exhibit good linearity in the range of 1 μg l−1 to 50 μg l−1, with R2 = 0.998 for blood and R2 = 0.997 for buffer. The LOD was calculated as 0.05 μg l−1 based on 3σ/slope. The performance is comparable to work by Rusinek et al. who reported LOD of their ITO sensor as 0.06 μg l−1, but in 0.1 M acetate buffer38. Considering the ~10× dilution from the digestion and pH adjustment process, the linear range of the ITO sensor spans the normal Mn range in whole blood, which is 5 to 18 μg l−1.
3.6. Reproducibility
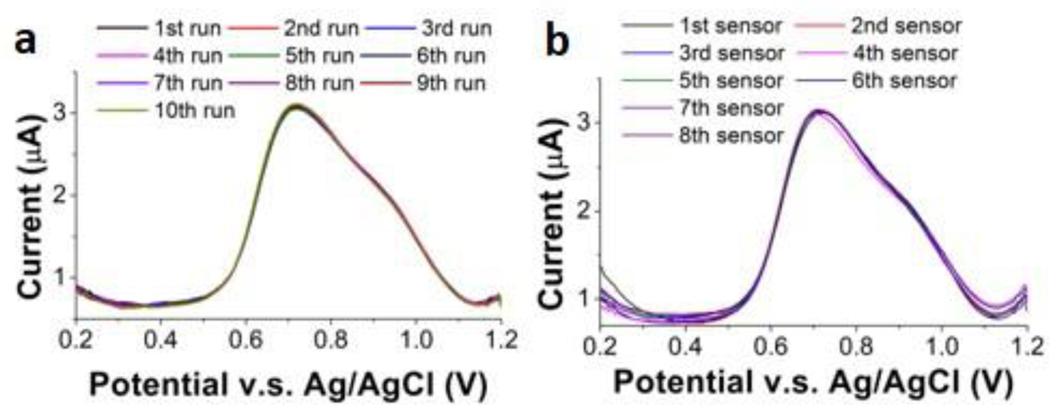
The intra-reproducibility of the ITO electrode was tested to determine precision of the measurements in digested blood. We performed CSV of 50 μg l−1 Mn in a digested blood sample with the same electrode 10×. Peak areas (Fig. 7 (a)) were consistently in the range from 9.83 μC to 10.1 μC, generating a coefficient of variation of only ~2%. The inter-reproducibility of the ITO electrode was also tested with 8 different electrodes, repeating 3× (n = 3) for each electrode. As shown in Fig. 7 (b), the peak area obtained with the 8 electrodes ranged from 9.28 μC to 9.97 μC, with a variation of ~7%. This is a slight improvement on our earlier work that showed Pt sensors to have an average variability of 9%36. Ultimately, we have confirmed that the sensor is capable of performing reproducibly with precision >90%.
Figure 7.
Study of reproducibility by measuring 50 μg l−1 Mn in digested blood with one ITO electrode for 10 runs and 8 different ITO electrodes. (a) Voltammograms of ten runs with the same ITO electrode in 50 μg l−1 Mn in the digested blood (Inset: measured peak area of the ten runs). (c) Voltammograms of 8 different ITO electrodes in 50 μg l−1 Mn in the digested blood. (Inset: Measured peak area of the 8 ITO electrodes).
3.7. Interference study
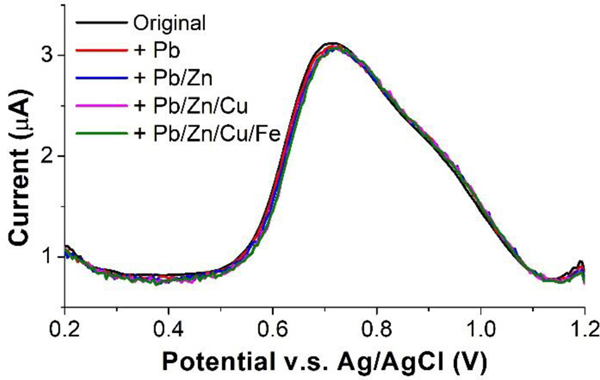
We performed a series of studies of trace metals in the blood that might potentially interfere with Mn CSV, to ensure accurate and reliable determination of Mn in blood samples. We selected several metal ions including Pb2+, Zn2+, Cu2+, and Fe3+ based on literature56,57. Although Fe2+ is also known to be one of the main interfering metals for Mn detection36,58, since our blood samples were digested with strong oxidizer (nitric acid/hydrogen peroxide), all Fe2+ ions should have been oxidized to Fe3+ ions. Thus, in the interference study we did not select Fe2+. All four ions are considered the most common interferences for Mn. The highest concentrations of Pb2+, Zn2+, Cu2+, and Fe3+ in the normal ranges in blood are 100 μg l−1, 1200 μg l−1, 1450 μg l−1, and 336 μg l−1, respectively. The influence of different levels of these metals of 500 μg l−1, 1200 μg l−1, 1500 μg l−1 and 500 μg l−1 were analyzed by spiking them into a digested blood sample containing 50 μg l−1 Mn, followed by comparisons of the peak area and voltammogram definition of CSV under the exact same conditions. As shown in Fig. 8, we confirmed that none of these metals have a detectable influence on the Mn stripping signal, including both the peak shape and area.
Figure 8.
Voltammograms of 50 μg l−1 Mn with and without the presence of interfering metals: 500 μg l−1 Pb2+, 1200 μg l−1 Zn2+, 1500 μg l−1 Cu2+, and 500 μg l−1 Fe3+. Inset: Measured peak area of 50 μg l−1 Mn with and without the presence of other metals.
3.8. Standard addition measurement and comparison with ICP-MS
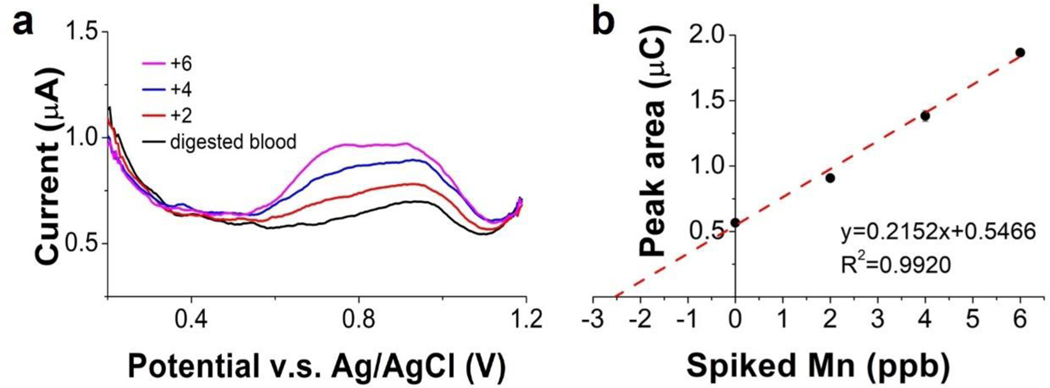
We used the ITO sensor to determine Mn in digested blood and compared with ICP-MS analysis of these samples. The standard addition method was used to calculate the concentration of Mn2+ in the original samples. The dilution factors for all blood samples from the digestion and pH adjustment process varied slightly from each other but were all around 10. A 2μg l−1 Mn aliquot was spiked into the sample at each step of the standard addition process. The voltammograms of the original digested blood sample, 2 μg l−1, 4 μg l−1 and 6 μg l−1 Mn spiked samples are shown in Fig. 9(a). The resulting standard addition plot of peak area yielded a correlation equation of Q (μC) = 0.2152 [Mn (ppb)] + 0.5466, with R2 = 0.992. Mn concentration in the digested blood was obtained by dividing the y-intercept with the slope of the calibration curve. From the calibration curve, the Mn concentration in the digested blood should be 2.54 μg l−1. Mn concentration in the corresponding original whole blood sample was obtained by multiplying the Mn concentration in the digested blood with the dilution factor. For this sample, the dilution factor from the digestion and pH adjustment process is 10.5, so the Mn concentration in the original whole blood should be 26.7 μg l−1.
Figure 9.
Determination of Mn in human blood sample using SWCSW and the method of standard additions. (a) Voltammograms of the digested blood samples with and without Mn additions. (b) Standard addition plot of peak area. The original concentration of Mn in the whole blood sample can be calculated using the equation in (b) and the dilution factor from the digestion and pH adjustments.
Seven different blood samples were tested with the square wave stripping voltammetry and all the blood samples were analyzed with ICP-MS for comparison. The results are summarized in Table 3. As the table shows, blood samples with Mn concentrations ranging from 8.7 μg l−1 to 55.3 μg l−1 were tested, and our measurement results exhibited an average precision of 96.5% and an average accuracy of 90.3% as compared to ICP-MS. In the previous work, 80% accuracy was obtained for Mn measurement in a bovine blood sample with 60 μg l−1 Mn39. The accuracy was significantly improved in this work, especially for lower Mn concentrations within the physiological range (5–18 μg l−1) in the human blood.
Table 3.
Electrochemical sensor performance compared with ICP-MS. Each measurement was performed in triplicate (n = 3).
| Sample | ICPMS Mn (μg l−1) | CSV Mn (μg l−1) | C.V. (%) | Precision (%) | Accuracy (%) |
|---|---|---|---|---|---|
| 1 | 8.7 | 9.5 | 5.2 | 94.8 | 90.8 |
| 2 | 9.0 | 11.0 | 5.8 | 94.2 | 77.8 |
| 3 | 24.1 | 28.1 | 2.8 | 97.2 | 83.0 |
| 4 | 28.9 | 26.7 | 3.4 | 96.6 | 92.3 |
| 5 | 30.9 | 29.6 | 2.0 | 98.0 | 95.8 |
| 6 | 39.2 | 36.4 | 2.7 | 97.3 | 92.8 |
| 7 | 55.3 | 55.0 | 2.5 | 97.5 | 99.4 |
Conclusions
In this work, for the first time, we demonstrate accurate and precise measurements of Mn concentration in human whole blood with square wave stripping voltammetry. For the sample preparation, we compared block digestion and microwave digestion and found microwave digestion to be superior in both efficacy and efficiency. We optimized the microwave digestion process to yield fully digested blood samples. For the stripping voltammetry, we optimized the experimental conditions such as preconcentration potential, time, and pH of the digested blood samples. The ITO electrode showed a sensitivity of 215 nC (μg l−1) −1, a linearity of 0.998 in the digested blood samples, and a detection of limit of 0.05 μg l−1 (calculated). The linear range from 5 to 500 μg l−1 covers the physiological Mn levels in human whole blood. Our results showed an average precision of 96.5% and an average accuracy of 90.3% compared to ICP-MS. The favorable results suggest the capability of Mn measurement in human blood with electrochemical approaches and the feasibility of further development of an electrochemical point-of-care system using ITO as the sensor.
Acknowledgements
This work was supported in part by the National Institute of Environmental Health and Sciences (R33ES024717; R01ES022933; P30ES026529; R01ES026446; R24ES030904), and by the Richard and Loan Hill Department of Bioengineering at the University of Illinois at Chicago.
References
- 1.Manganese in Metabolism and Enzyme Function, Elsevier, (1986) https://linkinghub.elsevier.com/retrieve/pii/B9780126290509X50017. [Google Scholar]
- 2.Aggett PJ, Clin. Endocrinol. Metab, 14, 513–543 (1985). [DOI] [PubMed] [Google Scholar]
- 3.Avila DS, Puntel RL, and Aschner M, Met. Ions Life Sci, 13, 199–227 (2013). [DOI] [PMC free article] [PubMed] [Google Scholar]
- 4.Iwami O, Watanabe T, Moon C-S, Nakatsuka H, and Ikeda M, Sci. Total Environ, 149, 121–135 (1994). [DOI] [PubMed] [Google Scholar]
- 5.Perl DP and Olanow CW, J. Neuropathol. Exp. Neurol, 66, 675–682 (2007). [DOI] [PubMed] [Google Scholar]
- 6.Levy BS and Nassetta WJ, Int. J. Occup. Environ. Health, 9, 153–163 (2003). [DOI] [PubMed] [Google Scholar]
- 7.Harischandra DS, Ghaisas S, Zenitsky G, Jin H, Kanthasamy A, Anantharam V, and Kanthasamy AG, Front. Neurosci, 13 (2019) [DOI] [PMC free article] [PubMed] [Google Scholar]
- 8.Kim Y, Kim BN, Hong YC, Shin MS, Yoo HJ, Kim JW, Bhang SY, and Cho SC, NeuroToxicology, 30, 564–571 (2009). [DOI] [PubMed] [Google Scholar]
- 9.Farias AC Cunha A, Benko CR, McCracken JT, Costa MT, Farias LG, and Cordeiro ML, J. Child Adolesc. Psychopharmacol, 20, 113–118 (2010). [DOI] [PubMed] [Google Scholar]
- 10.Henn BC, Ettinger AS, Schwartz J, Téllez-Rojo MM, Lamadrid-Figueroa H, Hernández-Avila M, Schnaas L, Amarasiriwardena C, Bellinger DC, Hu H, and Wright RO, Epidemiol. Camb. Mass, 21, 433–439 (2010). [DOI] [PMC free article] [PubMed] [Google Scholar]
- 11.Bouchard MF, Sauvé S, Barbeau B, Legrand M, Brodeur M-È, Bouffard T, Limoges E,Bellinger DC, and Mergler D, Environ. Health Perspect, 119, 138–143 (2011). [DOI] [PMC free article] [PubMed] [Google Scholar]
- 12.Wasserman GA, Liu X, Parvez F, Factor-Litvak P, Ahsan H, Levy D, Kline J, van Geen A, Mey J, Slavkovich V, Siddique AB, Islam T, and Graziano JH, Neurotoxicology, 32, 450–457 (2011). [DOI] [PMC free article] [PubMed] [Google Scholar]
- 13.Bertinchamps A, Miller S, and Cotzias G, Am. J. Physiol.-Leg. Content, 211, 217–224 (1966). [DOI] [PubMed] [Google Scholar]
- 14.Davis CD, Zech L, and Greger JL, Proc. Soc. Exp. Biol. Med. Soc. Exp. Biol. Med. N. Y. N, 202, 103–108 (1993). [DOI] [PubMed] [Google Scholar]
- 15.Balachandran RC Mukhopadhyay S, McBride D, Veevers J, Harrison FE, Aschner M,Haynes EN, and Bowman AB, J. Biol. Chem, jbc.REV119.009453 (2020). [DOI] [PMC free article] [PubMed] [Google Scholar]
- 16.Crump KS, J. Expo. Sci. Environ. Epidemiol, 10, 227–239 (2000). [DOI] [PubMed] [Google Scholar]
- 17.Ellingsen DG, Hetland SM, and Thomassen Y, J. Environ. Monit, 5, 84–90 (2003). [DOI] [PubMed] [Google Scholar]
- 18.Wang D, Du X, and Zheng W, Toxicol. Lett, 176, 40–47 (2008). [DOI] [PMC free article] [PubMed] [Google Scholar]
- 19.Crossgrove JS and Yokel RA, NeuroToxicology, 26, 297–307 (2005). [DOI] [PubMed] [Google Scholar]
- 20.Aschner M, Guilarte TR, Schneider JS, and Zheng W, Toxicol. Appl. Pharmacol, 221, 131–147 (2007). [DOI] [PMC free article] [PubMed] [Google Scholar]
- 21.Brenneman KA, Wong BA, Buccellato MA, Costa ER, Gross EA, and Dorman DC, Toxicol. Appl. Pharmacol, 169, 238–248 (2000). [DOI] [PubMed] [Google Scholar]
- 22.Dorman DC, Brenneman KA, McElveen AM, Lynch SE, Roberts KC, and Wong BA, J. Toxicol. Environ. Health A, 65, 1493–1511 (2002). [DOI] [PubMed] [Google Scholar]
- 23.Roels H, Lauwerys R, Genet P, Sarhan MJ, de Fays M, Hanotiau I, and Buchet JP,Am. J. Ind. Med, 11, 297–305 (1987). [DOI] [PubMed] [Google Scholar]
- 24.Järvisalo J, Olkinuora M, Kiilunen M, Kivistö H, Ristola P, Tossavainen A, and Aitio A, Int. Arch. Occup. Environ. Health, 63, 495–501 (1992). [DOI] [PubMed] [Google Scholar]
- 25.Roels HA, Ghyselen P, Buchet JP, Ceulemans E, and Lauwerys RR, Br. J. Ind. Med, 49, 25–34 (1992). [DOI] [PMC free article] [PubMed] [Google Scholar]
- 26.Baldwin M. Mergler D, Larribe F, Bélanger S, Tardif R, Bilodeau L, and Hudnell K,Neurotoxicology, 20, 343–353 (1999). [PubMed] [Google Scholar]
- 27. https://www.mayocliniclabs.com/test-catalog/Clinical+and+Interpretive/89120.
- 28.Goullé JP Mahieu L, Castermant, Neveu N, Bonneau L, Lainé G, Bouige D, and Lacroix C, Forensic Sci. Int, 153, 39–44 (2005). [DOI] [PubMed] [Google Scholar]
- 29.Nunes JA Batista BL, Rodrigues JL, Caldas NM, Neto JAG, and F B Jr, J. Toxicol. Environ. Health A, 73, 878–887 (2010). [DOI] [PubMed] [Google Scholar]
- 30.Jones DR, Jarrett JM, Tevis DS, Franklin M, Mullinix NJ, Wallon KL, Quarles CD, Caldwell KL, and Jones RL, Talanta, 162, 114–122 (2017). [DOI] [PMC free article] [PubMed] [Google Scholar]
- 31.Di J. and Zhang F, Talanta, 60, 31–36 (2003). [DOI] [PubMed] [Google Scholar]
- 32.O’Halloran RJ, Anal. Chim. Acta, 140, 51–58 (1982). [Google Scholar]
- 33.Wang J. and Mahmoud JS, Anal. Chim. Acta, 182, 147–155 (1986). [Google Scholar]
- 34.Banks CE, Kruusma J, Moore RR, Tomčík P, Peters J, Davis J, Komorsky-Lovrić Š, and Compton RG, Talanta, 65, 423–429 (2005). [DOI] [PubMed] [Google Scholar]
- 35.Kang W. Pei X, Bange A, Haynes EN, Heineman WR, and Papautsky, Anal. Chem, 86, 12070–12077 (2014). [DOI] [PMC free article] [PubMed] [Google Scholar]
- 36.Kang W. Rusinek C, Bange A, Haynes E, Heineman WR, and Papautsky I, Electroanalysis, 29, 686–695 (2017). [DOI] [PMC free article] [PubMed] [Google Scholar]
- 37.Boselli E, Wu Z, Friedman A, Claus Henn B, and Papautsky I, Environ. Sci. Technol, 55, 7501–7509 (2021). [DOI] [PMC free article] [PubMed] [Google Scholar]
- 38.Rusinek CA, Bange A, Warren M, Kang W, Nahan K, Papautsky I, and Heineman WR, Anal. Chem, 88, 4221–4228 (2016). [DOI] [PMC free article] [PubMed] [Google Scholar]
- 39.Rusinek CA, Kang W, Nahan K, Hawkins M, Quartermaine C, Stastny A, Bange A, Papautsky, and Heineman WR, Electroanalysis, 29, 1850–1853 (2017). [Google Scholar]
- 40.Kuhlmann J, Dzugan LC, and Heineman WR, Electroanalysis, 24, 1732–1738 (2012). [Google Scholar]
- 41.Trouillon R. and O’Hare D, Electrochimica Acta, 55, 6586–6595 (2010). [Google Scholar]
- 42.Trouillon R, Combs Z, Patel BA, and O’Hare D, Electrochem. Commun, 11, 1409–1413 (2009). [Google Scholar]
- 43.Hesketh S, Sassoon J, Knight R, Hopkins J, and Brown D, J. Anim. Sci, 85, 1596–609 (2007). [DOI] [PubMed] [Google Scholar]
- 44.Wang H, Liu Z, Liu Y, Qi Z, Wang S, Liu S, Dong S, Xia X, and Li S, Acta Sci. Vet, 15. [Google Scholar]
- 45.R. D. Djokovic, V. S. Kurcubic, and Z. Z. Ilic, 6.
- 46.Milatovic D. and Gupta RC, in Veterinary Toxicology (Third Edition), Gupta RC, Editor, p. 445–454, Academic Press; (2018) [Google Scholar]
- 47.Hidiroglou M, Can. J. Anim. Sci, 59, 217–236 (1979). [Google Scholar]
- 48.Gibbons RA, Dixon SN, Hallis K, Russell AM, Sansom BF, and Symonds HW, Biochim. Biophys. Acta, 444, 1–10 (1976). [DOI] [PubMed] [Google Scholar]
- 49.Wang S. and Ye B, Electroanalysis, 20, 984–988 (2008). [Google Scholar]
- 50.Kissinger P. and Heineman WR, Laboratory Techniques in Electroanalytical Chemistry, Revised and Expanded, p. 825, CRC Press, (2018). [Google Scholar]
- 51.Chang SS, Li NC, and Pratt DW, J. Magn. Reson 1969, 18, 117–122 (1975). [Google Scholar]
- 52.Scheuhammer AM and Cherian MG, Biochim. Biophys. Acta BBA - Gen. Subj, 840, 163–169 (1985). [DOI] [PubMed] [Google Scholar]
- 53.Buldini PL, Ricci L, and Sharma JL, J. Chromatogr. A, 975, 47–70 (2002). [DOI] [PubMed] [Google Scholar]
- 54.Osteryoung JG and Osteryoung RA, Anal. Chem, 57, 101A–110A (1985). [Google Scholar]
- 55.O’Dea JJ, Osteryoung Janet, and Osteryoung RA, Anal. Chem, 53, 695–701 (1981). [Google Scholar]
- 56.Locatelli C. and Torsi G, J. Electroanal. Chem, 509, 80–89 (2001). [Google Scholar]
- 57.Locatelli C, Electroanalysis, 16, 1478–1486 (2004). [Google Scholar]
- 58.Labuda J, Vaníčková M, and Beinrohr E, Microchim. Acta, 97, 113–120 (1989). [Google Scholar]


