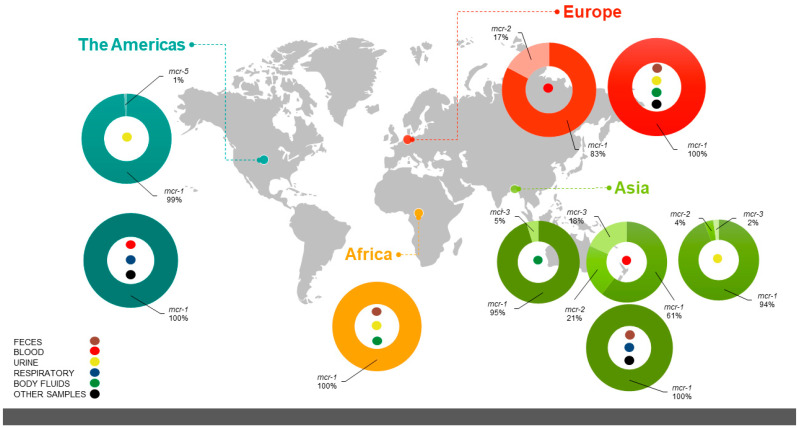
Figure 4.
Global distribution of prevalence and diversity of mcr variants of E. coli isolates described in clinical studies. The colored pie charts represent the percent distribution of mcr variants in each continent—light green, Asia; red, Europe; yellow, Africa; dark green, the Americas. The colored circles indicate the nature of the clinical sample constituting the source of the isolate: brown circles, feces; red circles, blood; yellow circles, urine; blue circles, respiratory; green circles, body fluids; and black circles, other samples.

