Abstract
The calcium carbonate (CaCO3) scale is one of the most common oilfield scales and oil and gas production bane. CaCO3 scale can lead to a sudden halt in production or, worst-case scenario, accidents; therefore, CaCO3 scale formation prevention is essential for the oil and gas industry. Scale inhibitors are chemicals that can mitigate this problem. We used two popular theoretical techniques in this study: Density Functional Theory (DFT) and Ab Initio Molecular Dynamics (AIMD). The objective was to investigate the inhibitory abilities of mixed oligomers, specifically acrylamide functionalized silica (AM-Silica). DFT studies indicate that Ca2+ does not bind readily to acryl acid and acrylamide; however, it has a good binding affinity with PAM and Silica functionalized PAM. The highest binding affinity occurs in the silica region and not the –CONH functional groups. AIMD calculations corroborate the DFT studies, as observed from the MD trajectory that Ca2+ binds to PAM-Silica by forming bonds with silicon; however, Ca2+ initially forms a bond with silicon in the presence of water molecules. This bonding does not last long, and it subsequently bonds with the oxygen atoms present in the water molecule. PAM-Silica is a suitable calcium scale inhibitor because of its high binding affinity with Ca2+. Theoretical studies (DFT and AIMD) have provided atomic insights on how AM-Silica could be used as an efficient scale inhibitor.
Keywords: acrylamide functionalized silica, DFT study, Ab Initio Molecular Dynamics, oilfield scales
1. Introduction
Scale deposition is the bane of the oil and gas industry. These oilfield scales often contain calcium carbonates and sulfates, including barium sulfate, iron sulfides, and many others [1,2]. Calcium carbonate (CaCO3) is one of the most frequently occurring scales [3]. This scaling can occur during oil production, stimulation, and even transportation. CaCO3 scale formation occurs when is supersaturated with or carbonates, as illustrated in Equations (1) and (2):
| (1) |
| (2) |
Different factors cause ion supersaturation. Seawater can react with the formation water in offshore fields such as the North Sea, leading to CaCO3 deposits that hinder oil production, which is a significant problem [4]. The High Pressure and High Temperature (HPHT) operating conditions during the production process also contribute to scaling deposition [5]
The consequences of calcium scale deposition can bring production capacity to a halt in a few hours, with a very high treatment cost [6]. A notable example is the North Sea Miller oilfield incident, where scale deposition decreased production from 30,000 barrels of oil per day to zero in just one day [7,8]. Other issues caused by scale include pipe blockage, which hinders fluid flow; damage to subsurface equipment; and increased corrosion rates [9,10]. These problems can lead to severe accidents that affect production safety and economics [11].
Calcium scales can be removed by mechanical or chemical means. Mechanical removal refers to physical deposit removal. This method can exacerbate the situation by aiding the rate of corrosion, often known as pitting corrosion since tiny holes are made in the metal pipes during cleaning [1]. Some scales, such as calcium sulfate, are impossible to remove mechanically [5]. Chemical removal is low in cost and can be used to remove scales that are not physically accessible; however, some chemicals, such as hydrochloric acid, can worsen the situation by producing corrosive hydrogen sulfide gas. A better approach for scale mitigation would be prevention or scale inhibition. This approach ensures continuous production, unlike removal, which requires a stop in production.
Many types of scale inhibitors (SI) have been used in the last decade to hinder CaCO3 scale [12,13,14,15]. Scale inhibitors often function in two ways: an adsorption effect or a morphological change in the growing site. Adsorption effects occur when the inhibitor occupies the nucleation sites; therefore, the crystals cannot find surfaces to adhere to and will not grow. The morphological change method occurs when the inhibitor is adsorbed, which changes the scale’s morphology, making it difficult for the scale to remain and grow [4]. SIs are often categorized as organic or inorganic inhibitors. Phosphates and their salts are often inorganic. Polymers, such as polyacrylic acid (PAA) and sulfonated polymers, and copolymers containing sulfonated and phosphonated moieties are examples of organic SIs [16]. The primary aim of the chemical inhibitors is to sequester the calcium ion; therefore, they prevent it from reacting with carbonate or bicarbonate ions, which prevents calcium carbonate scale formation [16,17,18].
Polyacrylamide (PAM) is used extensively in the oil industry for enhanced oil recovery. This substance is used as a flocculant in water treatments due to its ability to bridge particles and form aggregates with good settling properties [19,20]. PAM’s amount of branching and charge density and its flocculation and adsorption capacity increase when the molecular weight is increased, enhancing its overall performance [21]. PAM hydrolysis results in the generation of more carboxylic groups at high temperatures, which act as Ca2+ adsorption or binding sites.
Polymer functionalization improves material performance [22]. Silica (SiO2) has been mixed with PAM to create adsorbents, partly due to its large surface area coupled with its stability and ease of modification. Functionalization has been applied to removing heavy metals such as mercury (Hg) and lead (Pb) [23,24]. Silicon’s negative charge may act as a nucleation site for the metal ions.
Theoretical studies have provided exceptional insights on the atomistic scale that aids in understanding chemical process mechanisms. This application has also gained wide use in oilfield chemistry, particularly in scale removal [9,25,26,27,28]. Density Functional Theory (DFT) and Ab Initio Molecular Dynamics (AIMD) are reliable theoretical techniques that provide accurate results for understanding chemical systems.
DFT and AIMD were used in this study to understand the Ca2+ removal process using mixed oligomers of acrylic acid, acrylamide, and PAM functionalized silica (PAM-Silica). Due to the computational costs of the methods employed. The PAM model used was simplified based on its functional property (-CH2CHCONH2-). These insights will allow us to design better polymer-based scale inhibitors, assisting in calcium-based scale formation prevention, previously studied experimentally by our group [29]. The binding affinities of these polymers to Ca2+ were studied alongside other quantum chemical parameters, such as molecular electrostatic potential (MEP) and frontier molecular orbital (FMO) maps using DFT. Also, QTAIM analysis was done to validate the binding energies observed in the DFT calculations. AIMD calculations provide detailed information about the movement of the atoms and molecules in the chemical system, with the most promising results from the DFT calculations to better understand how they interact. Combining these two techniques gives an accurate and detailed understanding of Ca2+ adsorption by the studied polymers, including silica functionalized PAM.
2. Computational Details
2.1. Quantum Chemical Calculations
The Gaussian 09 code [30] was used for all DFT quantum calculations. All calculations were completed using the B3LYP level of theory with the TZVP basis set. The level of theory B3LYP is robust and well-known in theoretical scale inhibitor studies since it gives reliable results with reasonable computational costs [31,32]. We chose TZVP (triple-zeta valence with polarization) to minimize basis set superposition errors, despite it being computationally expensive compared to other reliable basis sets such as 631g-(d) [33,34]. All calculations were performed using water as a solvent with the PCM-SCRF (Polarizable Continuum Model-Self-Consistent Reaction Field). Vibrational frequencies were calculated, and the absence of negative values implied true minima and no imaginary frequency present. Gauss View 5.0 [35,36] was used to visualize molecular electrostatic and frontier molecular orbital maps. The Quantum Theory Atom In Molecules (QTAIM) developed by Bader [37] was done on the optimized structures from Gaussian 09 to validate the binding interactions with the aid of Multiwfn program [38]. QTAIM analysis has proven to be a useful tool in analyzing bond interactions [39]. The VMD program [40] was employed for the visualization of the QTAIM Bond Critical Points (BCP).
2.2. AIMD Calculations
The Ab Initio Molecular Dynamics (AIMD) calculations were performed with VASP code (v5.4.4) [41,42,43] using periodic boundary conditions (PBC). The Projected-Augmented-Waves Perdew-Burke-Ernzerhof (PAW-PBE) pseudopotentials [44] under the Generalized Gradient Approximation (GGA) exchange form of correlation were used for all elements in the system studied. The temperature was set to begin at 298 K and increased to 373 K at a 1.25 × 10⁻⁴ K/ps rate since many operating conditions in the oil industry are approximately 373 K. The number of ionic steps and time steps were 20,000 and 0.5 fs, respectively, with a total of 10 ps simulation time. However, in following best practices, the first 2 ps was not considered in the trajectory to enable the system get equilibrated. The inclusion of Grimme’s DFT+D3 [45,46,47] was included in the calculation has it has shown to improve the accuracy of the results by describing the dispersion forces in the studied system.
The implicit solvent was considered by implementing the VASPsol models [27,48]. This was done to simulate a realistic model. This method has proved to be reliable as it is better than the Finite-Difference Poisson Boltzmann (FDPB) approach and on par with the Solvation Model Density (SMD) approach [49]. Moreover, this method has also been applied to polymer systems [50] Though it is important to note that the perfect simulation of reality based on quantum-mechanical description remains a tricky situation [51]. A 1 × 1 × 1 Gamma (γ) grid was employed for the k-point and the planewave energy cut-off was set to the default which is the largest ENMAX in the POTCAR. The Quantum ATK Virtual NanoLab builder and MD analyzer [52] were used to build and visualize the model.
3. Results and Discussion
3.1. Binding Affinities
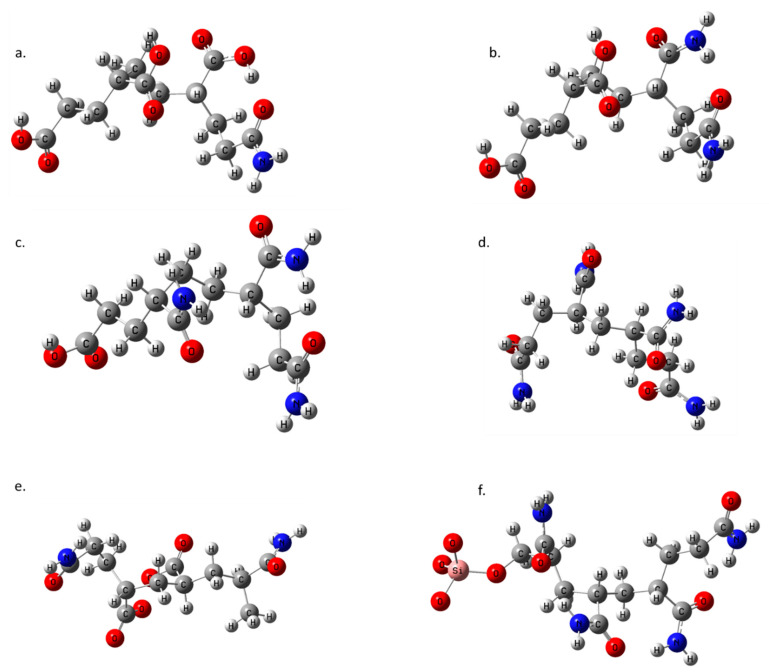
The Ca2+ ion was complexed with the DFT optimized structures of six oligomers (Figure 1). The binding affinities of these oligomers were calculated using Equation (3). The first three sets of oligomers were a mix of acryl acid (AA) and acrylamide (AM) monomers. The first oligomer contained 70% acryl acid. Three of the four monomer units were acryl acid, and the last was acrylamide (AA-AA-AA-AM). The second oligomer had 50% each acryl acid and acrylamide (AA-AA-AM-AM), while the third oligomer contained three units of acrylamide and one unit of acryl acid (AA-AM-AM-AM). The mixed oligomers all had positive values, denoting that the binding affinity with the Ca2+ ion was weak.
| (3) |
Figure 1.
The optimized structures of (a) AA-AA-AA-AM (70%-Acrylic Acid), (b) AA-AA-AM-AM (50% each of acryl acid and acryl amide), (c) AA-AM-AM-AM (70% acryl amide), (d) PAM, (e) PAM_hydrolyzed, and (f) PAM-Silica.
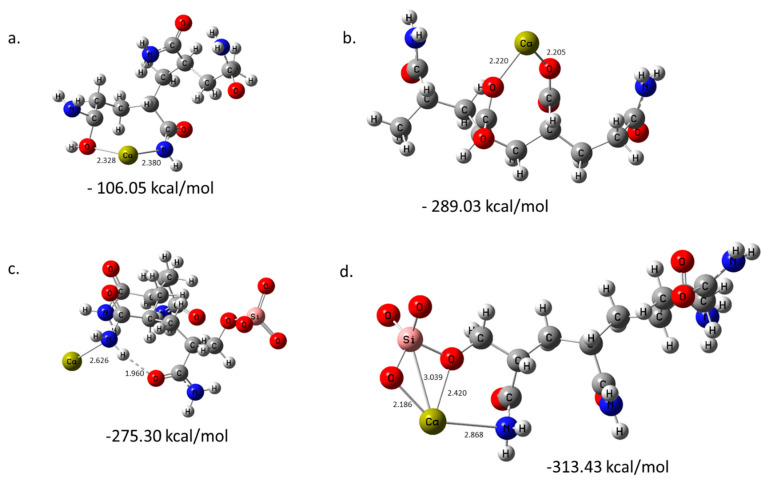
The remaining three oligomers (Figure 2) had negative values, denoting good binding affinity with the Ca2+ ion. The fourth oligomer comprised four acrylamide (PAM) units and had a binding affinity of −106.05 kcal/mol (Figure 2a). AM oligomer formed two bonds with Ca2+: the Ca-O bond with a bond length of 2.328 Å, and Ca-N with a length of 2.380 Å. The fifth oligomer of the hydrolyzed_PAM had a binding affinity of −289.03 kcal/mol, which is more than double the binding affinity for PAM alone; however, this double-fold increase is possibly due to the bond type formed. Two bonds are formed in hydrolyzed_PAM; however, the two bonds formed are Ca-O bonds with bond lengths of 2.220 Å and 2.205 Å, unlike PAM, where one of the bonds formed was Ca-N. These results imply that Ca-O bonds are shorter and stronger than Ca-N bonds. A silica-functionalized AM was the last oligomer studied; however, the binding affinities were studied at two positions. The first position studied was the binding affinity of PAM_Silica with Ca2+ ions using the oxygen and nitrogen atoms (Figure 2c). The binding affinity was −275.30 kcal/mol. This complex only formed one bond: Ca-N (2.626 Å).
Figure 2.
The optimized structures and binding energies of (a) Ca-PAM, (b) Ca-PAM_ hydrolyzed, (c) Ca-PAM_Silica1, and (d) Ca-PAM_Silica2. All bond lengths are in Angstroms.
Nevertheless, its relatively high binding affinity compared to ordinary PAM (−106.05 kcal/mol) is possible due to intra-hydrogen bonding, which contributes positively to its binding affinity. The second position studied the binding of Ca2+ to the silica part of the oligomer (Figure 2d). The binding affinity calculated was the highest amongst all studied oligomers (−313.43 kcal/mol). Ca2+ was within the bonding distance of four atoms, including two Ca-O bonds with 2.185 Å and 2.420 Å bond lengths, one Ca-N bond (2.868 Å), and a Ca-Si bond (3.039 Å). The presence of these bonds is responsible for its high binding affinity, implying that functionalizing PAM with silica will significantly increase its binding affinity to Ca2+ ions. These results agree with what has been observed, where the adsorption of SiO2-PAM on Ca2+ is a spontaneous process, primarily due to chemical interaction and chelation [53].
| (4) |
3.2. QTAIM Analysis
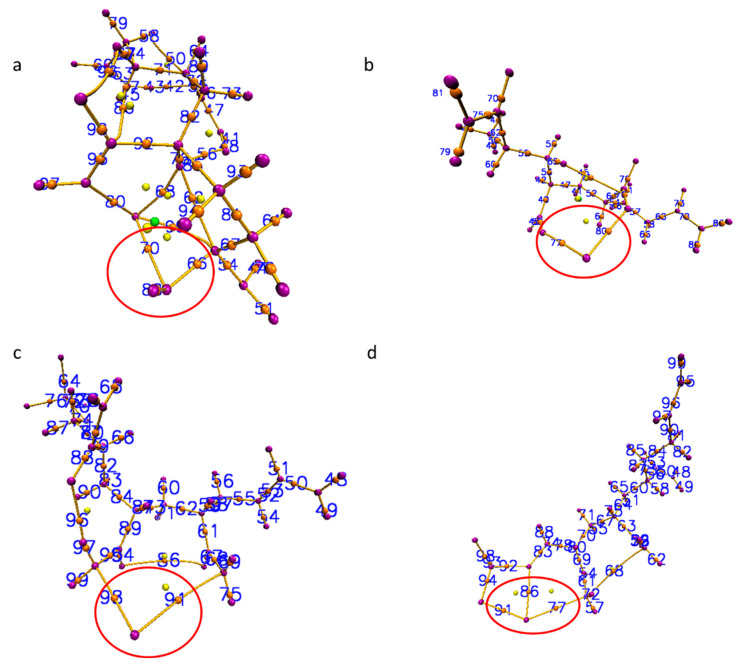
The QTAIM analysis confirmed the presence of 3, 2, 2, 3 BCPs (3, −1) for Ca-PAM, Ca-PAM-hydro, Ca-PAM-Silica I and Ca-PAM Silica_2 respectively (Table 1). The DFT calculated energy values and binding energies for all the studied complexes can be seen in the supplemental information’s Table S1. The BCPs are illustrated in red circles in Figure 3. Usually, low electron density (ρ(r)) −0.001 to −0.059 a.u, positive values of the Laplacian (∇2 ρ(r)), and zero or near zero energy density (Hb)- 0.000 to 0.005 a.u. at BCPs denote typical non-covalent interactions [54,55]. The interaction energies which are defined based on the works of Espinosa et al. [56] and Vener et al. [57] for Einta and Eintb respectively show that non-covalent interactions exist between Ca-H in Ca-PAM and Ca-N in Ca-PAM_Slica1 and Ca-PAM_Silica 2. However, the high interaction energy observed in Ca-PAM_Silica 2 implies a degree of covalency and this corroborates the high binding energy observed from the DFT calculations. The trend in both the QTAIM interactions enegies correlates with the same trend observed in the binding energy calculation, with Ca-PAM_Silica2 having the highest in both cases. There is no significant difference between the Einta and Eintb except in Ca-PAM_Silica 2, where Einta is about 3 kcal/mol higher than Eintb.
Table 1.
The Eint energies derived from DFT and QTAIM calculations.
| Complex | ρ(r) | ∇2 ρ(r) | Hb | V(r) | G(r) | Einta | Eintb | |
|---|---|---|---|---|---|---|---|---|
| BCP | Ca_PAM | |||||||
| 68 | Ca-H | 0.015 | 0.062 | 0.002 | −0.0109 | 0.013 | 3.42 | 3.55 |
| 70 | Ca-O | 0.040 | 0.207 | 0.003 | −0.0458 | 0.049 | 14.42 | 13.19 |
| 80 | Ca-N | 0.043 | 0.174 | 0.001 | −0.0417 | 0.043 | 13.13 | 11.52 |
| Ca_PAM_hydro | ||||||||
| 80 | Ca-O | 0.050 | 0.270 | 0.003 | −0.0598 | 0.063 | 18.84 | 17.05 |
| 77 | Ca-O | 0.050 | 0.279 | 0.004 | −0.0611 | 0.065 | 19.24 | 17.68 |
| Ca_PAM_SiO2-I | ||||||||
| 91 | Ca-N | 0.001 | 0.005 | 0.000 | −0.0005 | 0.001 | 0.15 | 0.23 |
| 98 | Ca-N | 0.024 | 0.090 | 0.002 | −0.0184 | 0.021 | 5.81 | 5.59 |
| Ca_PAM_SiO2-II | ||||||||
| 77 | Ca-N | 0.013 | 0.005 | 0.000 | −0.0005 | 0.0111 | 2.78 | 3.00 |
| 86 | Ca-O | 0.030 | 0.160 | 0.005 | −0.0309 | 0.035 | 9.75 | 9.58 |
| 91 | Ca-O | 0.059 | 0.286 | 0.000 | −0.0720 | 0.072 | 22.68 | 19.39 |
Figure 3.
The bond critical points (BCP) of (a) Ca-PAM, (b) Ca-PAM_ hydrolyzed, (c) Ca-PAM_Silica1, and (d) Ca-PAM_Silica2. The BCP in red circles are those of concern that form bonds with Ca2+.
3.3. Quantum Chemical Analysis
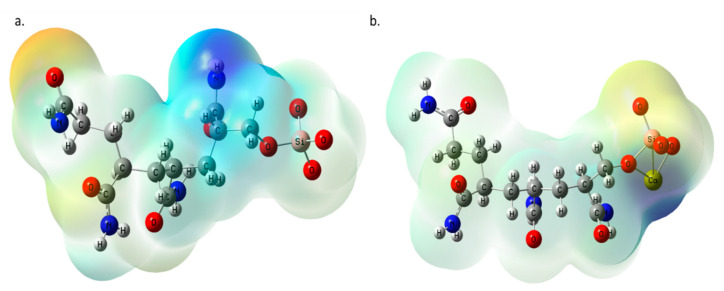
The electronic structure calculations from DFT give rise to other interesting studies, which provide atomistic insights into how molecules are formed. These insights include the molecular electrostatic potential (MEP) and frontier molecular orbitals (FMO) maps. The MEP denotes the charge distribution within the molecule, designated by yellow, orange, and red, with red being the most electronegative. Regions of electropositivity are represented as green, blue, and violet, with violet corresponding to the most electropositive region. The MEP maps of the silica functionalized PAM before and after binding with Ca2+ are compared in Figure 4. The MEP before the binding is primarily electronegative, with the oxygen atoms appearing in the yellow region except for where silicon is located, which seems very light yellow. This change in electronegativity is possibly a neutralization effect by the silicon atom since it is less electronegative than the surrounding oxygen atoms, which are highly electronegative.
Figure 4.
The molecular electrostatic potential maps for (a) PAM-Silica and (b) Ca-PAM_Silica2.
A small blue region denotes electropositivity on the hydrogen atom of the –CONH functional group preceding silica. This electropositivity is possibly due to the close proximity of the silicon atom to the –CONH functional group. This group is also coupled with the many carbon and hydrogen atoms that are less electronegative; therefore, the high electronegativity of the nitrogen and oxygen atoms of the –CONH group is neutralized. The second position has the highest binding affinity, involving a Ca-Si bond. The MEP map for Ca-PAM-Silica indicates a solid electropositive (deep blue) region at the location of Ca2+ and its surrounding atoms (silicon and oxygen), indicating that Ca2+ is electropositive and forms strong bonds with the surrounding oxygen atoms, dominating the oxygen atoms’ electronegativity. A yellow region is located where the only oxygen atom (SiO4−) is not binding to Ca2+, indicating that this oxygen atom still retains its high electronegativity. The electronegativity is somewhat neutralized; therefore, the color is yellow instead of red due to its nearness to Ca2+. The rest of the molecule is primarily light blue, denoting an overall electropositive charge.
The Highest Occupied Molecular Orbital (HOMO) and Lowest Unoccupied Molecular Orbital (LUMO) make up the Frontier Molecular (FMO) Orbitals. These orbitals give insight into the electron delocalization of the electrons in the molecule. The PAM HOMO map indicates that the electrons are delocalized at the –CONH end of the molecule (Figure 5a). Electron delocalization upon binding with Ca2+ occurs where Ca2+ bonds with the silicon and oxygen atoms, denoting electron exchange (Figure 5b). The LUMO of PAM-Silica (Figure 6a) reveals that the electrons are mostly delocalized at the silica region, similar to the HOMO of PAM-Silica when bound to Ca2+ (Figure 5b). This phenomenon indicates that the HOMO and LUMO of PAM-Silica occur at both molecule ends. The electrons are delocalized at the atoms close to the calcium bonded region when the LUMO of PAM-Silica is bound to Ca2+ (Figure 6b). The number of lobes is higher than ordinary PAM-silica alone in the HOMO and LUMO maps of the Ca2+ bonded PAM-Silica, implying that electrons are more delocalized when PAM-Silica bounds to Ca2+.
Figure 5.
The Highest Occupied Molecular Orbital (HOMO) maps for (a) PAM-Silica and (b) Ca-PAM_Silica.
Figure 6.
The Lowest Unoccupied Molecular Orbital (LUMO) maps for (a) PAM-Silica and (b) Ca-PAM_Silica.
3.4. AIMD Analysis
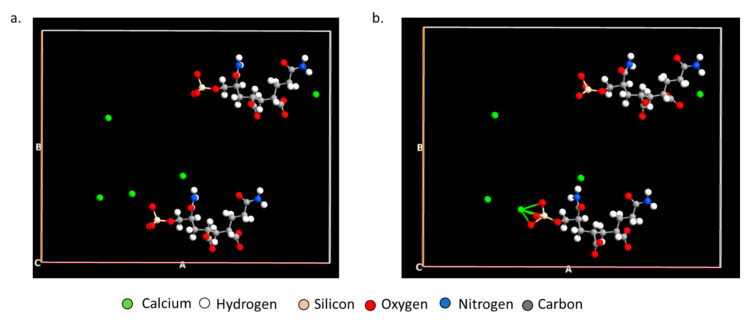
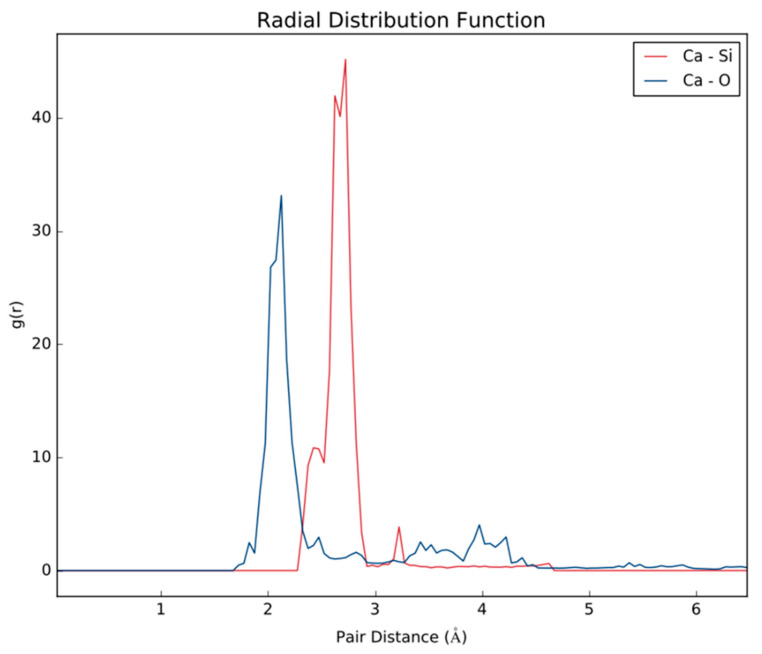
Ab Initio Molecular Dynamics (AIMD) further establishes how PAM-Silica would interact with calcium ions by observing the time evolution in the trajectory. Two AIMD systems were studied: the first system studied the interaction between PAM-Silica and Ca2+ ions. In contrast, the second system was similar to the first system but included explicit water molecules. The MD trajectory analysis confirmed earlier observations from the DFT studies that Ca2+ would preferentially bind to the silica region instead of the –CONH functional groups (Figure 7b). Ca forms Ca-O and Ca-Si bonds, as observed earlier from DFT. The radial distribution function (RDF), which is the probability of finding an atom at a distance r from another tagged atom, was analyzed between Ca-O and Ca-Si atoms (Figure 8). The RDF indicated that both Ca-Si and Ca-O were within bonding distance, less than 3 Å; however, Ca-Si has a more prominent and higher peak, implying that the probability of occurrence for the Ca-Si bond is higher than the Ca-O bonds.
Figure 7.
The (a) initial and (b) final position of the MD trajectory of PAM-Silica with Ca2+ ions.
Figure 8.
The radial distribution function of the MD trajectory of PAM-Silica with Ca2+ ions.
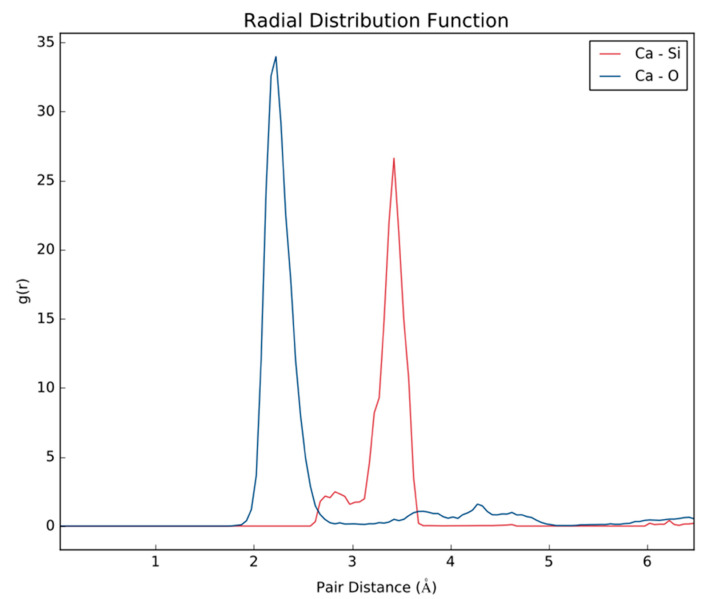
Table 2 ions were put in closer proximity to PAM-Silica to enable easier binding since AIMD is computationally expensive and can only be observed for a few picoseconds. The initial stage depicts two water molecules and one Ca2+ near PAM-Silica (Figure 8a); however, Ca2+ first bonds to the silica region, not the water molecules (Figure 9b). There is competition between the oxygen molecules in the water and the oxygen molecules in the silica region as the simulation evolves; however, there is no longer a Ca-Si bond (Figure 9c). RDF was analyzed to clarify the Ca-O and Ca-Si interactions (Figure 10). The Ca-O peak is much larger and higher than the Ca-Si peak, unlike the first system studied. The Ca-Si peak occurs primarily after 3 Å, implying that the two atoms are not within bonding distance most of the time; therefore, Ca2+ would bond more to water molecules in the presence of water molecules. Ca2+ will still bind to the oxygen atoms in the silica region of PAM-Silica.
Table 2.
Summary of model systems and calculation types.
| Model System | Calculation Type | Program | Remark |
|---|---|---|---|
| AA-AA-AA-AM (70%-Acrylic Acid) | DFT Optimization | Gaussian 09 | ✓ |
| AA-AA-AM-AM (50% each of acryl acid and acryl amide) | DFT Optimization | Gaussian 09 | ✓ |
| AA-AM-AM-AM (70% acryl amide) | DFT Optimization | Gaussian 09 | ✓ |
| PAM | DFT Optimization | Gaussian 09 | ✓ |
| PAM_hydrolyzed | DFT Optimization | Gaussian 09 | ✓ |
| PAM Silica | DFT Optimization | Gaussian 09 | ✓ |
| Ca-AA-AA-AA-AM | Binding energy | Gaussian 09 | O |
| Ca-AA-AA-AM-AM | Binding energy | Gaussian 09 | O |
| Ca-AA-AM-AM-AM | Binding energy | Gaussian 09 | O |
| Ca-PAM | Binding energy | Gaussian 09 | ✓ |
| Ca-PAM_hydrolyzed | Binding energy | Gaussian 09 | ✓ |
| Ca-PAM Silica-I | Binding energy | Gaussian 09 | ✓ |
| Ca-PAM Silica-II | Binding energy | Gaussian 09 | ✓ |
| Ca-PAM | QTAIM analysis | Multiwfn | ✓ |
| Ca-PAM_hydrolyzed | QTAIM analysis | Multiwfn | ✓ |
| Ca-PAM Silica-I | QTAIM analysis | Multiwfn | ✓ |
| Ca-PAM Silica-II | QTAIM analysis | Multiwfn | ✓ |
| Ca-PAM Silica-II | AIMD | VASP | ✓ |
Figure 9.
The (a) initial, (b) middle, and (c) final position of the molecular dynamics trajectory of PAM-Silica with Ca2+ ions and water molecules.
Figure 10.
The radial distribution function (RDF) of the MD trajectory of PAM-Silica with Ca2+ ions and water molecules.
Summarily, Table 2 shows a list of all model systems calculated to explain how the calculations begin from DFT optimization and progress to AIMD. DFT optimization was initially done for all the oligomers followed by binding energy calculations. The workflow confirms how computational chemistry techniques such as DFT and AIMD can be employed in studying and validating a system. In this case, different oligomers were investigated and only those with PAM had good binding affinities with Ca2+. QTAIM analysis confirmed the binding interactions using the BCPs. Ca-PAM silica-II which had the highest binding energy with Ca2+, was further analyzed using AIMD to confirm further the way by which Ca2+ binds to the silicon atom in PAM-Silica-II. The findings of this work are in agreement with the recent work Sun et al. [58] though in their case the binding of Ca2+ with PAM was done with anionic PAM. However, their studies confirm the strong interaction of Ca with Oxygen atoms as observed in this work.
4. Conclusions
The DFT studies indicate that Ca2+ does not bind readily to mixed oligomers of acryl acid and acrylamide; however, it has a good binding affinity with PAM and silica functionalized PAM, with the latter having a very high binding affinity. The highest binding affinity occurs in the silica region and not the –CONH functional groups. AIMD calculations corroborate the DFT studies since it was observed from the MD trajectory that Ca2+ binds to PAM-Silica by forming bonds with silicon. Ca2+ initially forms a bond with silicon in the presence of water molecules, but this does not last long; therefore, it subsequently bonds with the oxygen atoms present in the water molecule. PAM-Silica is a suitable calcium scale inhibitor since it has a high binding affinity with Ca2+; however, it will compete to capture the Ca2+ in the presence of water molecules. Theoretical studies (DFT and AIMD) have provided atomic insights on how PAM_Silica may be used as an efficient scale inhibitor; however, it may be further modified considering the competition from water molecules when used as a scale removal in an aqueous environment. Nevertheless, future studies may explore the use of the ReaxFF molecular dynamics technique which combines the accuracy of AIMD whilst enabling the analysis of larger number of atoms at longer time scales. Hence, building a more realistic model particularly with respect to the oligomer. However, the challenge is to ensure an existing Force Field that contains all the atoms to be studied exist in the near future this would be possible as ReaxFF continues to develop.
Acknowledgments
This work was supported by Qatar University National Capacity Building Program (NCBP), grant #QUCP-CENG-2021-03, and Qatar National Research Fund grant # NPRP12S-0130-190023. The Research Computing group at Texas A&M University in Qatar provided the HPC resources and services used in this work. Qatar Foundation funds research computing for Education, Science, and Community Development (http://www.qf.org.qa, accessed on 1 January 2020). Giuliano Carchini and Elkhansa Elbashier are appreciated for their fruitful discussion. Qatar University and the Gas Processing Center are acknowledged for their support. The outcomes achieved herein are exclusively the responsibility of the authors.
Supplementary Materials
The following supporting information can be downloaded at: https://www.mdpi.com/article/10.3390/polym14122333/s1, Table S1. The DFT calculated energy values and binding energies of the studied complexes.
Author Contributions
Conceptualization, I.A.H., A.A. and A.T.O.; methodology, A.T.O. and I.A.H.; software, A.T.O., I.A.H. and M.S.N.; validation, I.A.H. and A.A.; formal analysis, A.T.O., I.A.H. and M.S.N.; investigation, A.T.O., I.A.H., A.A. and A.T.O.; resources, I.A.H., M.A.S., A.A. and M.S.N.; data curation, A.T.O., I.A.H., M.A.S., A.A., M.S.N. and N.I. writing—original draft preparation, ATO.; writing—review and editing, A.T.O., I.A.H., M.A.S., A.A., M.S.N. and N.I. visualization, A.T.O. and N.I.; supervision, I.A.H., A.A., M.S.N. and M.A.S.; project administration, I.A.H., M.S.N. and A.A.; funding acquisition, I.A.H., A.A., M.A.S. and M.S.N. All authors have read and agreed to the published version of the manuscript.
Institutional Review Board Statement
Not applicable.
Informed Consent Statement
Not applicable.
Conflicts of Interest
The authors declare no conflict of interest.
Funding Statement
This research was funded by Qatar University National Capacity Building Program (NCBP), grant #QUCP-CENG-2021-03, and Qatar National Research Fund grant # NPRP12S-0130-190023.
Footnotes
Publisher’s Note: MDPI stays neutral with regard to jurisdictional claims in published maps and institutional affiliations.
References
- 1.Olajire A.A. A Review of Oilfield Scale Management Technology for Oil and Gas Production. J. Pet. Sci. Eng. 2015;135:723–737. doi: 10.1016/j.petrol.2015.09.011. [DOI] [Google Scholar]
- 2.Ramachandran S., Al-Muntasheri G., Leal J., Wang Q. Corrosion and Scale Formation in High Temperature Sour Gas Wells: Chemistry and Field Practice; Proceedings of the SPE International Symposium on Oilfield Chemistry; Woodlands, TX, USA. 13–15 April 2015. [Google Scholar]
- 3.Wang Q., Liang F., Al-Nasser W., Al-Dawood F., Al-Shafai T., Al-Badairy H., Shen S., Al-Ajwad H. Laboratory Study on Efficiency of Three Calcium Carbonate Scale Inhibitors in the Presence of EOR Chemicals. Petroleum. 2018;4:375–384. doi: 10.1016/j.petlm.2018.03.003. [DOI] [Google Scholar]
- 4.Fink J. Scale Inhibitors. Elsevier; Amsterdam, The Netherlands: 2021. [Google Scholar]
- 5.Crabtree M., Eslinger D., Fletcher P., Miller M., Johnson A., King G. Fighting Scale Removal and Prevention. Oilf. Rev. 1999;11:30–45. [Google Scholar]
- 6.Al Salami A.R., Monem A.A., Development Z., Zadco C. SPE 137906 Downhole and Topside Scale Challenge “Removal, Prevention and Inhibition Strategy”; Proceedings of the Abu Dhabi International Petroleum Exhibition and Conference; Abu Dhabi, UAE. 31 October–3 November 2010. [Google Scholar]
- 7.Brown M. Full Scale Attack. Review. 1998;30:30–32. [Google Scholar]
- 8.Todd A.C., Yuan M.D., McCracken I.R. Part 3: Sulphate and Carbonate Scale Prediction in North Sea Oil and Gas Fields. Geol. Soc. London, Mem. 1994;15:105–118. doi: 10.1144/GSL.MEM.1994.015.01.04. [DOI] [Google Scholar]
- 9.Onawole A.T., Hussein I.A., Saad M.A., Ahmed M.E.M., Nimir H. Computational Screening of Potential Inhibitors of Desulfobacter Postgatei for Pyrite Scale Prevention in Oil and Gas Wells. ACS Omega. 2021;6:10607–10617. doi: 10.1021/acsomega.0c06078. [DOI] [PMC free article] [PubMed] [Google Scholar]
- 10.Ahmed M., Hussein I.A., Onawole A.T., Saad M.A. Development of a New Borax-Based Formulation for the Removal of Pyrite Scales. ACS Omega. 2020;5:14308–14315. doi: 10.1021/acsomega.0c00556. [DOI] [PMC free article] [PubMed] [Google Scholar]
- 11.El-said M., Ramzi M., Abdel-moghny T. Analysis of Oil Fi Eld Waters by Ion Chromatography to Determine the Composition of Scale Deposition. DES. 2009;249:748–756. doi: 10.1016/j.desal.2008.12.061. [DOI] [Google Scholar]
- 12.Spinthaki A., Kamaratou M., Skordalou G., Petratos G., Petrou I., Tramaux A., David G., Demadis K.D. Searching for a Universal Scale Inhibitor: A Multi-Scale Approach towards Inhibitor Efficiency. Geothermics. 2021;89:101954. doi: 10.1016/j.geothermics.2020.101954. [DOI] [Google Scholar]
- 13.Xu Z., Zhao Y., He J., Qu H., Wang Y., Wang B. Fouling Characterization of Calcium Carbonate on Heat Transfer Surfaces with Sodium Carboxymethyl Cellulose as an Inhibitor. Int. J. Therm. Sci. 2021;162:106790. doi: 10.1016/j.ijthermalsci.2020.106790. [DOI] [Google Scholar]
- 14.Zhou M., Gu Y., Yi R., Han H. Synthesis and Property Study of Ter-Copolymer P(MA-AMPS-HPA) Scale Inhibitor. J. Polym. Res. 2020;27:1–12. doi: 10.1007/s10965-020-02270-7. [DOI] [Google Scholar]
- 15.Zuo Y., Yang W., Zhang K., Chen Y., Yin X., Liu Y. Experimental and Theoretical Studies of Carboxylic Polymers with Low Molecular Weight as Inhibitors for Calcium Carbonate Scale. Crystals. 2020;10:406. doi: 10.3390/cryst10050406. [DOI] [Google Scholar]
- 16.Duccini Y., Dufour A., Harm W.M., Sanders T.W., Weinstein B. High Performance Oilfield Scale Inhibitors. OnePetro; Richardson, TX, USA: 1997. [Google Scholar]
- 17.Chaussemier M., Pourmohtasham E., Gelus D., Pécoul N., Perrot H., Lédion J., Cheap-Charpentier H., Horner O. State of Art of Natural Inhibitors of Calcium Carbonate Scaling. A Review Article. Desalination. 2015;356:47–55. doi: 10.1016/j.desal.2014.10.014. [DOI] [Google Scholar]
- 18.Boumagoura M., Ghizellaoui S., Rhouati S., Cheap-Charpentier H., Horner O. Calcium Carbonate Scaling Prevention by a Green Chemical Inhibitor, Gallic Acid. Water Environ. J. 2021;35:998–1006. doi: 10.1111/wej.12690. [DOI] [Google Scholar]
- 19.Wong S.S., Teng T.T., Ahmad A.L., Zuhairi A., Najafpour G. Treatment of Pulp and Paper Mill Wastewater by Polyacrylamide (PAM) in Polymer Induced Flocculation. J. Hazard. Mater. 2006;135:378–388. doi: 10.1016/j.jhazmat.2005.11.076. [DOI] [PubMed] [Google Scholar]
- 20.Aguilar M.I., Sáez J., Lloréns M., Soler A., Ortuño J.F., Meseguer V., Fuentes A. Improvement of Coagulation–Flocculation Process Using Anionic Polyacrylamide as Coagulant Aid. Chemosphere. 2005;58:47–56. doi: 10.1016/j.chemosphere.2004.09.008. [DOI] [PubMed] [Google Scholar]
- 21.Shaikh S.M.R., Nasser M.S., Hussein I., Benamor A., Onaizi S.A., Qiblawey H. Influence of Polyelectrolytes and Other Polymer Complexes on the Flocculation and Rheological Behaviors of Clay Minerals: A Comprehensive Review. Sep. Purif. Technol. 2017;187:137–161. doi: 10.1016/j.seppur.2017.06.050. [DOI] [Google Scholar]
- 22.Makvandi P., Iftekhar S., Pizzetti F., Zarepour A., Zare E.N., Ashrafizadeh M., Agarwal T., Padil V.V.T., Mohammadinejad R., Sillanpaa M., et al. Functionalization of Polymers and Nanomaterials for Water Treatment, Food Packaging, Textile and Biomedical Applications: A Review. Environ. Chem. Lett. 2021;19:583–611. doi: 10.1007/s10311-020-01089-4. [DOI] [Google Scholar]
- 23.Ghorai S., Sinhamahpatra A., Sarkar A., Panda A.B., Pal S. Novel Biodegradable Nanocomposite Based on XG-g-PAM/SiO2: Application of an Efficient Adsorbent for Pb2+ Ions from Aqueous Solution. Bioresour. Technol. 2012;119:181–190. doi: 10.1016/j.biortech.2012.05.063. [DOI] [PubMed] [Google Scholar]
- 24.Saad A., Bakas I., Piquemal J.-Y., Nowak S., Abderrabba M., Chehimi M.M. Mesoporous Silica/Polyacrylamide Composite: Preparation by UV-Graft Photopolymerization, Characterization and Use as Hg (II) Adsorbent. Appl. Surf. Sci. 2016;367:181–189. doi: 10.1016/j.apsusc.2016.01.134. [DOI] [Google Scholar]
- 25.Al Hamad M., Al-sobhi S.A., Onawole A.T., Hussein I.A., Khraisheh M. Density-Functional Theory Investigation of Barite Scale Inhibition Using Phosphonate and Carboxyl-Based Inhibitors. ACS Omega. 2020;5:33323–33328. doi: 10.1021/acsomega.0c05125. [DOI] [PMC free article] [PubMed] [Google Scholar]
- 26.Hassan A., Mahmoud M., Bageri B.S., Aljawad M.S., Kamal M.S., Barri A.A., Hussein I.A. Applications of Chelating Agents in the Upstream Oil and Gas Industry: A Review. Energy Fuels. 2020;34:15593–15613. doi: 10.1021/acs.energyfuels.0c03279. [DOI] [Google Scholar]
- 27.Onawole A.T., Hussein I.A., Ahmed M.E.M., Saad M.A., Aparicio S. Ab Initio Molecular Dynamics of the Dissolution of Oilfield Pyrite Scale Using Borax. J. Mol. Liq. 2020;302:112500. doi: 10.1016/j.molliq.2020.112500. [DOI] [Google Scholar]
- 28.Onawole A.T., Hussein I.A., Carchini G., Sakhaee-Pour A., Berdiyorov G.R. Effect of Surface Morphology on Methane Interaction with Calcite: A DFT Study. RSC Adv. 2020;10:16669–16674. doi: 10.1039/D0RA02471F. [DOI] [PMC free article] [PubMed] [Google Scholar]
- 29.Ismail N., Alshami A.S., Hussein I.A. Synthesis and Evaluation of a Novel Polyacrylamide Functionalized Nano-Silica as a Calcium Carbonate Inhibitor in Upstream Applications. J. Pet. Sci. Eng. 2022;209:109864. doi: 10.1016/j.petrol.2021.109864. [DOI] [Google Scholar]
- 30.Frisch M.J., Trucks G.W., Schlegel H.B., Scuseria G.E., Robb M.A., Cheeseman J.R., Scalmani G., Barone V., Mennucci B., Petersson G.A., et al. Gaussian 09, Revision D.01. Gaussian, Inc.; Wallingford, CT, USA: 2013. [Google Scholar]
- 31.Obot I.B.B., Macdonald D.D.D., Gasem Z.M.M. Density Functional Theory (DFT) as a Powerful Tool for Designing New Organic Corrosion Inhibitors: Part 1: An Overview. Corros. Sci. 2015;99:1–30. doi: 10.1016/j.corsci.2015.01.037. [DOI] [Google Scholar]
- 32.Obot I.B., Haruna K., Saleh T.A. Atomistic Simulation: A Unique and Powerful Computational Tool for Corrosion Inhibition Research. Arab. J. Sci. Eng. 2018;44:1–32. doi: 10.1007/s13369-018-3605-4. [DOI] [Google Scholar]
- 33.Vilela Oliveira D., Laun J., Peintinger M.F., Bredow T. BSSE-correction Scheme for Consistent Gaussian Basis Sets of Double-and Triple-zeta Valence with Polarization Quality for Solid-state Calculations. J. Comput. Chem. 2019;40:2364–2376. doi: 10.1002/jcc.26013. [DOI] [PubMed] [Google Scholar]
- 34.Laun J., Bredow T. BSSE-corrected Consistent Gaussian Basis Sets of Triple-zeta Valence with Polarization Quality of the Sixth Period for Solid-state Calculations. J. Comput. Chem. 2021;42:1064–1072. doi: 10.1002/jcc.26521. [DOI] [PubMed] [Google Scholar]
- 35.Dennington J.R., Millam T.K., Dennington R., Keith T., Millam J. GaussView. Semichem Inc.; Shawnee, KS, USA: 2009. 131 TS. [Google Scholar]
- 36.Sulaiman K.O., Onawole A.T., Shuaib D.T., Saleh T.A. Quantum Chemical Approach for Chemiluminescence Characteristics of Di-Substituted Luminol Derivatives in Polar Solvents. J. Mol. Liq. 2019;279:146–153. doi: 10.1016/j.molliq.2019.01.110. [DOI] [Google Scholar]
- 37.Bader R.F.W. Atoms in Molecules. Acc. Chem. Res. 1985;18:9–15. doi: 10.1021/ar00109a003. [DOI] [Google Scholar]
- 38.Lu T., Chen F. Multiwfn: A Multifunctional Wavefunction Analyzer. J. Comput. Chem. 2012;33:580–592. doi: 10.1002/jcc.22885. [DOI] [PubMed] [Google Scholar]
- 39.Adonin S.A., Udalova L.I., Abramov P.A., Novikov A.S., Yushina I.V., Korolkov I.V., Semitut E.Y., Derzhavskaya T.A., Stevenson K.J., Troshin P.A., et al. A Novel Family of Polyiodo-Bromoantimonate(III) Complexes: Cation-Driven Self-Assembly of Photoconductive Metal-Polyhalide Frameworks. Chem. A Eur. J. 2018;24:14707–14711. doi: 10.1002/chem.201802100. [DOI] [PubMed] [Google Scholar]
- 40.Humphrey W., Dalke A., Schulten K. VMD: Visual Molecular Dynamics. J. Mol. Graph. 1996;14:33–38. doi: 10.1016/0263-7855(96)00018-5. [DOI] [PubMed] [Google Scholar]
- 41.Kresse G., Hafner J. Ab Initio Molecular Dynamics for Liquid Metals. Phys. Rev. B. 1993;47:558–561. doi: 10.1103/PhysRevB.47.558. [DOI] [PubMed] [Google Scholar]
- 42.Kresse G., Furthmüller J. Efficiency of Ab-Initio Total Energy Calculations for Metals and Semiconductors Using a Plane-Wave Basis Set. Comput. Mater. Sci. 1996;6:15–50. doi: 10.1016/0927-0256(96)00008-0. [DOI] [PubMed] [Google Scholar]
- 43.Kresse G., Furthmüller J. Efficient Iterative Schemes for Ab Initio Total-Energy Calculations Using a Plane-Wave Basis Set. Phys. Rev. B Condens. Matter Mater. Phys. 1996;54:11169–11186. doi: 10.1103/PhysRevB.54.11169. [DOI] [PubMed] [Google Scholar]
- 44.Kresse G., Joubert D. From Ultrasoft Pseudopotentials to the Projector Augmented-Wave Method. Phys. Rev. B. 1999;59:1758–1775. doi: 10.1103/PhysRevB.59.1758. [DOI] [Google Scholar]
- 45.Grimme S., Antony J., Ehrlich S., Krieg H. A Consistent and Accurate Ab Initio Parametrization of Density Functional Dispersion Correction (DFT-D) for the 94 Elements H-Pu. J. Chem. Phys. 2010;132:154104. doi: 10.1063/1.3382344. [DOI] [PubMed] [Google Scholar]
- 46.Davis J.B.A., Baletto F., Johnston R.L. The Effect of Dispersion Correction on the Adsorption of CO on Metallic Nanoparticles. J. Phys. Chem. A. 2015;119:9703–9709. doi: 10.1021/acs.jpca.5b05710. [DOI] [PubMed] [Google Scholar]
- 47.Orasugh J.T., Ray S.S. Prospect of DFT Utilization in Polymer-Graphene Composites for Electromagnetic Interference Shielding Application: A Review. Polymers. 2022;14:704. doi: 10.3390/polym14040704. [DOI] [PMC free article] [PubMed] [Google Scholar]
- 48.Mathew K., Sundararaman R., Letchworth-Weaver K., Arias T.A., Hennig R.G. Implicit Solvation Model for Density-Functional Study of Nanocrystal Surfaces and Reaction Pathways. J. Chem. Phys. 2014;140:084106. doi: 10.1063/1.4865107. [DOI] [PubMed] [Google Scholar]
- 49.Can I., Dario O., Frédéric V. Assessing the Performances of Different Continuum Solvation Models for the Calculation of Hydration Energies of Molecules, Polymers and Surfaces: A Comparison between the SMD, VASPsol and FDPB Models. Theor. Chem. Acc. 2021;140:99. doi: 10.1007/s00214-021-02799-w. [DOI] [Google Scholar]
- 50.Ebadi M., Marchiori C., Mindemark J., Brandell D., Araujo C.M. Assessing Structure and Stability of Polymer/Lithium-Metal Interfaces from First-Principles Calculations. J. Mater. Chem. A. 2019;7:8394–8404. doi: 10.1039/C8TA12147H. [DOI] [Google Scholar]
- 51.Einstein A., Podolsky B., Rosen N. Can Quantum-Mechanical Description of Physical Reality Be Considered Complete? Phys. Rev. 1935;47:777. doi: 10.1103/PhysRev.47.777. [DOI] [Google Scholar]
- 52.Smidstrup S., Markussen T., Vancraeyveld P., Wellendorff J., Schneider J., Gunst T., Verstichel B., Stradi D., Khomyakov P.A., Vej-Hansen U.G., et al. QuantumATK: An Integrated Platform of Electronic and Atomic-Scale Modelling Tools. J. Phys. Condens. Matter. 2020;32:015901. doi: 10.1088/1361-648X/ab4007. [DOI] [PubMed] [Google Scholar]
- 53.Li S., Chen F., Lin F., Kong Y., Dai H. Adsorption Performance of SiO2/CPAM Composites for Aqueous Ca(II) BioResources. 2018;13:3554–3570. doi: 10.15376/biores.13.2.3554-3570. [DOI] [Google Scholar]
- 54.Kolari K., Sahamies J., Kalenius E., Novikov A.S., Kukushkin V.Y., Haukka M. Metallophilic Interactions in Polymeric Group 11 Thiols. Solid State Sci. 2016;60:92–98. doi: 10.1016/j.solidstatesciences.2016.08.005. [DOI] [Google Scholar]
- 55.Eliseeva A.A., Ivanov D.M., Novikov A.S., Kukushkin V.Y. Recognition of the π-Hole Donor Ability of Iodopentafluorobenzene-a Conventional σ-Hole Donor for Crystal Engineering Involving Halogen Bonding. CrystEngComm. 2019;21:616–628. doi: 10.1039/C8CE01851K. [DOI] [Google Scholar]
- 56.Espinosa E., Molins E., Lecomte C. Hydrogen Bond Strengths Revealed by Topological Analyses of Experimentally Observed Electron Densities. Chem. Phys. Lett. 1998;285:170–173. doi: 10.1016/S0009-2614(98)00036-0. [DOI] [Google Scholar]
- 57.Vener M.V., Egorova A.N., Churakov A.V., Tsirelson V.G. Intermolecular Hydrogen Bond Energies in Crystals Evaluated Using Electron Density Properties: DFT Computations with Periodic Boundary Conditions. J. Comput. Chem. 2012;33:2303–2309. doi: 10.1002/jcc.23062. [DOI] [PubMed] [Google Scholar]
- 58.Sun W., Zeng H., Tang T. Enhanced Adsorption of Anionic Polymer on Montmorillonite by Divalent Cations and the Effect of Salinity. J. Phys. Chem. A. 2021;125:1025–1035. doi: 10.1021/acs.jpca.0c08797. [DOI] [PubMed] [Google Scholar]
Associated Data
This section collects any data citations, data availability statements, or supplementary materials included in this article.


