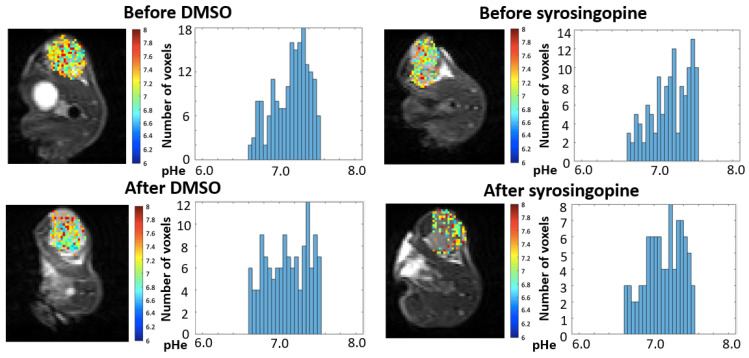
Figure 5.
Impact of syrosingopine on tumor pHe. The evolution of pHe was evaluated using CEST-MRI in MDA-MB-231 tumor xenografts. Typical images and histograms of distribution of pHe values recorded before and after vehicle administration (left), and before and after syrosingopine administration (right) (daily IP injection over 4 days, 5 mg/kg). Images were acquired from the same mice.

