
Figure 3.
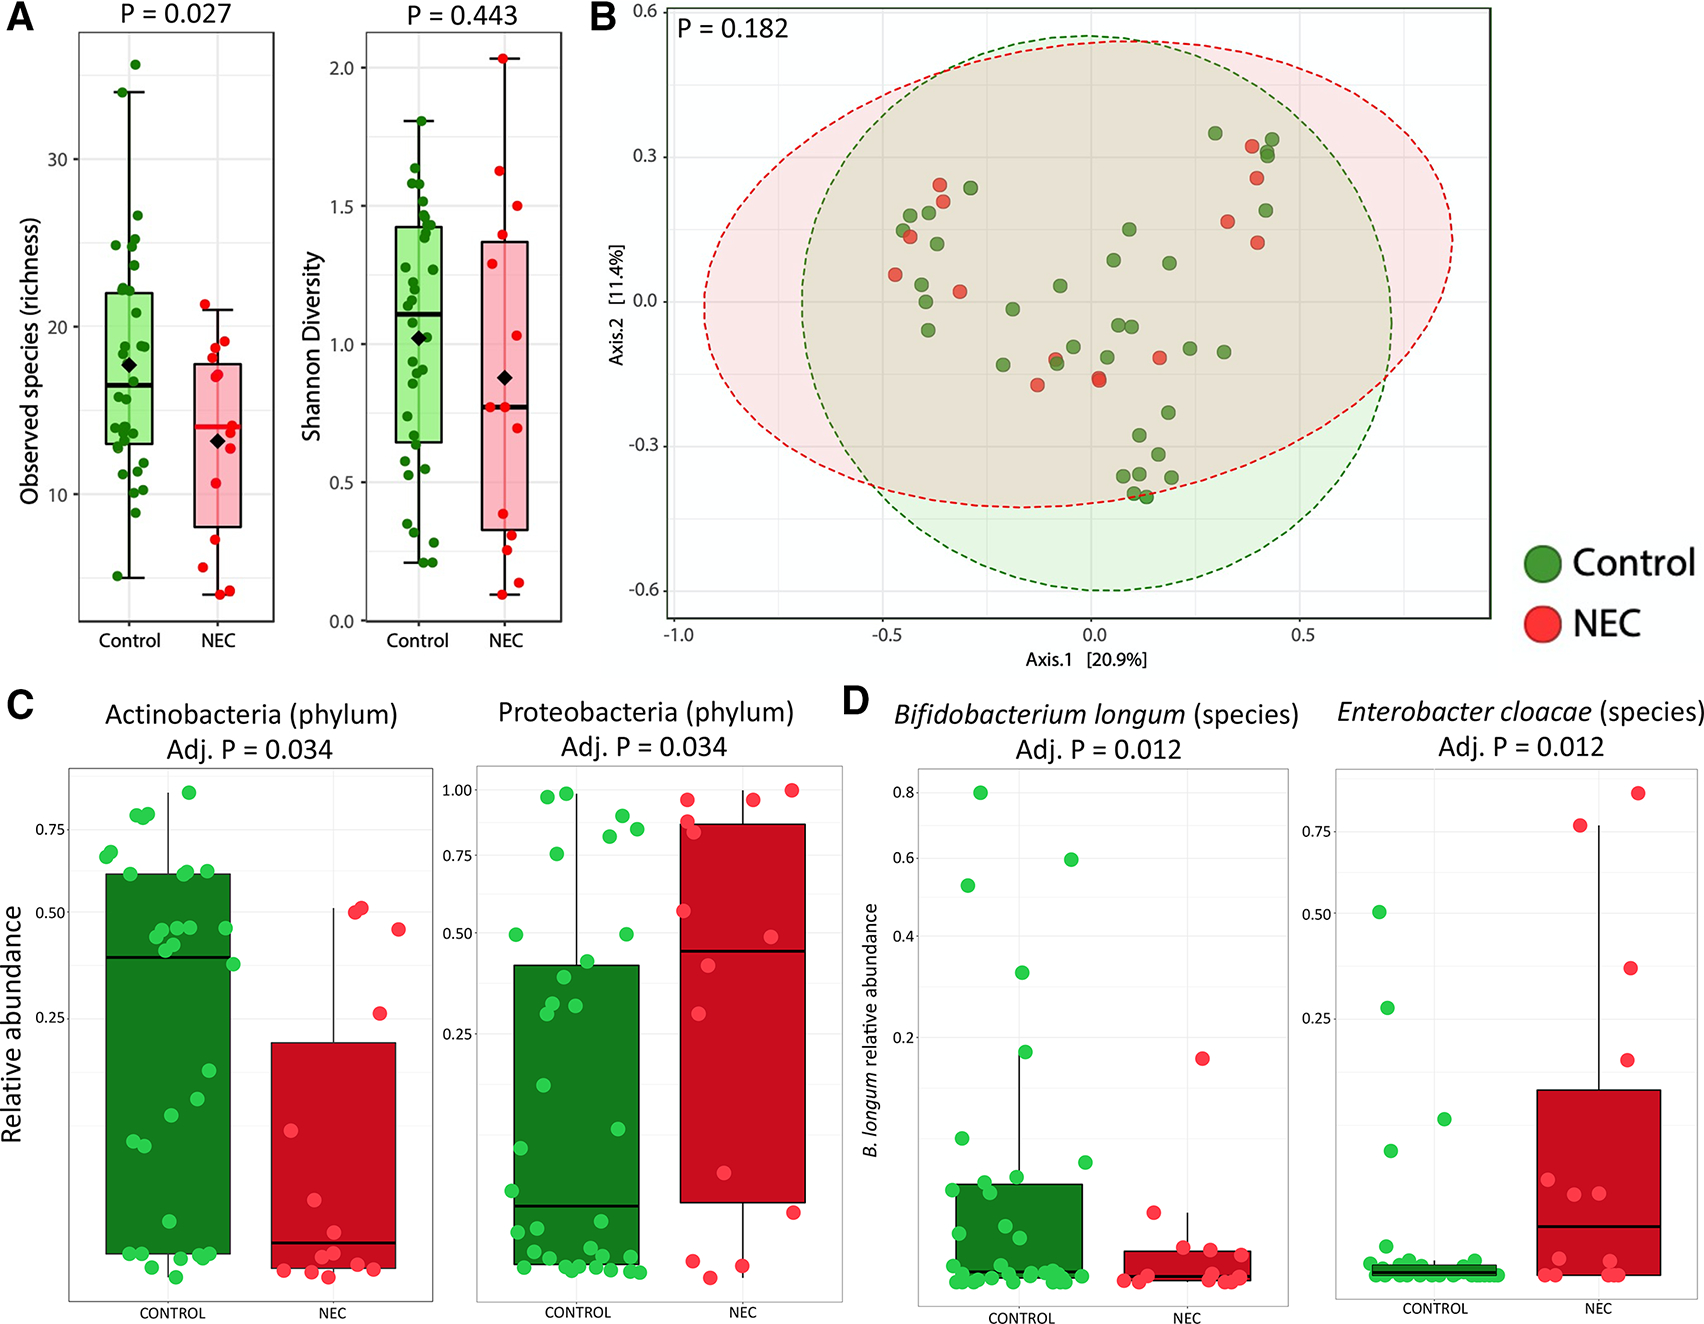
Cross-sectional analysis of preterm stool metagenome profiles between NEC and matched controls. Analysis includes the sample closest NEC onset (median of 3 days prior to NEC) and a corresponding control sample matched by day of life. (A) Alpha diversity based on observed species (richness) and Shannon diversity. (B) Bray-Curtis principal coordinate analysis. (C) Box plots showing the relative abundance of significant phyla. (D) Box plots showing the relative abundance of significant species. NEC, necrotising enterocolitis.