
Figure 2.
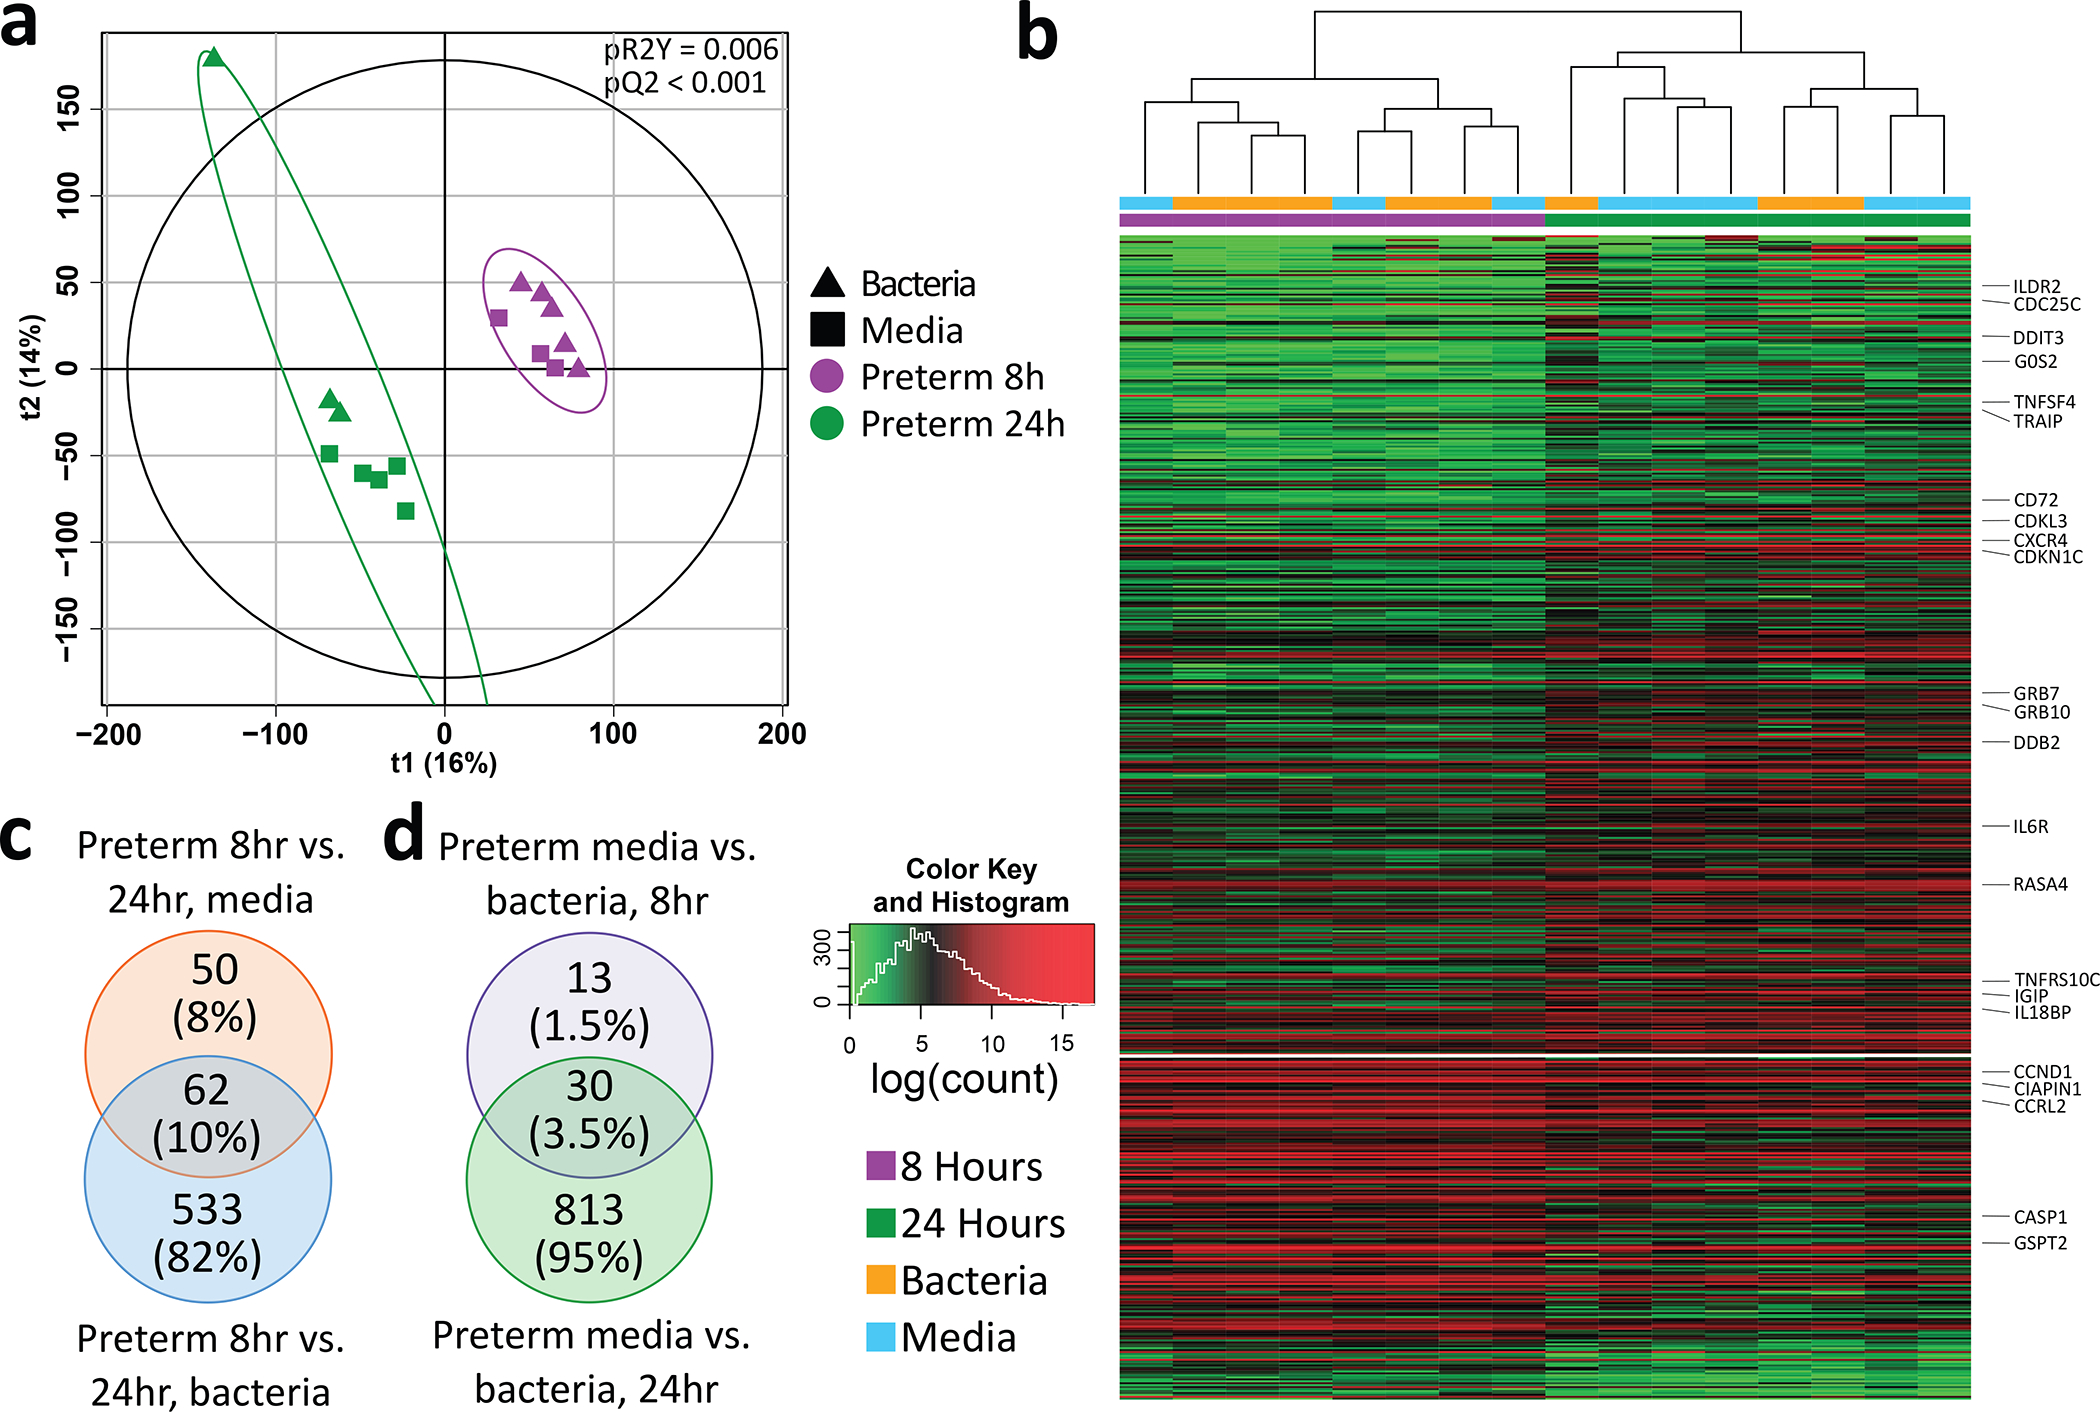
Comparison of preterm lines cultured for 8 hours and 24 hours. Bacterial treatment was with Enterococcus faecalis. (A) partial least squares discriminant analysis of preterm monolayers cultured for 8 and 24. Plot coloured by time point and shaped by exposure (media only or bacteria). P values were calculated based on 2000 permutations. (B) Heatmap of genes differentially expressed between preterm organoids cultured for 8 and 24 hours (all adj. p<0.05). log transformed normalised counts were used. (C) Venn diagram of significantly differentially expressed genes associated to comparison of preterm organoids cultured for 8 and 24 hours separating by exposure condition (all adj. p<0.05). (D) Venn diagram of significantly differentially expressed genes between preterm organoids exposed to media and bacteria by time point (8 and 24 hours) (all adj. p<0.05).