

Abstract
Background
COVID-19 was first reported in 2019, and the Chinese government immediately carried out stringent and effective control measures in response to the epidemic.
Objective
Nonpharmaceutical interventions (NPIs) may have impacted incidences of other infectious diseases as well. Potential explanations underlying this reduction, however, are not clear. Hence, in this study, we aim to study the influence of the COVID-19 prevention policies on other infectious diseases (mainly class B infectious diseases) in China.
Methods
Time series data sets between 2017 and 2021 for 23 notifiable infectious diseases were extracted from public data sets from the National Health Commission of the People’s Republic of China. Several indices (peak and trough amplitudes, infection selectivity, preferred time to outbreak, oscillatory strength) of each infectious disease were calculated before and after the COVID-19 outbreak.
Results
We found that the prevention and control policies for COVID-19 had a strong, significant reduction effect on outbreaks of other infectious diseases. A clear event-related trough (ERT) was observed after the outbreak of COVID-19 under the strict control policies, and its decreasing amplitude is related to the infection selectivity and preferred outbreak time of the disease before COVID-19. We also calculated the oscillatory strength before and after the COVID-19 outbreak and found that it was significantly stronger before the COVID-19 outbreak and does not correlate with the trough amplitude.
Conclusions
Our results directly demonstrate that prevention policies for COVID-19 have immediate additional benefits for controlling most class B infectious diseases, and several factors (infection selectivity, preferred outbreak time) may have contributed to the reduction in outbreaks. This study may guide the implementation of nonpharmaceutical interventions to control a wider range of infectious diseases.
Keywords: class B infectious disease, COVID-19, event-related trough, infection selectivity, oscillation, public health interventions, pandemic, surveillance, health policy, epidemiology, prevention policy, public health, risk prevention
Introduction
Atypical pneumonia caused by a new coronavirus was first reported in December 2019 [1-4] and was subsequently termed “COVID-19” by the World Health Organization (WHO) on February 12, 2020. Later, human-to-human transmission of COVID-19 was confirmed, resulting in a pandemic outbreak worldwide [5-13]. After the outbreak, the Chinese government took immediate action to implement strict public health policies [14], such as lockdown, quarantine measures, and social distancing. Domestic and international travel was restricted, mass gatherings were reduced, and public entertainment venues and schools were closed. The government also asked people to be more vigilant and take personal precautions, such as sanitizing hands and wearing surgical masks. Under these policies, the number of COVID-19 infections in China sharply decreased, and this situation has lasted until recently [15-17]. In addition to the COVID-19 outbreak, other fatal infectious diseases have also had outbreaks [18], which may have been overlooked. In China, the national infectious disease surveillance system has been recording outbreaks of other diseases [19]. Infectious diseases are divided into notifiable classes A, B, and C. In this classification, class B notifiable diseases have the potential to cause severe epidemic outbreaks, such as hepatitis B virus (HBV) [20], scarlet fever [21], measles [22], and rabies [23-25]. Notably, COVID-19 is classified as a class B disease.
During the COVID-19 pandemic, local and international governments relied on nonpharmaceutical measures until vaccines were available. Unlike vaccines or medicine, which are restricted by supply and logistics [26], nonpharmaceutical interventions (NPIs) could have a broader impact on multiple infectious diseases. Take the influenza virus as an example. Human beings have little immunity to it, which allows it to spread rapidly from one person to another. In the absence of effective vaccines to immunize people, NPIs are one of the best strategies to control pandemics. Several studies have found that policies to prevent COVID-19 and other NPIs could reduce the number of infections of influenza [17,27-29], tuberculosis [30,31], and some other diseases [32,33] to a large degree, while the characteristics of an epidemic are not only limited to the static number of the infected cases but also limited to the temporal dynamics of the epidemic. The temporal features of an infectious epidemic after NPIs is not precisely defined, although common sense suggests that the number of cases may decrease. The question whether under a consistent and rigorous prevention policy, this decrease would rebound or only fall to 0 arises. New analysis indicators are required to define it clearly. There are some characteristics of temporal dynamics, such as the tuning curve of the infectious disease in a year [34-37] and the spectrogram of the epidemic [38-42] analyzed by the Fourier method. The tuning curve of monthly infected cases illustrates the essential profile of each disease outbreak and gives a direct picture of the monthly situation, but it lacks quantitative features (eg, infection selectivity and preferred outbreak time) that were highly summarized from the tuning curve and lack of further analysis. Although these temporal indices have been mentioned in previous studies, it remains unclear how they changed with strict NPIs during the COVID-19 outbreak and to what extent they contributed to the reduction in infectious cases under the NPIs.
In the light of this, in this study, we investigated the impact of NPIs on other class B infectious diseases. We extracted the time series data for 23 class B notifiable infectious diseases between 2017 to 2021 from public data sets of the National Health Commission of the People’s Republic of China [43]. During the COVID-19 pandemic, the strict NPIs in China have always been existing, which can be described by the stringency index taken from the Oxford COVID-19 Government Response Tracker [44]. We expected to find a significant trough of most class B infectious diseases after the outbreak and subsequent interventions for COVID-19, which we defined as the event-related trough (ERT). The ERT can be used to investigate the fluctuations in several infections that are time-locked to an event without intervention. We then explored how infection selectivity and the preferred month of the outbreak of the infectious diseases may affect the ERT. Finally, we calculated the oscillatory strength of each infectious disease and compared the power before and after the COVID-19 outbreak.
Methods
Data and Sources
Time series data available for the monthly reported and confirmed cases of 23 class B notifiable infectious diseases in China’s mainland, from April 2017 to September 2021, were obtained from the National Health Commission of the People’s Republic of China. The data set is open to the public around the world and is reported by the Chinese Centre for Disease Control and Prevention (CDC) each month. These 23 diseases are HIV/AIDS, hepatitis (including hepatitis A virus, HAV; HBV; hepatitis C virus, HCV; and hepatitis E virus, HEV), measles, hemorrhagic fever, dengue and severe dengue, rabies, Japanese encephalitis, anthrax, Shigella spp. or Entamoeba histolytica, tuberculosis, typhoid and paratyphoid fever, pertussis, neonatal tetanus, scarlet fever, brucellosis, gonorrhea, Treponema pallidum, leptospirosis, schistosomiasis, and malaria. The data sampling rate was 1 time point per month (12 time points per year) from the monthly report of the National Health Commission of the People’s Republic of China. We used 2 criteria to select these diseases. First, the maximum number of infectious cases each month in recent years should be larger than 10. Second, the time points should be continuously publicly reported within the years of interest. We were mainly interested in how other class B infectious diseases might be influenced by policies related to COVID-19, considering that COVID-19 is also classified as class B. We did not include class A diseases due to their low incidences. Class C diseases, such as the flu, were not included, because they are less fatal and controllable and would not have the same impact as class B diseases.
Indicators of government response in China were taken from the Oxford COVID-19 Government Response Tracker [44]. In this work, we use the stringency index (all closure indicators, such as lockdown policies and travel bans, and health system policies that record public information campaigns and contact tracing), which records the strictness of lockdown-style policies. The index scores the level of government responses between 0 and 100. The higher the score is, the stricter the government interventions were (Multimedia Appendix 1).
Ethical Considerations
For this study, we used public data from the National Health Commission of the People’s Republic of China. Our study did not involve any intervention on human participants. This study was approved by the Ethics Committee of Beijing Anding Hospital, Capital Medical University, China.
Trough and Peak Amplitude Before and After the COVID-19 Outbreak
We defined a new concept named the ERT, which originates from the event-related potential (ERP) in neuroscience [45]. The ERT describes the direct impact of specific events on reducing the number of infectious diseases. This event could be a pharmaceutical or nonpharmaceutical intervention to prevent the spread of infectious disease. In this study, the specific event is the strong prevention and control policies implemented at the outbreak of the COVID-19 epidemic, which are an NPI. The ERT is the lowest increase of an outbreak in the period of 6 months after the outbreak of COVID-19. The trough amplitude before COVID-19 is the lowest value of the infection in the 3-year period before COVID-19 (Equation 1). The peak amplitude (Equation 2) before and after the COVID-19 outbreak is the highest value of the infection before and after COVID-19. We also calculated the trough ratio index as the ratio of troughs before and after the outbreak of COVID-19 (Equation 3).
| Trough amplitude = arg min(infected cases after outbreak of the epidemic) (1) |
| Peak amplitude = arg max(infected cases after outbreak of the epidemic) (2) |
| Trough ratio index = arg min(infected cases before outbreak of the epidemic)/arg min(infected cases after outbreak of the epidemic) (3) |
Tuning Curves for Monthly Infected Cases Before and After the COVID-19 Outbreak
The tuning curve of the monthly infected cases illustrates the essential profile of the outbreak of each disease in China, which gives a direct picture of the situation each month based on the historical data. We assumed that all infectious diseases included in this study have a similar trend each year for the years of observation (Multimedia Appendix 2), similar to previous studies [18]. Thus, we took the monthly average number of infected cases and computed them into a tuning curve (Equation 4). Each infectious disease in this study has a tuning curve before and after the COVID-19 outbreak, and the oscillatory pattern within a year is clear.
| Tuning curvemonth = sum(infected casesmonth)/N, (4) |
where N is the number of years.
Preferred Month and Selectivity of the Epidemic Outbreak Before and After COVID-19
Two indices of the disease were defined: preferred month and infection selectivity (Equation 5), which are important indicators of the infectious property of the epidemics caused by a disease in a year. The preferred month index is defined as the month in a year that has the most cases of infections. The infection selectivity index is defined as (1 – ratio of the minimum and the maximum number of infected cases in a year). If the selectivity index is closer to 1, it means outbreaks only occur in specific months. If the selectivity index is closer to 0, it means that outbreaks occur throughout the year.
| Selectivity index = 1 – [min(mean infected cases in a year)/max(mean infected cases in a year)] (5) |
Power Spectrum Analysis
The oscillatory property of an infectious disease is an important indicator of the regular fluctuations and recurrence of epidemics. To better quantify these fluctuations, we used spectrum analysis. Similar methods have been used in classic and modern studies in the field of infectious diseases [38-42] and some other biological research [46,47]. Spectrum analysis is a technique for decomposing complex signals into simpler signals based on Fourier transform (Equation 6). Many biological signals can be expressed as the sum of various simple signals of different frequencies and produce information about a signal at different frequencies (eg, amplitude, power, intensity, phase).
 |
The power spectral density (PSD; Equation 7) for each infectious disease before and after the outbreak of COVID-19 was computed using the multitaper method with the Chronux toolbox [48], an open source, data analysis toolbox [49]. Power spectra of the time series data (infected cases of each disease) were calculated in 2 time periods (2017-2020 and 2020-2021).
 |
where WT(t) is 1 within the arbitrary period and 0 elsewhere, and T is centered about some arbitrary time t=t0.
Correlation Analysis
We performed Pearson correlation to measure the relationship of several indices (ERT, selectivity, oscillatory strength, and mean infected number) before and after the COVID-19 outbreak. Pearson correlation was also performed in the correlation analysis between trough ratio and selectivity, between the change in power and change in infected numbers, and between the change in power and change in trough amplitude. Spearman correlation was performed to measure the relationship between the trough amplitude and the peak amplitude before and after the COVID-19 outbreak. The significance (P value) of the correlation was corrected with Bonferroni correction.
Statistical Analysis
We performed an independent-sample t test to compare the difference between several indices (trough amplitude, peak amplitude) before and after the COVID-19 outbreak and test the difference in the trough ratio between diseases with a different preferred time of outbreak. The pairwise t test was performed to compare the oscillatory power and the average infected number before and after the COVID-19 outbreak.
Results
Monthly Data
This study analyzed monthly data from April 2017 to September 2021 of confirmed cases of 23 class B notifiable infectious diseases in China’s mainland. After the COVID-19 outbreak, most class B infectious diseases had an obvious sudden trough, which we defined as the ERT (see Figure 1A for 3 typical examples). The stringency index of China showed that during the COVID-19 pandemic, the strict NPIs in China have always been existing (Multimedia Appendix 1), which allows us to analyze the long-term effect after the COVID-19 outbreak.
Figure 1.
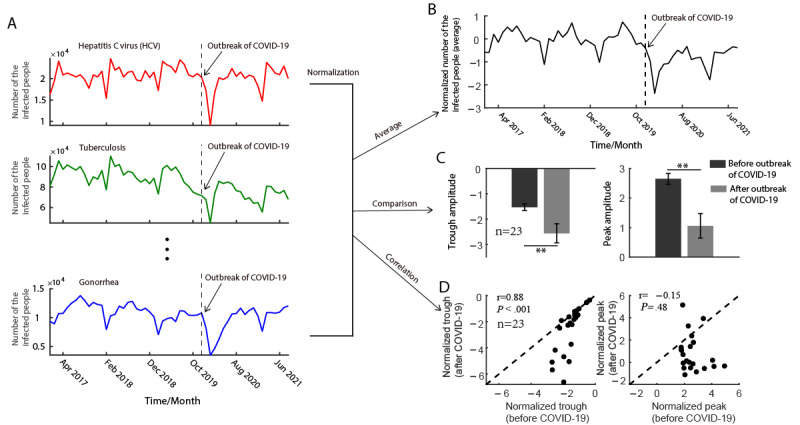
Infectious disease before and after the COVID-19 outbreak (A) Monthly infected cases from 2017 to 2021 of three examples (HCV, Tuberculosis, and Gonorrhea). The curve after the vertical dotted line shows specifically the infected cases after the COVID-19 outbreak. (B) The normalized mean number of infected cases before and after the COVID-19 outbreak. (C) Trough amplitude (left) and peak amplitude (right) before and after the COVID-19 outbreak (** is for P<.01). (D) The relationship between the normalized trough (left) and peak (right) before and after the COVID-19 outbreak.
Significant Event-Related Trough Occurred After the Strict Control Policy for the COVID-19 Outbreak in China
We showed several examples of diseases that had an obvious ERT after the COVID-19 outbreak (HCV, tuberculosis, and gonorrhea); see Figure 1A, and see Multimedia Appendix 3 for all diseases. To compare the time series of all diseases on a notionally common scale, we normalized the time series of the number of infected people by subtracting the mean number of infections before COVID-19 and dividing it by its SD. Hence, the mean number of infections before COVID-19 was 0 for all the diseases (Figure 1B). The pattern shows an obvious and sudden decrease in confirmed cases after the COVID-19 outbreak (see Figure 1B). To investigate whether the peak and trough amplitudes may change due to the outbreak, we compared the differences between peak and trough amplitudes before and after the event (policy in response to COVID-19). Results showed that the amplitude of both peak (P<.01) and trough (P<.01) significantly decreased, which indicated that the outbreak strongly moderated the oscillation amplitude (see Figure 1C). We then calculated the correlation between the normalized trough before and after the outbreak event, and we found that the trough after the outbreak was significantly correlated (r=0.88, P<.001) to the trough before but the peak was not correlated (r=–0.15, P=.48; see Figure 1D).
Infection Selectivity and Preferred Outbreak Time Strongly Related to the Trough Ratio Before and After the COVID-19 Outbreak
The ERT might be affected by the basic properties (infection selectivity and preferred outbreak time) of infectious disease outbreaks. To further clarify potential factors that would cause an ERT, we determined the property of oscillations for infectious diseases in a year by defining 2 indicators: infection selectivity and preferred outbreak time of the infectious disease. We selected 3 infectious diseases that have different selectivity as examples (Figure 2A,B; see Multimedia Appendix 4 for all diseases). The infection selectivity index is defined as (1 – ratio of the minimum and the maximum number of infected cases in a year). If the selectivity index is closer to 1, then the shape of the tuning curve is sharper (eg, Japanese encephalitis), and vice versa (eg, HEV). The preferred month index is defined as the month in a year that has the most cases of infections. Results showed that there was a significant increase in infection selectivity after the outbreak of COVID-19, and infection selectivity before and after the outbreak was positively correlated (with Bonferroni correction; Figure 2C). When we compared the selectivity before the outbreak and the trough ratio, we found that the stronger the infection selectivity, the smaller the trough ratio (Figure 2D). We also conducted a partial correlation analysis between infection selectivity and trough ratio, controlling for the preferred time of outbreak, which was significant (r=–0.58, P=.004). The association between infection selectivity and trough ratio confounded by seasons was, however, weak.
Figure 2.
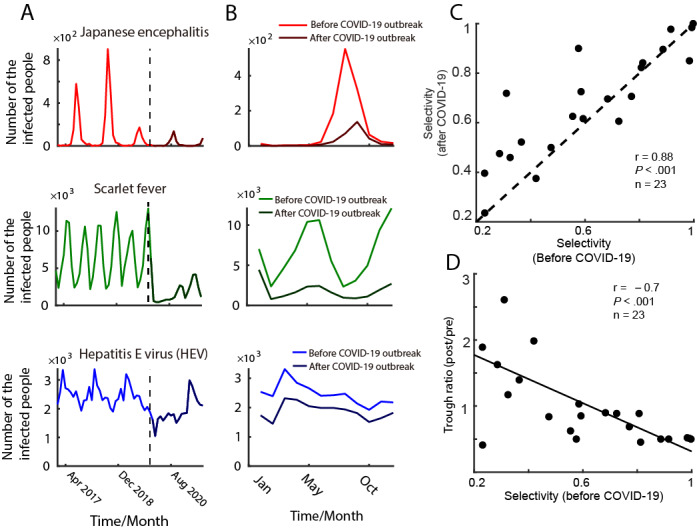
Relationship between selectivity and trough ratio before and after the COVID-19 outbreak (A) Monthly infected cases from 2017 to 2021 of three examples (Japanese encephalitis, Scarlet fever, and HEV). The curve after the vertical dotted line shows specifically the infected cases after the COVID-19 outbreak. (B) The number of infected cases every month in a year calculated before (light-colored curve) and after the COVID-19 outbreak (dark-colored curve) corresponding to the time-series data of plot A. (C) The scatter plot of the selectivity before and after the COVID-19 outbreak. (D) The relationship between the selectivity (before) and trough ratio (post/pre).
Relationship Between an Infection and Its Oscillatory Power Before and After the COVID-19 Outbreak
We quantified the oscillatory strength of outbreaks using power spectrum analysis (Figures 3A and 3B; see Multimedia Appendix 5 for all diseases). We then explored the relationship between infected cases and their corresponding strength of oscillatory power before and after the COVID-19 outbreak. Results indicated that the oscillatory strength (r=0.83, P<.001) and mean infected cases (r=0.95, P<.001) before the COVID-19 outbreak were significantly positively correlated to the indices after the COVID-19 outbreak (Figure 3C), showing that the stronger the oscillatory power was before the outbreak, the stronger it was after the outbreak. The same was true for mean infected cases.
Figure 3.
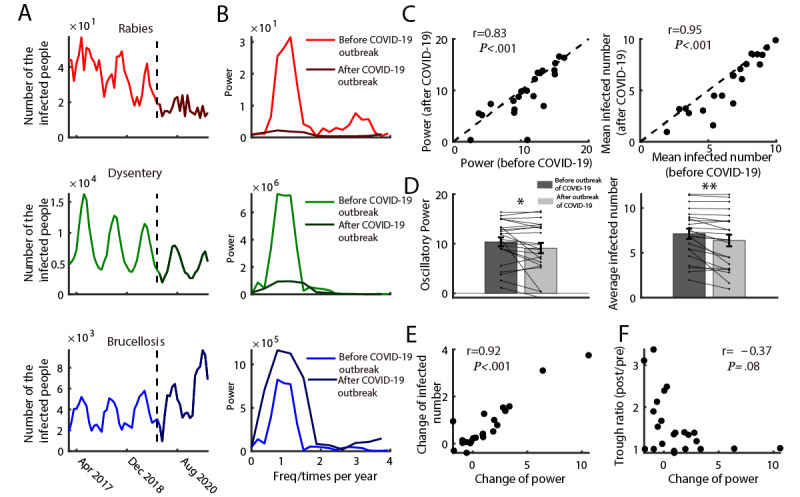
Relationship between the infection and its oscillatory power before and after COVID outbreak (A) Infected cases from 2017 to 2021 of three examples (Rabies, Dysentery, and Brucellosis). The curve after the vertical dotted line represents specifically the infected cases after the COVID-19 outbreak. (B) The power spectrum calculated before (light-colored curve) and after the COVID-19 outbreak (dark-colored curve) corresponding to the time-series data of plot A. (C) The scatter plot of the power (left) and mean infected number (right) before and after the COVID-19 outbreak. (D) The histogram of the oscillatory power (left) and averaged infected cases (right) before and after the COVID-19 outbreak. (E) The scatter plot of the change of power and change of infected number. (F) The scatter plot of the change of power and change of trough amplitude.
To determine the differences between oscillatory power before and after the COVID-19 outbreak and between mean infected cases before and after the COVID-19 outbreak, we also split the data and compared the indices before and after the event. Consistent with our hypothesis, results showed both decreases in oscillatory power and mean infected cases after the COVID-19 outbreak (Figure 3D). We further examined the relationship between the change in power between the change in infected numbers and trough amplitude. Results showed that the change in power and the change in infected numbers was significantly correlated (r=0.92, P<.001). The more the change in oscillatory power, the more changes in the number of confirmed cases (Figure 3E). However, the change in power was not related to the change in trough amplitude (r=–0.37, P=.08 with Bonferroni correction; Figure 3F). In sum, the COVID-19 outbreak reduced the outbreaks of class B notifiable infectious diseases, as indicated by oscillatory power and mean infected cases.
Discussion
Principal Findings
In this study, we defined several novel concepts and robust metrics (ERT, selectivity of infection, preferred time to outbreak, oscillatory strength of the infectious disease) to quantify and capture the temporal characteristics of infectious disease outbreaks and event-related fluctuations in China. Our results showed that a clear ERT occurred for most class B infectious diseases after the COVID-19 outbreak under the strict public health policy. We further found that the ERT was related to the nature of diseases, such as their infection selectivity and preferred outbreak time. However, their oscillatory strength was somehow unrelated. We also compared these indices of the infectious diseases before and after the outbreak of COVID-19. The impact of the COVID-19 outbreak influenced the infectious diseases by reducing the trough amplitude, mean infected cases, and oscillatory strength but increasing infectious selectivity (see Figure 4).
Figure 4.
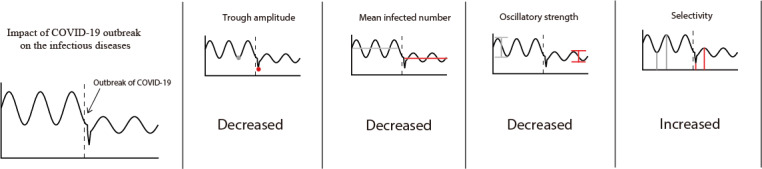
A summary of the main finding. As illustrated in the four plots, the impact of the COVID-outbreak influenced the infectious diseases in four aspects: decreased the trough amplitude, the mean infected cases, and the oscillatory strength, but increased the seasonal selectivity.
Comparison With Prior Work
To the best of our knowledge, this is the first study to systematically investigate the influence of the COVID-19 outbreak on the temporal characteristics of other class B infectious diseases in China, including both respiratory infectious diseases and other types, such as those transmitted through sex, body fluids, the digestive tract, contact, and mosquitos. The key contribution of this study is that several new concepts were purported, such as the ERT, selectivity of infectious diseases, the preferred outbreak time, and the power strength of infectious oscillation. Some previous studies have investigated basic properties of a few infectious diseases in China [18,22-25,50-52] and countries worldwide [39,40,53-55], and NPIs to mitigate COVID-19 could have affected the transmission dynamics of influenza and other respiratory diseases [17,27-29,56,57]. However, previous research did not quantify the reduction using a specific temporal index. We first defined the ERT in the field of infectious diseases to capture the immediate influence of the strong interventions related to the public health events, such as the prevention policy on disease outbreaks. The ERT could measure the temporal feature when studying the effect of some specific interventions in the future, which increases 1 dimension (temporal dynamics) compared with a simple reduction number.
Another novel finding of this study is that we also built up a connection between the ERT and some other important indicators (selective property and oscillatory property), which were neglected in prior works. In this study, we found that the ERT is related to the selectivity (Figure 2D) of an infectious disease, which gives a new understanding of how an epidemic could be more easily controlled (when a disease has high selectivity). In the future, infectious selectivity would play a more important role than before, especially when combined with the tuning curve of a disease. It would depict new pictures of the basic property of each disease and give more practical guidance on the prevention and control of epidemics. The oscillatory properties of infectious diseases were also analyzed in some previous studies [18,22-25,38-40,53-55,58-60], which could be driven by both natural [11,61,62] and human [63-68] factors. However, prior studies did not investigate the influence of COVID-19 measures or other NPIs to control epidemics on the oscillatory strength of infectious diseases systematically. Our results indicate that the oscillatory strength significantly decreased after the COVID-19 outbreak, which was accompanied by a decrease in the mean infections. This finding supports the conceptual hybrid model [18]. We also found that the oscillatory strength before the COVID-19 outbreak did not correlate to the change in trough, which further suggests that the ERT is not related to some seasonal factors but more to the measurement of the COVID-19 outbreak. The oscillatory phenomenon of population-based epidemics would be the new impetus for the study of public health. In the future, this index could be connected to more natural and human factors, which would contribute to constructing a more generic stimulated model to explain history and predict the future situation.
Limitations
One limitation of our study is that the data we used are from the entire mainland China but are not specific to different provinces or cities, which may lack spatial resolution. Another limitation of our study is that the results were based on a macroscopic rather than a microscopic view of most class B infectious diseases. Further studies are needed to clarify the deeper underlying mechanisms of the COVID-19 pandemic. With these findings, we could better provide the government with recommendations on the optimal timing to intervene before achieving herd immunity, thereby helping to design fit-for-purpose policies.
Conclusion
In sum, the study developed a new and potentially universal approach to revealing the dynamics of infectious diseases. The transmissibility and severity of infectious diseases fluctuate regularly. The introduction of the concept of the ERT in infectious diseases can better capture the immediate influence of interventions related to previous public health events. Our results confirmed that early commencement of strong public health interventions has additional benefits on other infectious diseases.
Acknowledgments
We acknowledge the National Health Commission of the People’s Republic of China for availability of the public data set on cases of 23 class B infectious diseases. This study was sponsored by the Beijing Municipal Hospital Clinical Technology Innovation and Research Plan (XMLX201805), the Beijing Municipal Hospital Research and Development Project (PX2021068), and the Advanced Innovation Center for Human Brain Protection Project (3500-12020137).
Abbreviations
- ERT
event-related trough
- HBV
hepatitis B virus
- HCV
hepatitis C virus
- HEV
hepatitis E virus
- NPI
nonpharmaceutical intervention
Stringency index in China after January 2020 (data from the Oxford COVID-19 Government Response Tracker).
Annual average of all infected cases diseases. HIV: Human Immunodeficiency Virus; HAV: hepatitis A virus; HBV: hepatitis B virus; HCV: hepatitis C virus; HEV: hepatitis E virus.
Monthly cases of infection for all diseases. HIV: Human Immunodeficiency Virus; HAV: hepatitis A virus; HBV: hepatitis B virus; HCV: hepatitis C virus; HEV: hepatitis E virus.
Annual average of all infected cases of diseases before (gray) and after (black) the COVID-19 outbreak. HIV: Human Immunodeficiency Virus; HAV: hepatitis A virus; HBV: hepatitis B virus; HCV: hepatitis C virus; HEV: hepatitis E virus.
Power spectrum of all infected cases before (gray) and after (black) the COVID-19 outbreak. HIV: Human Immunodeficiency Virus; HAV: hepatitis A virus; HBV: hepatitis B virus; HCV: hepatitis C virus; HEV: hepatitis E virus.
Footnotes
Authors' Contributions: CH, ML, and XZ conceived and designed the study. CH, ML, NH, YZ, JJ, and ZL contributed to the literature search. CH, JL, JT, SL, YZ, XZ, XW, and YL contributed to data collection. CH, YC, MG, XF, JQ, and MG contributed to data analysis and interpretation of results. All authors contributed to writing the paper.
Conflicts of Interest: The coauthors declare that the research was conducted in the absence of any commercial or financial relationships that could be construed as a potential conflict of interest.
References
- 1.Huang C, Wang Y, Li X, Ren L, Zhao J, Hu Y, Zhang L, Fan G, Xu J, Gu X, Cheng Z, Yu T, Xia J, Wei Y, Wu W, Xie X, Yin W, Li H, Liu M, Xiao Y, Gao H, Guo L, Xie J, Wang G, Jiang R, Gao Z, Jin Q, Wang J, Cao B. Clinical features of patients infected with 2019 novel coronavirus in Wuhan, China. Lancet. 2020 Feb;395(10223):497–506. doi: 10.1016/s0140-6736(20)30183-5. [DOI] [PMC free article] [PubMed] [Google Scholar]
- 2.Li Q, Guan X, Wu P, Wang X, Zhou L, Tong Y, Ren R, Leung KS, Lau EH, Wong JY, Xing X, Xiang N, Wu Y, Li C, Chen Q, Li D, Liu T, Zhao J, Liu M, Tu W, Chen C, Jin L, Yang R, Wang Q, Zhou S, Wang R, Liu H, Luo Y, Liu Y, Shao G, Li H, Tao Z, Yang Y, Deng Z, Liu B, Ma Z, Zhang Y, Shi G, Lam TT, Wu JT, Gao GF, Cowling BJ, Yang B, Leung GM, Feng Z. Early transmission dynamics in Wuhan, China, of novel coronavirus-infected pneumonia. N Engl J Med. 2020 Mar 26;382(13):1199–1207. doi: 10.1056/NEJMoa2001316. http://europepmc.org/abstract/MED/31995857 . [DOI] [PMC free article] [PubMed] [Google Scholar]
- 3.Wang H, Wang Z, Dong Y, Chang R, Xu C, Yu X, Zhang S, Tsamlag L, Shang M, Huang J, Wang Y, Xu G, Shen T, Zhang X, Cai Y. Phase-adjusted estimation of the number of coronavirus disease 2019 cases in Wuhan, China. Cell Discov. 2020 Feb 24;6(1):10. doi: 10.1038/s41421-020-0148-0. doi: 10.1038/s41421-020-0148-0.148 [DOI] [PMC free article] [PubMed] [Google Scholar]
- 4.Wang D, Zhou M, Nie X, Qiu W, Yang M, Wang X, Xu T, Ye Z, Feng X, Xiao Y, Chen W. Epidemiological characteristics and transmission model of corona virus disease 2019 in China. J Infect. 2020 May;80(5):e25–e27. doi: 10.1016/j.jinf.2020.03.008. http://europepmc.org/abstract/MED/32171870 .S0163-4453(20)30120-1 [DOI] [PMC free article] [PubMed] [Google Scholar]
- 5.Tian H, Liu Y, Li Y, Wu C, Chen B, Kraemer MUG, Li B, Cai J, Xu B, Yang Q, Wang B, Yang P, Cui Y, Song Y, Zheng P, Wang Q, Bjornstad ON, Yang R, Grenfell BT, Pybus OG, Dye C. An investigation of transmission control measures during the first 50 days of the COVID-19 epidemic in China. Science. 2020 May 08;368(6491):638–642. doi: 10.1126/science.abb6105. http://europepmc.org/abstract/MED/32234804 .science.abb6105 [DOI] [PMC free article] [PubMed] [Google Scholar]
- 6.Zhu N, Zhang D, Wang W, Li X, Yang B, Song J, Zhao X, Huang B, Shi W, Lu R, Niu P, Zhan F, Ma X, Wang D, Xu W, Wu G, Gao GF, Tan W. A novel coronavirus from patients with pneumonia in China, 2019. N Engl J Med. 2020 Feb 20;382(8):727–733. doi: 10.1056/nejmoa2001017. [DOI] [PMC free article] [PubMed] [Google Scholar]
- 7.Wu Jt, Leung K, Leung GM. Nowcasting and forecasting the potential domestic and international spread of the 2019-nCoV outbreak originating in Wuhan, China: a modelling study. Lancet. 2020 Feb;395(10225):689–697. doi: 10.1016/S0140-6736(20)30260-9. [DOI] [PMC free article] [PubMed] [Google Scholar]
- 8.Young L, Danial Z. Three pre-vaccine responses to Covid-like epidemics. PLoS One. 2021 May 13;16(5):e0251349. doi: 10.1371/journal.pone.0251349. https://dx.plos.org/10.1371/journal.pone.0251349 .PONE-D-20-40779 [DOI] [PMC free article] [PubMed] [Google Scholar]
- 9.Spina S, Marrazzo F, Migliari M, Stucchi R, Sforza A, Fumagalli R. The response of Milan's Emergency Medical System to the COVID-19 outbreak in Italy. Lancet. 2020 Mar;395(10227):e49–e50. doi: 10.1016/s0140-6736(20)30493-1. [DOI] [PMC free article] [PubMed] [Google Scholar]
- 10.Rosenbaum L. Facing Covid-19 in Italy: ethics, logistics, and therapeutics on the epidemic’s front line. N Engl J Med. 2020 May 14;382(20):1873–1875. doi: 10.1056/nejmp2005492. [DOI] [PubMed] [Google Scholar]
- 11.Han C, Li M, Haihambo N, Babuna P, Liu Q, Zhao X, Jaeger C, Li Y, Yang S. Mechanisms of recurrent outbreak of COVID-19: a model-based study. Nonlinear Dyn. 2021 Mar 18;106(2):1169–1185. doi: 10.1007/s11071-021-06371-w. http://europepmc.org/abstract/MED/33758464 .6371 [DOI] [PMC free article] [PubMed] [Google Scholar]
- 12.Martinez-Alvarez M, Jarde A, Usuf E, Brotherton H, Bittaye M, Samateh AL, Antonio M, Vives-Tomas J, D'Alessandro U, Roca A. COVID-19 pandemic in west Africa. Lancet Global Health. 2020 May;8(5):e631–e632. doi: 10.1016/s2214-109x(20)30123-6. [DOI] [PMC free article] [PubMed] [Google Scholar]
- 13.Dawood FS, Ricks P, Njie GJ, Daugherty M, Davis W, Fuller JA, Winstead A, McCarron M, Scott LC, Chen D, Blain AE, Moolenaar R, Li C, Popoola A, Jones C, Anantharam P, Olson N, Marston BJ, Bennett SD. Observations of the global epidemiology of COVID-19 from the prepandemic period using web-based surveillance: a cross-sectional analysis. Lancet Infect Dis. 2020 Nov;20(11):1255–1262. doi: 10.1016/s1473-3099(20)30581-8. [DOI] [PMC free article] [PubMed] [Google Scholar]
- 14.Han C, Liu Y, Tang J, Zhu Y, Jaeger C, Yang S. Lessons from the mainland of China’s epidemic experience in the first phase about the growth rules of infected and recovered cases of COVID-19 worldwide. Int J Disaster Risk Sci. 2020 Aug 18;11(4):497–507. doi: 10.1007/s13753-020-00294-7. [DOI] [Google Scholar]
- 15.Vasconcelos G, Macêdo A, Duarte-Filho G, Brum A, Ospina R, Almeida F. Complexity signatures in the COVID-19 epidemic: power law behaviour in the saturation regime of fatality curves. medRxiv. 2020 doi: 10.1101/2020.07.12.20152140. [DOI] [PMC free article] [PubMed] [Google Scholar]
- 16.Tang JW. COVID-19: interpreting scientific evidence - uncertainty, confusion and delays. BMC Infect Dis. 2020 Sep 08;20(1):653. doi: 10.1186/s12879-020-05387-8. https://bmcinfectdis.biomedcentral.com/articles/10.1186/s12879-020-05387-8 .10.1186/s12879-020-05387-8 [DOI] [PMC free article] [PubMed] [Google Scholar]
- 17.Feng L, Zhang T, Wang Q, Xie Y, Peng Z, Zheng J, Qin Y, Zhang M, Lai S, Wang D, Feng Z, Li Z, Gao GF. Impact of COVID-19 outbreaks and interventions on influenza in China and the United States. Nat Commun. 2021 May 31;12(1):3249. doi: 10.1038/s41467-021-23440-1. doi: 10.1038/s41467-021-23440-1.10.1038/s41467-021-23440-1 [DOI] [PMC free article] [PubMed] [Google Scholar]
- 18.Han C, Li M, Haihambo N, Cao Y, Zhao X. Enlightenment on oscillatory properties of 23 class B notifiable infectious diseases in the mainland of China from 2004 to 2020. PLoS One. 2021 Jun 9;16(6):e0252803. doi: 10.1371/journal.pone.0252803. https://dx.plos.org/10.1371/journal.pone.0252803 .PONE-D-21-03876 [DOI] [PMC free article] [PubMed] [Google Scholar]
- 19.Ortiz E, Clancy CM. Use of information technology to improve the quality of health care in the United States. Health Serv Res. 2003 Apr;38(2):xi–xxii. doi: 10.1111/1475-6773.00127. http://europepmc.org/abstract/MED/12785557 . [DOI] [PMC free article] [PubMed] [Google Scholar]
- 20.Chen S, Li J, Wang D, Fung H, Wong L, Zhao L. The hepatitis B epidemic in China should receive more attention. Lancet. 2018 Apr;391(10130):1572. doi: 10.1016/s0140-6736(18)30499-9. [DOI] [PubMed] [Google Scholar]
- 21.Liu Y, Chan T, Yap L, Luo Y, Xu W, Qin S, Zhao N, Yu Z, Geng X, Liu S. Resurgence of scarlet fever in China: a 13-year population-based surveillance study. Lancet Infect Dis. 2018 Aug;18(8):903–912. doi: 10.1016/s1473-3099(18)30231-7. [DOI] [PMC free article] [PubMed] [Google Scholar]
- 22.Luo T, Sumi A, Zhou D, Kamo K, Yu B, Zhao D, Mise K, Kobayashi N. Study on the effect of measles control programmes on periodic structures of disease epidemics in a large Chinese city. Epidemiol Infect. 2010 May 18;139(2):257–264. doi: 10.1017/s0950268810001056. [DOI] [PubMed] [Google Scholar]
- 23.Ma C, Hao X, Deng H, Wu R, Liu J, Yang Y, Li S, Han Y, Wei M, Zhang J, Wang J, Li H, Tian H, Xu B, Yu P, Wu X. Re-emerging of rabies in Shaanxi Province, China, from 2009 to 2015. J Med Virol. 2017 Sep 15;89(9):1511–1519. doi: 10.1002/jmv.24769. [DOI] [PubMed] [Google Scholar]
- 24.Zhang Y, Vrancken B, Feng Y, Dellicour S, Yang Q, Yang W, Zhang Y, Dong L, Pybus OG, Zhang H, Tian H. Cross-border spread, lineage displacement and evolutionary rate estimation of rabies virus in Yunnan Province, China. Virol J. 2017 Jun 03;14(1):102. doi: 10.1186/s12985-017-0769-6. https://virologyj.biomedcentral.com/articles/10.1186/s12985-017-0769-6 .10.1186/s12985-017-0769-6 [DOI] [PMC free article] [PubMed] [Google Scholar]
- 25.Tian H, Feng Y, Vrancken B, Cazelles B, Tan H, Gill MS, Yang Q, Li Y, Yang W, Zhang Y, Zhang Y, Lemey P, Pybus OG, Stenseth NC, Zhang H, Dellicour S. Transmission dynamics of re-emerging rabies in domestic dogs of rural China. PLoS Pathog. 2018 Dec 6;14(12):e1007392. doi: 10.1371/journal.ppat.1007392. https://dx.plos.org/10.1371/journal.ppat.1007392 .PPATHOGENS-D-18-01239 [DOI] [PMC free article] [PubMed] [Google Scholar]
- 26.Moore S, Hill EM, Tildesley MJ, Dyson L, Keeling MJ. Vaccination and non-pharmaceutical interventions for COVID-19: a mathematical modelling study. Lancet Infect Dis. 2021 Jun;21(6):793–802. doi: 10.1016/s1473-3099(21)00143-2. [DOI] [PMC free article] [PubMed] [Google Scholar]
- 27.Huang QS, Wood T, Jelley L, Jennings T, Jefferies S, Daniells K, Nesdale A, Dowell T, Turner N, Campbell-Stokes P, Balm M, Dobinson HC, Grant CC, James S, Aminisani N, Ralston J, Gunn W, Bocacao J, Danielewicz J, Moncrieff T, McNeill A, Lopez L, Waite B, Kiedrzynski T, Schrader H, Gray R, Cook K, Currin D, Engelbrecht C, Tapurau W, Emmerton L, Martin M, Baker MG, Taylor S, Trenholme A, Wong C, Lawrence S, McArthur C, Stanley A, Roberts S, Rahnama F, Bennett J, Mansell C, Dilcher M, Werno A, Grant J, van der Linden A, Youngblood B, Thomas PG, NPIsImpactOnFlu Consortium. Webby RJ. Impact of the COVID-19 nonpharmaceutical interventions on influenza and other respiratory viral infections in New Zealand. Nat Commun. 2021 Feb 12;12(1):1001. doi: 10.1038/s41467-021-21157-9. doi: 10.1038/s41467-021-21157-9.10.1038/s41467-021-21157-9 [DOI] [PMC free article] [PubMed] [Google Scholar]
- 28.Cowling BJ, Ali ST, Ng TWY, Tsang TK, Li JCM, Fong MW, Liao Q, Kwan MY, Lee SL, Chiu SS, Wu JT, Wu P, Leung GM. Impact assessment of non-pharmaceutical interventions against coronavirus disease 2019 and influenza in Hong Kong: an observational study. Lancet Public Health. 2020 May 17;5(5):e279–e288. doi: 10.1016/S2468-2667(20)30090-6. https://linkinghub.elsevier.com/retrieve/pii/S2468-2667(20)30090-6 .S2468-2667(20)30090-6 [DOI] [PMC free article] [PubMed] [Google Scholar]
- 29.Wu D, Lu J, Liu Y, Zhang Z, Luo L. Positive effects of COVID-19 control measures on influenza prevention. Int J Infect Dis. 2020 Jun;95:345–346. doi: 10.1016/j.ijid.2020.04.009. https://linkinghub.elsevier.com/retrieve/pii/S1201-9712(20)30225-3 .S1201-9712(20)30225-3 [DOI] [PMC free article] [PubMed] [Google Scholar]
- 30.Komiya K, Yamasue M, Takahashi O, Hiramatsu K, Kadota J, Kato S. The COVID-19 pandemic and the true incidence of tuberculosis in Japan. J Infect. 2020 Sep;81(3):e24–e25. doi: 10.1016/j.jinf.2020.07.004. http://europepmc.org/abstract/MED/32650109 .S0163-4453(20)30462-X [DOI] [PMC free article] [PubMed] [Google Scholar]
- 31.Chen B, Wang M, Huang X, Xie M, Pan L, Liu H, Liu Z, Zhou P. Changes in incidence of notifiable infectious diseases in China under the prevention and control measures of COVID-19. Front Public Health. 2021 Oct 15;9:728768. doi: 10.3389/fpubh.2021.728768. doi: 10.3389/fpubh.2021.728768. [DOI] [PMC free article] [PubMed] [Google Scholar]
- 32.Geng M, Zhang H, Yu L, Lv C, Wang T, Che T, Xu Q, Jiang B, Chen J, Hay SI, Li Z, Gao GF, Wang L, Yang Y, Fang L, Liu W. Changes in notifiable infectious disease incidence in China during the COVID-19 pandemic. Nat Commun. 2021 Nov 26;12(1):6923. doi: 10.1038/s41467-021-27292-7. doi: 10.1038/s41467-021-27292-7.10.1038/s41467-021-27292-7 [DOI] [PMC free article] [PubMed] [Google Scholar]
- 33.Dadras O, Alinaghi SAS, Karimi A, MohsseniPour M, Barzegary A, Vahedi F, Pashaei Z, Mirzapour P, Fakhfouri A, Zargari G, Saeidi S, Mojdeganlou H, Badri H, Qaderi K, Behnezhad F, Mehraeen E. Effects of COVID-19 prevention procedures on other common infections: a systematic review. Eur J Med Res. 2021 Jul 03;26(1):67. doi: 10.1186/s40001-021-00539-1. https://eurjmedres.biomedcentral.com/articles/10.1186/s40001-021-00539-1 .10.1186/s40001-021-00539-1 [DOI] [PMC free article] [PubMed] [Google Scholar]
- 34.Wang Z, Liu Y, Li Y, Wang G, Lourenço J, Kraemer M, He Q, Cazelles B, Li Y, Wang R, Gao D, Li Y, Song W, Sun D, Dong L, Pybus Og, Stenseth Nc, Tian H. The relationship between rising temperatures and malaria incidence in Hainan, China, from 1984 to 2010: a longitudinal cohort study. Lancet Planet Health. 2022 Apr;6(4):e350–e358. doi: 10.1016/s2542-5196(22)00039-0. [DOI] [PubMed] [Google Scholar]
- 35.Zhang X, Hou F, Li X, Zhou L, Liu Y, Zhang T. Study of surveillance data for class B notifiable disease in China from 2005 to 2014. Int J Infect Dis. 2016 Jul;48:7–13. doi: 10.1016/j.ijid.2016.04.010. https://linkinghub.elsevier.com/retrieve/pii/S1201-9712(16)31023-2 .S1201-9712(16)31023-2 [DOI] [PMC free article] [PubMed] [Google Scholar]
- 36.Gui J, Liu Z, Zhang T, Hua Q, Jiang Z, Chen B, Gu H, Lv H, Dong C. Epidemiological characteristics and spatial-temporal clusters of hand, foot, and mouth disease in Zhejiang Province, China, 2008-2012. PLoS One. 2015 Sep 30;10(9):e0139109. doi: 10.1371/journal.pone.0139109. https://dx.plos.org/10.1371/journal.pone.0139109 .PONE-D-15-00912 [DOI] [PMC free article] [PubMed] [Google Scholar]
- 37.Zhang X, Hou F, Qiao Z, Li X, Zhou L, Liu Y, Zhang T. Temporal and long-term trend analysis of class C notifiable diseases in China from 2009 to 2014. BMJ Open. 2016 Oct 17;6(10):e011038. doi: 10.1136/bmjopen-2016-011038. https://bmjopen.bmj.com/lookup/pmidlookup?view=long&pmid=27797981 .bmjopen-2016-011038 [DOI] [PMC free article] [PubMed] [Google Scholar]
- 38.Anderson RM, Grenfell BT, May RM. Oscillatory fluctuations in the incidence of infectious disease and the impact of vaccination: time series analysis. J Hyg (Lond) 1984 Dec 19;93(3):587–608. doi: 10.1017/s0022172400065177. http://europepmc.org/abstract/MED/6512259 . [DOI] [PMC free article] [PubMed] [Google Scholar]
- 39.Broutin H, Guégan J-F, Elguero E, Simondon F, Cazelles B. Large-scale comparative analysis of pertussis population dynamics: periodicity, synchrony, and impact of vaccination. Am J Epidemiol. 2005 Jun 15;161(12):1159–1167. doi: 10.1093/aje/kwi141.161/12/1159 [DOI] [PubMed] [Google Scholar]
- 40.Sumi A, Kamo K, Ohtomo N, Kobayashi N. Study of the effect of vaccination on periodic structures of measles epidemics in Japan. Microbiol Immunol. 2007 Nov 14;51(9):805–814. doi: 10.1111/j.1348-0421.2007.tb03976.x. https://onlinelibrary.wiley.com/resolve/openurl?genre=article&sid=nlm:pubmed&issn=0385-5600&date=2007&volume=51&issue=9&spage=805 .JST.JSTAGE/mandi/51.805 [DOI] [PubMed] [Google Scholar]
- 41.Greer M, Saha R, Gogliettino A, Yu C, Zollo-Venecek K. Emergence of oscillations in a simple epidemic model with demographic data. R Soc Open Sci. 2020 Jan 29;7(1):191187. doi: 10.1098/rsos.191187. https://royalsocietypublishing.org/doi/10.1098/rsos.191187?url_ver=Z39.88-2003&rfr_id=ori:rid:crossref.org&rfr_dat=cr_pub%3dpubmed .rsos191187 [DOI] [PMC free article] [PubMed] [Google Scholar]
- 42.Pons-Salort M, Grassly NC. Serotype-specific immunity explains the incidence of diseases caused by human enteroviruses. Science. 2018 Aug 24;361(6404):800–803. doi: 10.1126/science.aat6777. http://europepmc.org/abstract/MED/30139872 .361/6404/800 [DOI] [PMC free article] [PubMed] [Google Scholar]
- 43.National Health Commission of the People’s Republic of China. [2022-06-17]. http://www.nhc.gov.cn/ [DOI] [PMC free article] [PubMed]
- 44.OxCGRT team at the Blavatnik School of Government Oxford COVID-19 Government Response Tracker. [2022-06-17]. https://covidtracker.bsg.ox.ac.uk/
- 45.Zhao X, Li H, Wang E, Luo X, Han C, Cao Q, Liu L, Chen J, Wang C, Johnstone SJ, Wang Y, Sun L. Neural correlates of working memory deficits in different adult outcomes of ADHD: an event-related potential study. Front Psychiatry. 2020 May 1;11:348. doi: 10.3389/fpsyt.2020.00348. doi: 10.3389/fpsyt.2020.00348. [DOI] [PMC free article] [PubMed] [Google Scholar]
- 46.Han C, Wang T, Yang Y, Wu Y, Li Y, Dai W, Zhang Y, Wang B, Yang G, Cao Z, Kang J, Wang G, Li L, Yu H, Yeh C, Xing D. Multiple gamma rhythms carry distinct spatial frequency information in primary visual cortex. PLoS Biol. 2021 Dec 21;19(12):e3001466. doi: 10.1371/journal.pbio.3001466. https://dx.plos.org/10.1371/journal.pbio.3001466 .PBIOLOGY-D-21-01352 [DOI] [PMC free article] [PubMed] [Google Scholar]
- 47.Han C, Wang T, Wu Y, Li Y, Yang Y, Li L, Wang Y, Xing D. The generation and modulation of distinct gamma oscillations with local, horizontal, and feedback connections in the primary visual cortex: a model study on large-scale networks. Neural Plast. 2021;2021:8874516. doi: 10.1155/2021/8874516. doi: 10.1155/2021/8874516. [DOI] [PMC free article] [PubMed] [Google Scholar]
- 48.Percival DB, Walden AT. Spectral Analysis for Physical Applications: Multitaper and Conventional Univariate Techniques. Cambridge: Cambridge University Press; 1993. [Google Scholar]
- 49.Chronux Analysis Software. [2022-06-17]. http://chronux.org .
- 50.Zhang X, Zhang T, Young AA, Li X. Applications and comparisons of four time series models in epidemiological surveillance data. PLoS One. 2014 Feb;9(2):e88075. doi: 10.1371/journal.pone.0088075. https://dx.plos.org/10.1371/journal.pone.0088075 .PONE-D-13-29169 [DOI] [PMC free article] [PubMed] [Google Scholar]
- 51.Chen M, Zhang C, Kong D, Pan H, Zhang X, Chen M. Investigation of Streptococcus pyogenes carriage in population vulnerable to scarlet fever during 2015-2017 in Shanghai, China. J Biosci Med. 2018;06(11):89–97. doi: 10.4236/jbm.2018.611009. [DOI] [Google Scholar]
- 52.Lu Q, Ding Z, Wu C, Wu H, Lin J. Analysis of epidemiological characteristics of notifiable diseases reported in children aged 0-14 years from 2008 to 2017 in Zhejiang Province, China. Int J Environ Res Public Health. 2019 Jan 09;16(2):168. doi: 10.3390/ijerph16020168. https://www.mdpi.com/resolver?pii=ijerph16020168 .ijerph16020168 [DOI] [PMC free article] [PubMed] [Google Scholar]
- 53.Fine P E, Clarkson J A. Seasonal influences on pertussis. Int J Epidemiol. 1986 Jun;15(2):237–247. doi: 10.1093/ije/15.2.237. [DOI] [PubMed] [Google Scholar]
- 54.De Greeff SC, Dekkers ALM, Teunis P, Rahamat-Langendoen JC, Mooi FR, De Melker HE. Seasonal patterns in time series of pertussis. Epidemiol Infect. 2009 Mar 30;137(10):1388–1395. doi: 10.1017/s0950268809002489. [DOI] [PubMed] [Google Scholar]
- 55.Wearing HJ, Rohani P. Estimating the duration of pertussis immunity using epidemiological signatures. PLoS Pathog. 2009 Oct 30;5(10):e1000647. doi: 10.1371/journal.ppat.1000647. https://dx.plos.org/10.1371/journal.ppat.1000647 . [DOI] [PMC free article] [PubMed] [Google Scholar]
- 56.Rana MS, Usman M, Alam MM, Ikram A, Salman M, Zaidi SSZ, Umair M, Qadir M. Impact of COVID-19 preventive measures on other infectious and non-infectious respiratory diseases in Pakistan. J Infect. 2021 May;82(5):e31–e32. doi: 10.1016/j.jinf.2021.01.018. http://europepmc.org/abstract/MED/33524424 .S0163-4453(21)00041-4 [DOI] [PMC free article] [PubMed] [Google Scholar]
- 57.Lim RH, Chow A, Ho HJ. Decline in pneumococcal disease incidence in the time of COVID-19 in Singapore. J Infect. 2020 Dec;81(6):e19–e21. doi: 10.1016/j.jinf.2020.08.020. http://europepmc.org/abstract/MED/32810519 .S0163-4453(20)30554-5 [DOI] [PMC free article] [PubMed] [Google Scholar]
- 58.Gunning CE, Ferrari MJ, Erhardt EB, Wearing HJ. Evidence of cryptic incidence in childhood diseases. Proc Biol Sci. 2017 Aug 30;284(1861):20171268. doi: 10.1098/rspb.2017.1268. http://europepmc.org/abstract/MED/28855364 .rspb.2017.1268 [DOI] [PMC free article] [PubMed] [Google Scholar]
- 59.Bhattacharyya S, Ferrari MJ, Bjørnstad ON. Species interactions may help explain the erratic periodicity of whooping cough dynamics. Epidemics. 2018 Jun;23:64–70. doi: 10.1016/j.epidem.2017.12.005. https://linkinghub.elsevier.com/retrieve/pii/S1755-4365(17)30187-1 .S1755-4365(17)30187-1 [DOI] [PubMed] [Google Scholar]
- 60.Hitz DA, Tewald F, Eggers M. Seasonal Bordetella pertussis pattern in the period from 2008 to 2018 in Germany. BMC Infect Dis. 2020 Jul 03;20(1):474. doi: 10.1186/s12879-020-05199-w. https://bmcinfectdis.biomedcentral.com/articles/10.1186/s12879-020-05199-w .10.1186/s12879-020-05199-w [DOI] [PMC free article] [PubMed] [Google Scholar]
- 61.Tian H, Yu P, Cazelles B, Xu L, Tan H, Yang J, Huang S, Xu B, Cai J, Ma C, Wei J, Li S, Qu J, Laine M, Wang J, Tong S, Stenseth NC, Xu B. Interannual cycles of Hantaan virus outbreaks at the human-animal interface in Central China are controlled by temperature and rainfall. Proc Natl Acad Sci U S A. 2017 Jul 25;114(30):8041–8046. doi: 10.1073/pnas.1701777114. https://www.pnas.org/doi/abs/10.1073/pnas.1701777114?url_ver=Z39.88-2003&rfr_id=ori:rid:crossref.org&rfr_dat=cr_pub%3dpubmed .1701777114 [DOI] [PMC free article] [PubMed] [Google Scholar]
- 62.Suk J, Vaughan E, Cook R, Semenza J. Natural disasters and infectious disease in Europe: a literature review to identify cascading risk pathways. Eur J Public Health. 2020 Oct 01;30(5):928–935. doi: 10.1093/eurpub/ckz111. http://europepmc.org/abstract/MED/31169886 .5512023 [DOI] [PMC free article] [PubMed] [Google Scholar]
- 63.Yorke JA, London WP. Recurrent outbreaks of measles, chickenpox and mumps. II. Systematic differences in contact rates and stochastic effects. Am J Epidemiol. 1973 Dec;98(6):469–482. doi: 10.1093/oxfordjournals.aje.a121576. [DOI] [PubMed] [Google Scholar]
- 64.Fine P E, Clarkson J A. Measles in England and Wales--I: an analysis of factors underlying seasonal patterns. Int J Epidemiol. 1982 Mar;11(1):5–14. doi: 10.1093/ije/11.1.5. [DOI] [PubMed] [Google Scholar]
- 65.Ferrari MJ, Grais RF, Bharti N, Conlan AJK, Bjørnstad ON, Wolfson LJ, Guerin PJ, Djibo A, Grenfell BT. The dynamics of measles in sub-Saharan Africa. Nature. 2008 Feb 07;451(7179):679–684. doi: 10.1038/nature06509.nature06509 [DOI] [PubMed] [Google Scholar]
- 66.Bharti N, Tatem AJ, Ferrari MJ, Grais RF, Djibo A, Grenfell BT. Explaining seasonal fluctuations of measles in Niger using nighttime lights imagery. Science. 2011 Dec 09;334(6061):1424–1427. doi: 10.1126/science.1210554. http://europepmc.org/abstract/MED/22158822 .334/6061/1424 [DOI] [PMC free article] [PubMed] [Google Scholar]
- 67.Buonomo B, Della Marca R. Oscillations and hysteresis in an epidemic model with information-dependent imperfect vaccination. Math Comput Simul. 2019 Aug;162:97–114. doi: 10.1016/j.matcom.2019.01.005. [DOI] [Google Scholar]
- 68.Fisman D. Seasonality of viral infections: mechanisms and unknowns. Clin Microbiol Infect. 2012 Oct;18(10):946–954. doi: 10.1111/j.1469-0691.2012.03968.x. https://linkinghub.elsevier.com/retrieve/pii/S1198-743X(14)61091-0 .S1198-743X(14)61091-0 [DOI] [PubMed] [Google Scholar]
Associated Data
This section collects any data citations, data availability statements, or supplementary materials included in this article.
Supplementary Materials
Stringency index in China after January 2020 (data from the Oxford COVID-19 Government Response Tracker).
Annual average of all infected cases diseases. HIV: Human Immunodeficiency Virus; HAV: hepatitis A virus; HBV: hepatitis B virus; HCV: hepatitis C virus; HEV: hepatitis E virus.
Monthly cases of infection for all diseases. HIV: Human Immunodeficiency Virus; HAV: hepatitis A virus; HBV: hepatitis B virus; HCV: hepatitis C virus; HEV: hepatitis E virus.
Annual average of all infected cases of diseases before (gray) and after (black) the COVID-19 outbreak. HIV: Human Immunodeficiency Virus; HAV: hepatitis A virus; HBV: hepatitis B virus; HCV: hepatitis C virus; HEV: hepatitis E virus.
Power spectrum of all infected cases before (gray) and after (black) the COVID-19 outbreak. HIV: Human Immunodeficiency Virus; HAV: hepatitis A virus; HBV: hepatitis B virus; HCV: hepatitis C virus; HEV: hepatitis E virus.