

Abstract
Background and Objectives
Accurate delineation of the seizure-onset zone (SOZ) in focal drug-resistant epilepsy often requires stereo-EEG (SEEG) recordings. Our aims were to propose a truly objective and quantitative comparison between EEG/magnetoencephalography (MEG) source imaging (EMSI), EEG/fMRI responses for similar spikes with primary irritative zone (PIZ) and SOZ defined by SEEG and to evaluate the value of EMSI and EEG/fMRI to predict postsurgical outcome.
Methods
We identified patients with drug-resistant epilepsy who underwent EEG/MEG, EEG/fMRI, and subsequent SEEG at the Epilepsy Service from the Montreal Neurological Institute and Hospital. We quantified multimodal concordance within the SEEG channel space as spatial overlap with PIZ/SOZ and distances to the spike-onset, spike maximum amplitude and seizure core intracerebral channels by applying a new methodology consisting of converting EMSI results into SEEG electrical potentials (EMSIe–SEEG) and projecting the most significant fMRI response on the SEEG channels (fMRIp–SEEG). Spatial overlaps with PIZ/SOZ (AUCPIZ, AUCSOZ) were assessed by using the area under the receiver operating characteristic curve (AUC). Here, AUC represents the probability that a randomly picked active contact exhibited higher amplitude when located inside the spatial reference than outside.
Results
Seventeen patients were included. Mean spatial overlaps with the PIZ and SOZ were 0.71 and 0.65 for EMSIe–SEEG and 0.57 and 0.62 for fMRIp–SEEG. Good EMSIe–SEEG spatial overlap with the PIZ was associated with smaller distance from the maximum EMSIe–SEEG contact to the spike maximum amplitude channel (median distance 14 mm). Conversely, good fMRIp–SEEG spatial overlap with the SOZ was associated with smaller distances from the maximum fMRIp–SEEG contact to the spike-onset and seizure core channels (median distances 10 and 5 mm, respectively). Surgical outcomes were correctly predicted by EEG/MEG in 12 of 15 (80%) patients and EEG/fMRI in 6 of 11(54%) patients.
Discussion
With the use of a unique quantitative approach estimating EMSI and fMRI results in the reference SEEG channel space, EEG/MEG and EEG/fMRI accurately localized the SOZ and the PIZ. Precisely, EEG/MEG more accurately localized the PIZ, whereas EEG/fMRI was more sensitive to the SOZ. Both neuroimaging techniques provide complementary localization that can help guide SEEG implantation and select good candidates for surgery.
Accurate delineation of the epileptogenic zone (EZ) during presurgical workup of focal drug-resistant epilepsy patients can be challenging in complex cases such as MRI-negative and suspected extratemporal generator.1 Intracranial EEG investigation, considered the gold standard for the EZ localization, is often required to map the seizure-onset zone (SOZ) and to determine surgical candidacy.2 However, a successful investigation requires a strong preimplantation hypothesis, which can be derived from noninvasive investigations.3,4
Simultaneous EEG/magnetoencephalography (MEG) and EEG/fMRI are noninvasive techniques that exploit different properties of neurophysiologic signals. EEG/fMRI allows the study, with high spatial resolution, of changes in brain oxygenation via the blood oxygen level–dependent (BOLD) signal in response to epileptic spikes detected on scalp EEG.5 In contrast, MEG directly records the magnetic field generated by spikes. Localization of spikes generators via magnetic source imaging (MSI) benefits from high temporal and good spatial resolution.6 EEG/fMRI studies have reported that the most significant BOLD response has a good correlation with intracranial findings.7-9 However, despite resection of the most significant hemodynamic response area, 30% of patients do not achieve seizure freedom postoperatively.10 Similarly, although numerous MSI studies reported good concordance with intracranial findings,3,4,6,11-16 MSI accuracy on predicting postoperative outcome remains at 50%.4 This low rate might be related to the lack of consideration of the spatial extent of the overlap between MSI (or fMRI cluster) and intracranial data, considering only qualitative comparison usually at a sublobar level, which leads to overestimation of the concordance rates.
Neurophysiologic presurgical investigation should accurately address source localization and spatial extent to efficiently guide intracranial implantation and to select good candidates for surgery. Although some studies have reported concordance with gold-standard intracranial recordings, most comparisons were performed with grids/strips used as reference.12,17,18 Stereo-EEG (SEEG), in contrast to grids, allows sampling of sulci and deep structures, which are equally important to investigate as most superficial aspects of the cortex.19,20 In addition, whereas MEG is often simultaneously recorded with scalp EEG, few studies exploited the complementarity between simultaneous EEG/MEG data.4,14,21,22 EEG/MEG source imaging (EMSI), defined here as source imaging obtained from the fusion of EEG and MEG data, can significantly improve the spikes source localization accuracy.21,22 Furthermore, only a few studies have assessed the multimodal EEG/MEG, EEG/fMRI, and SEEG investigation.9,23,24 None evaluated quantitatively the spatial extent of each modality with SEEG.
To address these challenges, our aim was to assess (1) the spatial overlap between EMSI, EEG/fMRI, and the region exhibiting the most frequent spikes, the primary irritative zone (PIZ), and the SOZ defined by SEEG; (2) the accuracy of EMSI and EEG/fMRI when localizing the spike-onset and spike maximum amplitude SEEG channels within the PIZ and the channel with the highest epileptogenicity index,25 the seizure core, within the SOZ and (3) the value of EMSI and EEG/fMRI in predicting postsurgical outcome. We hypothesized that overlaps between EMSI and EEG/fMRI with PIZ and SOZ will be comparable. Furthermore, EMSI will accurately localize spikes associated with more synchronized generators (spike maximum amplitude), resulting in good signal to noise ratio (SNR), whereas fMRI will accurately localize regions requiring higher oxygen consumption (spike onset and seizure core).
Methods
Standard Protocol Approvals, Registrations, and Patient Consents
From October 2008 to November 2019, we identified in our MEG database all patients with focal drug-resistant epilepsy who underwent, at the Epilepsy Service from the Montreal Neurological Institute and Hospital, simultaneous EEG/MEG and EEG/fMRI acquisitions and subsequent SEEG recording as part of their presurgical investigation. Figure 1 provides the flowchart for patient selection. This study was approved by the Montreal Neurological Institute Research Ethics Board and complies with the Code of Ethics of the World Medical Association (Declaration of Helsinki). All patients signed a written informed consent before participation in EEG/MEG and EEG/fMRI studies.
Figure 1. Flowchart of Patient Selection.

MEG = magnetoencephalography; SEEG = stereo-EEG; SOZ = seizure-onset zone.
EEG/fMRI
Simultaneous EEG/fMRI acquisition, processing, and analysis were completed as described in previous studies.7,8,10 Briefly, recordings were performed inside a 3T MRI scanner with 25 magnetic resonance–compatible EEG electrodes. fMRI data were collected in 6-minute runs for a total of 6 to 15 runs in a resting-state condition. Spikes were visually marked by epileptologists and grouped into types according to their spatial distribution. fMRI data were analyzed as an event-related design with fMRIstat.26 Each spike type was associated to a regressor within a general linear model, obtained by considering the timing of every spike and convolving with 4 predefined hemodynamic response functions peaking at 3, 5, 7, and 9 seconds.27 A statistical t map was created for each regressor using additional regressors as confounds. A combined t map was created by taking, at each voxel, the highest t value (or the lowest for negative responses) from the 4 t maps created with each hemodynamic response function. This combined t map from each spike type was first thresholded and corrected assuming a whole-brain topologic false discovery rate of 0.05.7,8 As demonstrated in our previous studies,7,8 only the fMRI cluster associated with the highest absolute t value, that is, the most significant cluster, was considered for analysis.
EEG/MEG
As in our previous studies, simultaneous EEG/MEG data were recorded from a 275-gradiometer CTF MEG-system (MISL, Vancouver, British Columbia, Canada) and a 56-channel EEG cap (Easy-Cap, Herrsching, Germany).6,16,22 Briefly, recordings were performed with the patient lying down in a supine position. Eye movements, heartbeat, and head position were continuously monitored with dedicated sensors. Recordings lasted ≈1 hour (10 runs of 6 minutes each). EEG and MEG data were visually inspected with the DataEditor software (MISL). Spikes were visually marked by a board-certified epileptologist (C.A.) at their peak on the EEG signal to ensure that the comparison included similar spikes in spatial topography compared to those selected in EEG/fMRI analysis. The 2 runs exhibiting the largest spikes numbers (or 1 run if the number exceeded 100) were selected for EMSI. For source localization, we proposed the coherent maximum entropy on the mean (cMEM) method, known to be sensitive to the spatial extent of the underlying generators,28-30 as opposed to most distributed source imaging techniques. cMEM framework also allows a fusion approach for EMSI, integrating EEG and MEG measures to yield a single source model.21,22 EMSI was performed on every single spike marked. Then, to ensure EMSI reliability for every spike type, a consensus map was estimated by applying hierarchical clustering on every spike source map and averaging the maps corresponding to the cluster exhibiting the largest number of spikes.22,31 For patients with <10 spikes, EMSI was performed using the averaged signal as a tradeoff between consensus map reliability and source localizations SNR. The resulting consensus EMSI maps were analyzed at 4 different time points along the averaged spike: (1) earliest point (spike takeoff signal on either on EEG or MEG, whichever comes first), (2) middle of the ascendant phase of the first peak, (3) first peak, and (4) second modality peak, when delayed compared with the first peak.
Stereo-Electroencephalography
SEEG targets were decided according to the presurgical hypotheses of the suspected EZ. Results from EEG/MEG and EEG/fMRI were eventually considered in some patients for SEEG implantation at the treating physician’s discretion. Recordings were performed using stereotactic intracerebral electrodes with multiple contacts (Dixi Medical, Besancon, France; 1.5-mm contact spacing, 10–18 contacts, 2-mm length, 0.8-mm diameter) and conducted at 2,000-Hz sampling frequency band with 0.1–600-Hz band-pass filter. The average number of electrodes was 9 per patient with an average number of 98 SEEG contacts per patient.
Primary Irritative Zone
Sixteen minutes of continuous awake SEEG recording was selected at least 48 hours after implantation to avoid potential influence of anesthesia and acute implantation effect. Selected SEEG segment was analyzed offline with Brainstorm software (by C.A.). SEEG contacts with artifacts were excluded. Channels with the most frequent spikes were visually identified. Then, synchronous or almost-synchronous spikes in multiple contacts (at least 2 contacts, visual inspection 25–30 mm/s) and spikes exhibiting the same polarity were marked at their maximum peak (in case of several spikes with different polarities, the most frequent polarity was considered). We identified the contact with the first peak and subsequently averaged all marked spikes at their peak, time-locked to the first peak. Contact showing the first peak (spike onset) and the one exhibiting the largest amplitude (spike maximum amplitude) were identified in the resulting averaged signal. Spike maximum amplitude was further confirmed by quantitative estimation. PIZ was defined as the list of contacts showing an averaged spike with a peak that occurred not later than 30 milliseconds after the first peak on spike-onset channel because the fast spread of spikes usually occurs within 10 to 50 milliseconds.32
Seizure-Onset Zone
The SOZ was visually defined as the contacts showing the first clear SEEG changes from the background activity that led to a seizure. Only spontaneous seizures were analyzed. Within the SOZ, the seizure core was defined as the common contact between 2 contiguous bipolar channels exhibiting the highest epileptogenicity index. We used the method proposed by David et al.25 in which this index estimates the tendency of a region to generate significant fast activities at seizure onset using spectral and temporal information of SEEG signals. When its estimation was not possible because of the involvement of oscillations with too low a frequency, we identified as seizure core the common bipolar contact showing the fastest frequency using time-frequency analysis. Same seizures were considered for visual identification and epileptogenicity index estimation. When a patient had >1 seizure, the index was estimated by pooling all the seizures.
Spatial Overlap Between EMSI, fMRI, and SEEG
Quantitative comparison between SEEG, EMSI, and fMRI results requires all modalities to be estimated within the same space (additional information in the eMethod 1 and eFigure 1, links.lww.com/WNL/B982). Postimplantation MRI/CT with SEEG electrodes and anatomic MRI acquired during EEG/fMRI and fMRI t maps were coregistered with our spatial reference, the 3T MRI used for EMSI. SEEG contacts were manually identified on postimplantation MRI/CT and resampled in our anatomic reference. SEEG contacts located outside the brain were excluded. EMSI consensus maps and fMRI cluster were converted into the SEEG channel space for quantitative comparison. Specifically, to handle measurements of different nature, source imaging measures current density in nanoAmpere-meters vs electrical potentials in microVolts measured by SEEG, we estimated SEEG electric potentials that would correspond to EMSI results by applying an SEEG forward model to the source map, hence assessing quantitatively how EMSI could be evaluated by the implanted SEEG electrodes33 (details in eMethod 2). For EEG/fMRI, we projected t values from the most significant fMRI cluster on the corresponding SEEG channels. In particular, we considered a 10-mm-radius sphere (each SEEG contact was a center of a sphere) as the projection kernel. The fMRI maximum t value (positive/negative) located within this sphere was then considered an fMRI result for this specific SEEG contact.
For each EMSI map, the resulting EMSI-estimated SEEG signal, denoted EMSIe–SEEG, was compared to PIZ and SOZ references, using the area under the receiver operating characteristic curve (AUC) by varying the amplitude threshold of EMSIe–SEEG signal. AUC represents the probability that a randomly picked active contact exhibited higher amplitude when located inside the spatial reference than outside (eTable 1, links.lww.com/WNL/B982).
EMSI was analyzed at 4 time points resulting in 4 AUC values. Only EMSI from the time point exhibiting the best AUC performance (tsel) with PIZ (AUCPIZ) was considered (eFigures 2 and 3, links.lww.com/WNL/B982). We then used tsel to compute EMSI AUC with SOZ reference (AUCSOZ). A perfect spatial match between EMSIe–SEEG and reference would then correspond to an AUC of 1.0. However, because perfect overlap is unlikely to occur, an AUC ≥0.7 was considered a good spatial overlap for PIZ and SOZ references.34 Spatial overlap between fMRI projected-SEEG data, denoted fMRIp–SEEG, with PIZ and SOZ references was similarly assessed.
Localizing value of the overlap between EMSIe–SEEG and fMRIp–SEEG was also evaluated. Because EMSIe–SEEG and fMRIp–SEEG were quantities of different nature (electrical potential vs BOLD t value), we first normalized these estimators, by their corresponding maximum value in each modality. Then, we computed a combined AUC by varying the same threshold for both normalized data, labeling as true positive, when the results of both modalities above a specific threshold were located inside the reference.
Accuracy of EMSI and fMRI to Localize Spike Onset, Spike Maximum Amplitude, and Seizure Core
To assess the accuracy of each modality when localizing spike onset, spike maximum amplitude, and seizure core channels, we computed the euclidean distances between EMSIe–SEEG contact exhibiting the maximum amplitude at tsel and these 3 reference contacts (eFigures 4 and 5 links.lww.com/WNL/B982). Similar computations were performed with the fMRIp–SEEG contact exhibiting the highest absolute t value.
Relationship Between AUC and Distances
Spatial overlaps AUCPIZ and AUCSOZ were studied as a function of the distance to spike onset, spike maximum amplitude, and seizure core channels to evaluate the predictive value of each modality. In addition, patients were classified into good (AUC >0.7) and poor (AUC <0.7) spatial overlap groups.
Comparison With Postsurgical Outcome
The last follow-up after surgical resection or thermocoagulation was considered for patient's classification as seizure-free (Engel class Ia) or non–seizure-free outcome (Engel classes Ib–IV). Because the main goal of SEEG investigation was to localize the EZ, which includes the SOZ, only SOZ-related measures (AUCSOZ and distance to seizure core) were considered.
EMSIe–SEEG and fMRIp–SEEG findings were classified as positive when observing the combination of AUCSOZ >0.7 and distance to SOZ core <20 mm; otherwise, results were considered negative. The 20-mm choice was derived from SEEG, in which electrode implantation spacing is usually >20 mm, which leads to an SOZ precision usually <20 mm. True-positive patients were defined as having positive results and seizure-free outcome; true-negative patients as having negative results and non–seizure-free outcome; false-positive patients as having positive results and non–seizure-free outcome; and false-negative patients as having negative results and seizure-free outcome. Sensitivity, specificity, and positive and negative predictive values were then estimated.
Statistical Analyses
We used paired t tests to compare distributions of AUC and distance values for each modality and reference (PIZ, SOZ) (significance level: 2-tailed p < 0.05) and Mann-Whitney U test and linear regression to assess the relationship between spatial overlap and distances. All statistical analyses were done with SPSS (SPSS Inc, Chicago, IL) and MATLAB (MathWorks, Natick, MA).
Data Availability
Data are available on reasonable request.
Results
Patient Characteristics
Seventeen patients were analyzed (Figure 1). Table1 and eTable 2 (links.lww.com/WNL/B982) provide demographic and neurophysiologic data. Eighteen studies from 17 patients were considered (1 single type of spikes per patient except P4). All patients had EMSI results, whereas EEG/fMRI resulted in significant statistical BOLD responses in 13 (76%) patients.
Table 1.
Patient Characteristics

A total of 789 spikes (range 7–147) were marked in EEG/MEG, 1,980 (range 14–387) in EEG/fMRI, and 1974 (range 24–587) in SEEG data. For SOZ, 38 (range 1–3) seizures were analyzed. Epileptogenicity indices were estimated for all patients except P14, whose seizure-onset was characterized by a too slow oscillatory pattern (seizure core then chosen as the common bipolar contact exhibiting the fastest frequency).
Spatial Overlap of EMSI and fMRI Results With PIZ and SOZ
Figures 2–4 (further details in eFigures 6–8, links.lww.com/WNL/B982) illustrate cases with good spatial overlaps with PIZ and SOZ in (1) both modalities, (2) only fMRIp–SEEG, and (3) only fMRIp–SEEG.
Figure 2. Example of a Patient With a Right Posterior Cortex Epilepsy, Presenting Good Spatial Overlaps Between EMSI, fMRI Results, and SEEG Findings (PIZ, SOZ).

Complete illustration is given in eFigure 6 (links.lww.com/WNL/B982). This patient underwent 2 right posterior resections with an extension of the cortical resection in the middle and inferior temporal gyri during the second surgery. The patient is seizure-free at the last follow-up (>1 year). Pathology showed focal cortical dysplasia type IIa. (A) Maximum of the EEG/magnetoencephalography source imaging (EMSI) consensus map (obtained using a cluster of n = 97 of 147 spike source maps, localized on the right temporo-occipital region) and its 2-dimensional (2D) representation on all stereo-EEG (SEEG) contacts after conversion into estimated SEEG signal (EMSIe–SEEG). The contact showing the maximum amplitude (in microvolts) in absolute value was RL 9 (black arrow). (B) Negative blood oxygen level–dependent cluster exhibiting the highest absolute t value on the right posterior quadrant and its 2D representation of the corresponding t values on all SEEG contacts after projection. The contact with the maximum absolute t value (−7.5) was RL 7 (green arrow). (C) A 2D representation of the SEEG findings. Contacts corresponding to the spike onset, spike maximum amplitude, and seizure core (largest epileptogenicity index) are marked in blue (RL 5), orange (RL 9), and red (RL 8), respectively. The spatial overlaps between EMSIe–SEEG and primary irritative zone (PIZ) and seizure-onset zone (SOZ) were all good (area under the receiver operating characteristic curve [AUC] >0.70, AUCPIZ = 0.92, AUCSOZ = 0.83, respectively). Similarly, the spatial overlaps between fMRIp–SEEG and PIZ and SOZ were also both good (AUCPIZ = 0.78, AUCSOZ = 0.74, respectively). The shortest distance between the EMSIe–SEEG maximum amplitude contact and the SEEG reference contacts was obtained for the spike maximum amplitude contact (d = 0 mm). The shortest distance between the fMRIp–SEEG contact showing maximum t value and the SEEG reference contact was obtained for the seizure core contact (d = 5 mm). Electrode RA was aimed at the right amygdala, RCa at the right anterior cingulate, RCp at the right posterior cingulate, RH at the right hippocampus, RHp at the right posterior hippocampus, RIp the right posterior insula, and RL at the right temporo-occipital junction (suspected lesion but not confirmed finally at the visual MRI analysis). ext = External; int = internal.
Figure 3. Example of a Case With Left Posterior Insula Epilepsy, Presenting Good Spatial Overlaps Between fMRI Results and SEEG Findings (SOZ).

Complete illustration is given in eFigure 7 (links.lww.com/WNL/B982). This patient underwent a resection of the left posterior insula, transverse, and Heschl gyri. Patient is not seizure-free at the last follow-up (>1 year). Pathology showed a diffuse gliosis. (A) Maximum of the EEG/magnetoencephalography source imaging (EMSI) consensus map (obtained using a cluster of n = 10 of 17 spike source maps, localized on the left middle-posterior temporal region) and its 2-dimensional (2D) representation on all stereo-EEG (SEEG) contacts after conversion into estimated SEEG signal (EMSIe–SEEG). The contact showing the maximum amplitude (in microvolts) in absolute value was LHp 7 (black arrow). (B) Negative blood oxygen level–dependent cluster exhibiting the highest absolute t value on the left posterior insula and superior temporal gyrus and its 2D representation of the corresponding t values on all SEEG contacts after projection. The contact with the maximum absolute t value (−6.8) was LHe 2 (green arrow). (C) A 2D representation of the SEEG findings. Contacts corresponding to the spike onset, spike maximum amplitude, and seizure core (largest epileptogenicity index) are marked in blue (LIa 1), orange (LHa 6), and red (LHe 2), respectively. The spatial overlap between fMRIp–SEEG and the seizure-onset zone (SOZ) was excellent (AUCSOZ = 0.95) whereas the spatial overlaps between fMRIp–SEEG and SOZ and between EMSIe–SEEG and PIZ and the SOZ were all poor (<0.70), specifically for AUCSOZ. The shortest distances between the fMRIp–SEEG contact showing maximum t value and the SEEG reference contact were obtained for the seizure core and the spike onset contacts (d = 0 mm and d = 10 mm, respectively). On the other hand, the distances between the EMSIe–SEEG maximum amplitude contact and the 3 SEEG reference contacts were large (>20 mm) with less localizing value. Here, EMSI captured epileptic activity already propagated from the spike onset and seizure core, which were deep generators, therefore resulting in poor evaluation metrics. Electrode LCa was aimed at the left anterior cingulate, LCp at the left posterior cingulate, LHa at the left anterior hippocampus, LHe at the left Heschl gyrus, LHp at the left posterior hippocampus, LIa at the left anterior insula, LIp at the left posterior insula, LM at the left primary motor area, LS at the left primary sensory motor area, LSMA at the left supplementary motor area, LSmi and LSms at the left supramarginal gyrus, and LpT at the left posterior temporal gyrus.
Figure 4. Example of a Case With Mesiotemporal Lobe Epilepsy, Presenting Good Spatial Overlaps Between ESMI Results and SEEG Findings (PIZ, SOZ).

Complete illustration is given in eFigure 8 (links.lww.com/WNL/B982). This patient underwent thermocoagulation of the left mesiotemporal structures. The patient is seizure-free at the last follow-up (>1 year). (A) Maximum of the EEG/magnetoencephalography source imaging (EMSI) consensus map (obtained using a cluster of n = 8 of 11 spikes source maps, localized on the left anterior temporal region) and its 2-dimensional (2D) representation on all stereo-EEG (SEEG) contacts after conversion into estimated SEEG signal (EMSIe–SEEG). The contact showing the maximum amplitude (in microvolts) in absolute value was LE 8 (black arrow). (B) Negative blood oxygen level–dependent cluster exhibiting the highest absolute t value on the left superior temporal sulcus and its 2D representation of the corresponding t values on all SEEG contacts after projection The contact with the maximum absolute t value (−6.1) was LFUa 7 (green arrow). (C) A 2D representation of the SEEG findings. Contact LHa 4 corresponded to both spike onset (blue) and spike maximum amplitude (orange) contacts. Contact showing the largest epileptogenicity index (seizure core) at the seizure-onset zone (SOZ) was identified in red (LE 4). The spatial overlaps between fMRIp–SEEG and primary irritative zone (PIZ) and SOZ were both poor (AUCPIZ and AUCSOZ <0.7). However, the spatial overlaps between EMSIe–SEEG and PIZ and SOZ were much better, specifically AUCSOZ = 0.75. The shortest distance between the EMSIe–SEEG and the SEEG reference contact was obtained for the spike maximum amplitude (d = 10 mm, same contact for the spike onset and spike maximum amplitude). Because AUCPIZ and AUCSOZ were <0.5 for fMRIp–SEEG, distances to the SEEG reference contacts were less clinically relevant. Electrode LA was aimed at the left amygdala, LCi at the left cuneus, LE at the left entorhinal, LFUa at the left anterior fusiform, LFUp at the left posterior fusiform, LHa at the left anterior hippocampus, LHp at the left posterior hippocampus, LIa at the left anterior insula, LIp at the left posterior insula, andLTp at the left temporal pole. ext = Extern; int = intern.
AUCPIZ and AUCSOZ were (mean ± SD) 0.71± 0.12 and 0.65± 0.15 for fMRIp–SEEG and 0.57 ± 0.21 and 0.62± 0.22 for fMRIp–SEEG. No statistical differences were found except for the EMSIe–SEEG, which was significantly larger than fMRIp–SEEG (p = 0.01). When EMSIe–SEEG and fMRIp–SEEG were combined, AUCPIZ and AUCSOZ were 0.58 ± 0.19 and 0.64 ± 0.22. AUCPIZ was significantly lower for the combined modalities than when EMSIe–SEEG alone was considered (p = 0.002). No statistical differences were found for the other measures.
Accuracy of EMSI and fMRI to Localize Spike Onset, Spike Maximum Amplitude, and Seizure Core
For EEG/MEG, the mean distances between EMSIe–SEEG maximum amplitude contact and spike onset, spike maximum amplitude, and seizure core SEEG channels were 24.9 ± 14.3, 20.7± 15.2, and 31.7 ± 19 mm, respectively. The distance between EMSIe–SEEG maximum amplitude contact and spike maximum amplitude was significantly smaller than distances to spike onset and seizure core channels (p = 0.04, p = 0.01); no statistical differences found for other distances.
For EEG/fMRI, the mean distances between fMRIp–SEEG maximum t value contact and spike onset, spike maximum amplitude, and seizure core SEEG channels were 25.3 ± 16.4, 30.1 ± 17.8, and 20.2 ± 15.4 mm, respectively; no statistical differences found between all distance measures.
Relationship Between Spatial Overlap and Distances
For EEG/MEG, significant linear relationships were found between AUCPIZ and distances to spike maximum amplitude and spike onset contacts (p < 0.001, R2 = 0.52; p = 0.02, R2 = 0.28, Figure 5). No significant linear relationship was found between AUCPIZ and distance to seizure core and between AUCSOZ and any distance measure.
Figure 5. Relationship Between the Spatial Overlap EMSI Results: PIZ and Distances to the Spike Onset, Maximum Spike Amplitude, and Seizure Core SEEG Reference Channels.

Linear regression analysis between AUCPIZ and distances to the spike maximum amplitude (A), spike onset (B), and seizure core (C) reference contacts. Significant linear relationships between AUCPIZ and distances were found for the spike maximum amplitude and spike onset but not for the seizure core. (D) Box plots with the median (black bars), interquartile range (color boxes), and extrema (dashed lines). Patients with good spatial overlap (AUCPIZ >0.7) presented significant shorter distances to the spike maximum amplitude channel (Mann-Whitney U test, p = 0.04) compared with patients for whom the spatial overlap was poor (AUCPIZ <0.7). No statistical differences were found between both groups when considering the distance to the spike onset and seizure core channels (p = 0.05 and p = 0.5, respectively). AUC = area under the receiver operating characteristic curve; EMSI = EEG/magnetoencephalography source imaging; PIZ = primary irritative zone; SEEG = stereo-EEG. *p < 0.05.
For EEG/fMRI, a significant linear relationship was found between AUCPIZ and distance to spike maximum amplitude channel (p = 0.04, R2 = 0.32). A significant linear relationship was also found between AUCSOZ and distances to spike onset and seizure core contacts (p = 0.02, R2 = 0.28; p < 0.001, R2 = 0.64, eFigure 9, links.lww.com/WNL/B982). No significant linear relationship was found between AUCPIZ and distances to seizure core and spike onset channels and between AUCSOZ and distance to spike maximum amplitude.
EMSIe–SEEG AUCPIZ was classified as good (AUC >0.7) in 10 of 18 studies (55%). Patients exhibiting good AUCPIZ had also significantly smaller distances to spike maximum amplitude channel (p = 0.04) than those with poor spatial overlap (Figure 5D). No significant statistical differences were found between both groups in terms of the distance between EMSIe–SEEG maximum amplitude contact and spike onset or seizure core channels. EMSIe–SEEG AUCSOZ was classified as good in 7 of 18 studies (39%). However, we found no statistical differences between both groups regarding distances to spike onset, spike maximum amplitude, and seizure core channels.
fMRIp–SEEG AUCPIZ was classified as good in 3 of 13 studies (23%). Patients exhibiting good AUCPIZ had also smaller distances to spike onset and spike maximum amplitude channels (p = 0.04, p = 0.01) than those with poor spatial overlap. No significant statistical difference was found between both groups in terms of distances to seizure core. fMRIp–SEEG AUCSOZ was classified as good in 5 of 13 studies (38%). Patients with good AUCSOZ had significantly smaller distances to spike onset (p = 0.01) and seizure core (p = 0.01) channels than those with poor spatial overlap (eFigure 9D, links.lww.com/WNL/B982). We found no significant statistical difference between both groups in the distance to spike maximum amplitude channel.
Comparison With Sublobar Concordance and Postsurgical Outcomes
EMSI was concordant with SOZ at a sublobar level in 13 of 17 (76%) patients (Figure 6). Among the 13 patients with significant statistical BOLD responses, the fMRI most significant cluster was concordant with SOZ at a sublobar level in 7 of 12 (58%) patients (maximum BOLD response not implanted for P12). Thirteen patients were operated on, and 2 had thermocoagulation procedures during SEEG; 5 of 15 (33%) were seizure-free during the last follow-up (mean follow-up duration 3 years). EMSI demonstrated better sensitivity, specificity, positive predictive value, and negative predictive value (60%, 90%, 75%, 82%, respectively) than EEG/fMRI (40%, 67%, 50%, 57%, respectively). EMSI correctly predicted outcome in 12 of 15 patients, which led to 80% accuracy, whereas EEG/fMRI correctly predicted outcome in 6 of 11 patients, resulting in 54% accuracy.
Figure 6. Comparison Between Quantitative Metrics and Qualitative Sublobar Concordance With Respect to Postsurgical Outcomes.
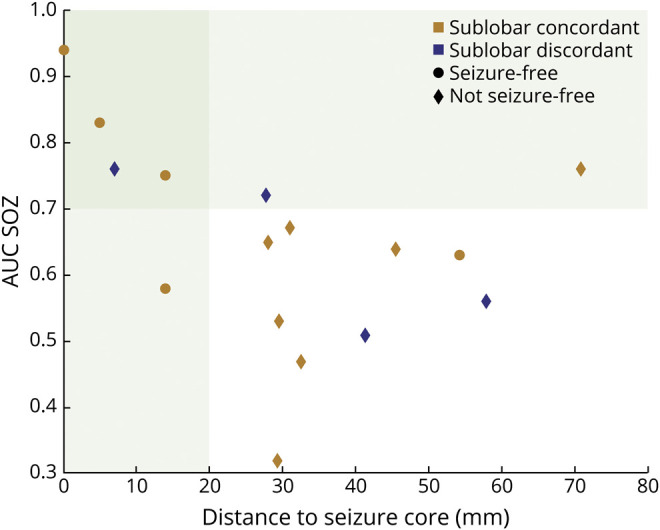
Each dot represents a study. AUC = area under the receiver operating characteristic curve; EMSI = EEG/magnetoencephalography source imaging; SOZ = seizure-onset zone.
Discussion
We assessed the spatial concordance between EEG/MEG, EEG/fMRI, and SEEG by using a unique objective and quantitative approach consisting of converting EMSI from spikes into SEEG electric potentials and projecting fMRI cluster on the SEEG channel-space. Our results highlight the clinical relevance of both EEG/MEG and EEG/fMRI in quantitatively mapping the PIZ and SOZ. EEG/MEG more accurately localized epileptic discharges with higher amplitude (spike maximum amplitude), whereas EEG/fMRI was more sensitive to the spike onset and seizure core channels.
As opposed to most of source localization algorithms, we used cMEM, as a method sensitive to the spatial extent of the underlying generator,16,28-30 to measure spatial overlap with SEEG. Moreover, our comparison was completed after assessing EMSI and fMRI results in the same SEEG space.33 In addition, we assessed localization accuracy considering several SEEG biomarkers, i.e., the spike onset, spike maximum amplitude, and seizure core SEEG contacts. Combination of spatial overlap and distance metrics allowed complete quantitative analysis considering not only the localization accuracy but also the spatial extent of the results, which are important for surgery.
Our results are in agreement with previous studies that have investigated the concordance between EEG/MEG source localization and intracranial data3,4,6,13,15,35 and between EEG/fMRI and intracranial findings.7,8,18,36 Our results suggest that EMSI and EEG/fMRI are able to localize the SOZ from spikes because regions responsible for spikes often spatially overlap with the SOZ.4,8,9,13,15 Most studies reported either a qualitative lobar/sublobar level accuracy in EEG/MEG4,11,12,35 or a semiquantitative analysis, consisting mainly of measuring distances between specific points, not taking into account spatial extents, in EMSI6,16,37 or EEG/fMRI.7,8,18,36,38 We believe that such comparisons would lead to overestimation of the reported rates of concordance between EMSI (or EEG/fMRI) and SEEG results (>80%).4,7,8,11,12,35,36,38 In fact, qualitative evaluation is an oversimplified approach, and the semiquantitative approach might not be well suited to epileptic discharges, which are generated by rather extended areas.39 In our study, when we considered these standard qualitative or semiquantitative approaches, EMSI was concordant with PIZ at a sublobar level in 76% of them. With SOZ, the sublobar EMSI rate of concordance was 76%. However, with rigorous SEEG validation criteria (good spatial overlap AUC >0.7), AUCPIZ and AUCSOZ were good in only 9 of 17 (53%) and 7 of 17 (41%) patients, respectively. Our results show that quantitative approaches are essential in the assessment of multimodal concordance and clinical relevance of EMSI and EEG/fMRI, whereas a qualitative sublobar level analysis would not be sufficient to predict accurately the postsurgical outcomes.
Few other EEG/MEG studies considered source imaging methods able to recover the spatial extent of the sources.13,15,29 Jung et al.13 found in all patients a good congruence between MSI and the SOZ determined by SEEG. However, contrary to our study, those authors did not consider all SEEG contacts involved in the SOZ.13 Sohrabpour et al.15 considered spatial overlap metrics with the volume of resection only, not with intracranial findings, therefore overestimating the true SOZ spatial extent because the resected area is always larger than the SOZ. Our group previously reported analyses assessing the spatial extent of EEG/MEG sources but with more qualitative definitions of the SOZ.6,16,22,29 From a clinical point of view, our lower rate of good spatial concordance between EMSIe–SEEG and SOZ seems more realistic in complex drug-resistant cases than the higher rates reported in the literature, especially when EMSI accuracy to predict postsurgical outcomes was only 50%.4
EMSIe–SEEG–estimated potentials exhibited a better AUCPIZ than fMRIp–SEEG–estimated potentials. This might be explained by 3 main reasons. (1) Like SEEG, EEG/MEG is a direct measure of neurophysiologic activities (electric and magnetic fields) associated with the summation of synchronized postsynaptic potentials at a millisecond scale, while fMRI signals are sensitive mainly to local oxygen consumption and blood flow changes elicited within the whole brain at the time of spikes (second scale). This fundamental difference suggests that EEG/MEG explores spikes at the time they occur, whereas fMRI localizes not only the onset and the early propagated activity but also other associated regions.9,34,36 (2) Although it is known that fMRI investigations often include several hemodynamic responses,9 we considered only the most significant cluster because several studies demonstrated good concordance between the most significant hemodynamic response and the EZ.5,8,9 However, this most significant fMRI cluster in P17 was a deactivation on the superior temporal sulcus, whereas the next significant cluster, consisting of an activation in the mesiotemporal structures, would lead to better spatial overlap with SEEG findings (Figure 10, links.lww.com/WNL/B982). This raises questions about what to consider the most significant cluster in such a situation. (3) The 10-mm-radius sphere considered when the fMRI cluster was projected on SEEG channels might underestimate part of the BOLD response because hemodynamic responses are often spatially extended.38,40 However, the spatial coverage of a SEEG contact is typically 10 mm,41 and simultaneous intracranial EEG/fMRI studies have reported hemodynamic responses within 10 mm from the active intracranial contact.36,38 Our overall finding that EMSI localized more accurately the PIZ than EEG/fMRI agrees with the literature.23,42,43 However, contrary to our study, results reported elsewhere42,43 were not validated against intracranial data, and in the other study23 the authors evaluated the concordance only at a sublobar level.
The combination of EMSIe–SEEG and fMRIp–SEEG did not improve the spatial overlap with SEEG findings, in agreement with a recent study by Rossi Sebastiano et al.23 However, other studies reported opposite results.24,42 Berger et al.24 considered as positive the union between EEG/fMRI and MSI results, which is less clinically relevant than the intersection proposed in our study. Although Centeno et al.42 considered the intersection between EEG/fMRI and ESI, their definition remained less restrictive because the concordance was evaluated at a sublobar level.
To further analyze the PIZ, the brain area where spikes are generated by heterogeneous neuronal populations,44 we proposed spike onset and spike maximum amplitude as good SEEG biomarkers.45,46 Spike onset allows differentiation of the region triggering the spikes from early propagation patterns,45 whereas spike maximum amplitude reflects an extended synchronized region that is likely to be visible on scalp recordings. As for the SOZ, we considered the seizure core within the epileptic network because channels involved in the SOZ exhibit the largest epileptogenicity indices.25
An important point is that we found that for patients exhibiting good spatial overlap with PIZ/SOZ (AUC >0.7), EMSI localized more accurately spike maximum amplitude and spike onset, whereas EEG/fMRI localized more accurately seizure core and spike onset channels. It is indeed known that spikes become visible on the scalp when generators are sufficiently spatially extended along the cortical surface.39,47,48 Therefore, in most cases, visible scalp spikes are already propagated, either around the onset area or even to more distant areas. Because of its excellent temporal resolution, EMSI seems robust to localize the onset and fast-propagated areas. In addition, because of its high SNR, spike maximum amplitude is the most suitable to localize accurately. The fact that EEG/fMRI better localized spike onset channel confirms the recent study by Khoo et al.,7 demonstrating that the most significant hemodynamic response localized the spike onset zone. We found that the maximum hemodynamic response also accurately localized the seizure core, which is in line with the fact that spike-onset and SOZ often overlap and require higher oxygen consumption.7,45
Our reported rate of seizure-free patients (33%) agrees with a large retrospective SEEG study reporting favorable surgical outcome in 59%, including 35% who became Engel Ia.49 Another remarkable finding from our study is that EMSI provided better accuracy than EEG/fMRI when predicting postsurgical outcome. Compared to our conservative reference, we also found similar results when considering the surgical cavity as reference (eTable 3, links.lww.com/WNL/B982).
Our results, in agreement with those reported by Centeno et al.,42 are driven mainly by large EMSI negative predictive value (82%) and specificity (90%).
SEEG implantation was not blinded to some of our EEG/MEG and/or EEG/fMRI results. However, we do not consider this condition a bias. Indeed, a good spatial coverage of the presumed epileptic regions is necessary for comparison. Moreover, finding epileptic activity within these suspected regions further confirms the clinical value of EMSI and EEG/fMRI.
Our study was limited by the small sample size and its retrospective design. It should also be noted that in our institution EEG/MEG and EEG/fMRI are usually considered only in the most complex cases. A large prospective study including all the consecutive candidates for a presurgical investigation would be necessary to generalize our findings.
Furthermore, the intrinsic limited spatial sampling of SEEG suggests that the exact spatial extent of SOZ and PIZ might be underestimated. However, most patients with good EMSIe–SEEG AUCSOZ and short distance to seizure core had good surgical outcome. Besides, neuropathology found epileptogenic lesions in 77% of operated patients. These 2 points constitute arguments in favor of a localized SOZ.
Finally, comparing SEEG with scalp-EEG/MEG, EEG/fMRI data recorded in different sessions introduced bias because we cannot be sure that the scalp spikes correspond exactly to those considered in SEEG recordings. The ideal situation would have been to record all these modalities simultaneously, which was not feasible. Although the duration of the selected recordings might not be long enough to capture underlying spikes variability,50 analysis of all different spikes types was out of scope for this study.
Our quantitative study confirmed that EEG/MEG and EEG/fMRI are noninvasive investigations that spatially overlap with the PIZ and SOZ defined by SEEG. Therefore, our approach could be used to increase the clinical yield of EEG/MEG and EEG/fMRI in the presurgical workup of patients with focal drug-resistant epilepsy and would be suitable in a large prospective study.
Glossary
- AUC
area under the receiver operating characteristic curve
- BOLD
blood oxygen level–dependent
- cMEM
coherent maximum entropy on the mean
- EMSI
EEG/MEG source imaging
- EZ
epileptogenic zone
- MEG
magnetoencephalography
- MSI
magnetic source imaging
- PIZ
primary irritative zone
- SEEG
stereo-EEG
- SNR
signal to noise ratio
- SOZ
seizure-onset zone
Appendix. Authors

Study Funding
This work was supported by a Natural Sciences and Engineering Research Council of Canada Discovery grant, grants from Canadian Institutes of Health Research (PJT-159948, MOP-133619, and MOP-93614), Centres of Excellence for Commercialization and Research (McGill University), American Epilepsy Society Early Career Physician-Scientist award, the Fonds de recherche du Québec–Nature et technologies (FRQNT) Research team grant, and Savoy Foundation Studentship.
Disclosure
The authors report no disclosures relevant to the manuscript. Go to Neurology.org/N for full disclosures.
References
- 1.Spencer S, Huh L. Outcomes of Epilepsy Surgery in Adults and Children. Vol 7. Elsevier; 2008:525-537. [DOI] [PubMed] [Google Scholar]
- 2.McGonigal A, Bartolomei F, Régis J, et al. Stereoelectroencephalography in presurgical assessment of MRI-negative epilepsy. Brain. 2007;130(12):3169-3183. [DOI] [PubMed] [Google Scholar]
- 3.Murakami H, Wang ZI, Marashly A, et al. Correlating magnetoencephalography to stereo-electroencephalography in patients undergoing epilepsy surgery. Brain. 2016;139(11):2935-2947. [DOI] [PMC free article] [PubMed] [Google Scholar]
- 4.Duez L, Tankisi H, Hansen PO, et al. Electromagnetic source imaging in presurgical workup of patients with epilepsy: a prospective study. Neurology. 2019;92(6):e576-e586. [DOI] [PMC free article] [PubMed] [Google Scholar]
- 5.Pittau F, Dubeau F, Gotman J. Contribution of EEG/fMRI to the definition of the epileptic focus. Neurology. 2012;78(19):1479-1487. [DOI] [PMC free article] [PubMed] [Google Scholar]
- 6.Pellegrino G, Hedrich T, Chowdhury RA, et al. Clinical yield of magnetoencephalography distributed source imaging in epilepsy: a comparison with equivalent current dipole method. Hum Brain Mapp. 2018;39(1):218-231. [DOI] [PMC free article] [PubMed] [Google Scholar]
- 7.Khoo HM, Von Ellenrieder N, Zazubovits N, He D, Dubeau F, Gotman J. The spike onset zone. Neurology. 2018;91(7):e666-e674. [DOI] [PMC free article] [PubMed] [Google Scholar]
- 8.Khoo HM, Hao Y, von Ellenrieder N, et al. The hemodynamic response to interictal epileptic discharges localizes the seizure-onset zone. Epilepsia. 2017;58(5):811-823. [DOI] [PubMed] [Google Scholar]
- 9.Heers M, Hedrich T, An D, et al. Spatial correlation of hemodynamic changes related to interictal epileptic discharges with electric and magnetic source imaging. Hum Brain Mapp. 2014;35(9):4396-4414. [DOI] [PMC free article] [PubMed] [Google Scholar]
- 10.An D, Fahoum F, Hall J, et al. Electroencephalography/functional magnetic resonance imaging responses help predict surgical outcome in focal epilepsy full-length original research. Epilepsia. 2013;54(12):2184-2194. [DOI] [PMC free article] [PubMed] [Google Scholar]
- 11.Knowlton RC, Elgavish R, Howell J, et al. Magnetic source imaging versus intracranial electroencephalogram in epilepsy surgery: a prospective study. Ann Neurol. 2006;59(5):835-842. [DOI] [PubMed] [Google Scholar]
- 12.Knowlton RC, Elgavish RA, Limdi N, et al. Functional imaging, I: relative predictive value of intracranial electroencephalography. Ann Neurol. 2008;64(1):25-34. [DOI] [PubMed] [Google Scholar]
- 13.Jung J, Bouet R, Delpuech C, et al. The value of magnetoencephalography for seizure-onset zone localization in magnetic resonance imaging-negative partial epilepsy. Brain. 2013;136(10):3176-3186. [DOI] [PMC free article] [PubMed] [Google Scholar]
- 14.Plummer C, Vogrin SJ, Woods WP, Murphy MA, Cook MJ, Liley DTJ. Interictal and ictal source localization for epilepsy surgery using high-density EEG with MEG: a prospective long-term study. Brain. 2019;142(4):932-951. [DOI] [PMC free article] [PubMed] [Google Scholar]
- 15.Sohrabpour A, Cai Z, Ye S, Brinkmann B, Worrell G, He B. Noninvasive electromagnetic source imaging of spatiotemporally distributed epileptogenic brain sources. Nat Commun. 2020;11(1):1946. [DOI] [PMC free article] [PubMed] [Google Scholar]
- 16.Pellegrino G, Hedrich T, Porras-Bettancourt M, et al. Accuracy and spatial properties of distributed magnetic source imaging techniques in the investigation of focal epilepsy patients. Hum Brain Mapp. 2020;41(11):3019-3033. [DOI] [PMC free article] [PubMed] [Google Scholar]
- 17.Agirre-Arrizubieta Z, Huiskamp GJM, Ferrier CH, Van Huffelen AC, Leijten FSS. Interictal magnetoencephalography and the irritative zone in the electrocorticogram. Brain. 2009;132(11):3060-3071. [DOI] [PubMed] [Google Scholar]
- 18.van Houdt PJ, de Munck JC, Leijten FSS, et al. EEG-fMRI correlation patterns in the presurgical evaluation of focal epilepsy: a comparison with electrocorticographic data and surgical outcome measures. Neuroimage. 2013;75:238-248. [DOI] [PubMed] [Google Scholar]
- 19.Frauscher B, Dubeau F. Physiological activity and artefacts in the human epileptic brain studied with intracerebral depth electrode EEG. In: Lhatoo SD, Kahane P, Lüders HO, eds. Invasive Studies of the Human Epileptic Brain: Principles and Practice. Oxford Medicine; 2018. [Google Scholar]
- 20.Gonzalez-Martinez J, Bulacio J, Alexopoulos A, Jehi L, Bingaman W, Najm I. Stereoelectroencephalography in the “difficult to localize” refractory focal epilepsy: early experience from a North American epilepsy center. Epilepsia. 2013;54(2):323-330. [DOI] [PubMed] [Google Scholar]
- 21.Chowdhury RA, Zerouali Y, Hedrich T, et al. MEG–EEG information fusion and electromagnetic source imaging: from theory to clinical application in epilepsy. Brain Topogr. 2015;28(6):785-812. [DOI] [PMC free article] [PubMed] [Google Scholar]
- 22.Chowdhury RA, Pellegrino G, Aydin Ü, et al. Reproducibility of EEG-MEG fusion source analysis of interictal spikes: relevance in presurgical evaluation of epilepsy. Hum Brain Mapp. 2018;39(2):880-901. [DOI] [PMC free article] [PubMed] [Google Scholar]
- 23.Rossi Sebastiano D, Tassi L, Duran D, et al. Identifying the epileptogenic zone by four non-invasive imaging techniques versus stereo-EEG in MRI-negative pre-surgery epilepsy patients. Clin Neurophysiol. 2020;131(8):1815-1823. [DOI] [PubMed] [Google Scholar]
- 24.Berger A, Cohen N, Fahoum F, et al. Preoperative localization of seizure onset zones by magnetic source imaging, EEG-correlated functional MRI, and their combination. J Neurosurg. 2020;15:1-7. [DOI] [PubMed] [Google Scholar]
- 25.David O, Blauwblomme T, Job AS, et al. Imaging the seizure onset zone with stereo-electroencephalography. Brain. 2011;134(10):2898-2911. [DOI] [PubMed] [Google Scholar]
- 26.Worsley KJ, Liao CH, Aston J, et al. A general statistical analysis for fMRI data. Neuroimage. 2002;15(1):1-15. [DOI] [PubMed] [Google Scholar]
- 27.Bagshaw AP, Aghakhani Y, Bénar CG, et al. EEG-fMRI of focal epileptic spikes: analysis with multiple haemodynamic functions and comparison with gadolinium-enhanced MR angiograms. Hum Brain Mapp. 2004;22(3):179-192. [DOI] [PMC free article] [PubMed] [Google Scholar]
- 28.Chowdhury RA, Lina JM, Kobayashi E, Grova C. MEG source localization of spatially extended generators of epileptic activity: comparing entropic and hierarchical bayesian approaches. PLoS One. 2013;8(2):e55969. [DOI] [PMC free article] [PubMed] [Google Scholar]
- 29.Chowdhury RA, Merlet I, Birot G, et al. Complex patterns of spatially extended generators of epileptic activity: comparison of source localization methods cMEM and 4-ExSo-MUSIC on high resolution EEG and MEG data. Neuroimage. 2016;143:175-195. [DOI] [PubMed] [Google Scholar]
- 30.Hedrich T, Pellegrino G, Kobayashi E, Lina JM, Grova C. Comparison of the spatial resolution of source imaging techniques in high-density EEG and MEG. Neuroimage. 2017;157:531-544. [DOI] [PubMed] [Google Scholar]
- 31.Aydin Ü, Pellegrino G, Ali OBKb, et al. Magnetoencephalography resting state connectivity patterns as indicatives of surgical outcome in epilepsy patients. J Neural Eng. 2020;17(3):035007. [DOI] [PubMed] [Google Scholar]
- 32.Alarcon G, Guy CN, Binnie CD, Walker SR, Elwes RDC, Polkey CE. Intracerebral propagation of interictal activity in partial epilepsy: implications for source localisation. J Neurol Neurosurg Psychiatry. 1994;57(4):435-449. [DOI] [PMC free article] [PubMed] [Google Scholar]
- 33.Grova C, Aiguabella M, Zelmann R, Lina JM, Hall JA, Kobayashi E. Intracranial EEG potentials estimated from MEG sources: a new approach to correlate MEG and iEEG data in epilepsy. Hum Brain Mapp. 2016;37(5):1661-1683. [DOI] [PMC free article] [PubMed] [Google Scholar]
- 34.Grova C, Daunizeau J, Kobayashi E, et al. Concordance between distributed EEG source localization and simultaneous EEG-fMRI studies of epileptic spikes. Neuroimage. 2008;39(2):755-774. [DOI] [PMC free article] [PubMed] [Google Scholar]
- 35.Abdallah C, Maillard LG, Rikir E, et al. Localizing value of electrical source imaging: frontal lobe, malformations of cortical development and negative MRI related epilepsies are the best candidates. Neuroimage Clin. 2017;16:319-329. [DOI] [PMC free article] [PubMed] [Google Scholar]
- 36.Vulliemoz S, Carmichael DW, Rosenkranz K, et al. Simultaneous intracranial EEG and fMRI of interictal epileptic discharges in humans. Neuroimage. 2011;54(1):182-190. [DOI] [PubMed] [Google Scholar]
- 37.Bénar CG, Grova C, Kobayashi E, et al. EEG-fMRI of epileptic spikes: concordance with EEG source localization and intracranial EEG. Neuroimage. 2006;30(4):1161-1170. [DOI] [PubMed] [Google Scholar]
- 38.Aghakhani Y, Beers CA, Pittman DJ, Gaxiola-Valdez I, Goodyear BG, Federico P. Co-localization between the BOLD response and epileptiform discharges recorded by simultaneous intracranial EEG-fMRI at 3 T. Neuroimage Clin. 2015;7:755-763. [DOI] [PMC free article] [PubMed] [Google Scholar]
- 39.Tao JX, Ray A, Hawes-Ebersole S, Ebersole JS. Intracranial EEG substrates of scalp EEG interictal spikes. Epilepsia. 2005;46(5):669-676. [DOI] [PubMed] [Google Scholar]
- 40.Kobayashi E, Bagshaw AP, Bénar CG, et al. Temporal and extratemporal BOLD responses to temporal lobe interictal spikes. Epilepsia. 2006;47(2):343-354. [DOI] [PubMed] [Google Scholar]
- 41.Lachaux JP, Rudrauf D, Kahane P. Intracranial EEG and human brain mapping. J Physiol Paris. 2003;97:613-628. [DOI] [PubMed] [Google Scholar]
- 42.Centeno M, Tierney TM, Perani S, et al. Combined electroencephalography–functional magnetic resonance imaging and electrical source imaging improves localization of pediatric focal epilepsy. Ann Neurol. 2017;82(2):278-287 [DOI] [PubMed] [Google Scholar]
- 43.Urriola J, Bollmann S, Tremayne F, Burianová H, Marstaller L, Reutens D. Functional connectivity of the irritative zone identified by electrical source imaging, and EEG-correlated fMRI analyses. Neuroimage Clin. 2020;28:102440. [DOI] [PMC free article] [PubMed] [Google Scholar]
- 44.Rosenow F, Lüders H. Presurgical evaluation of epilepsy. Brain. 2001;124(9):1683-1700. [DOI] [PubMed] [Google Scholar]
- 45.Hufnagel A, Dümpelmann M, Zentner J, Schijns O, Elger CE. Clinical relevance of quantified intracranial interictal spike activity in presurgical evaluation of epilepsy. Epilepsia. 2000;41(4):467-478. [DOI] [PubMed] [Google Scholar]
- 46.Asano E, Muzik O, Shah A, et al. Quantitative Interictal Subdural EEG Analyses in Children with Neocortical Epilepsy, Vol 44. Epilepsia; 2003. [DOI] [PubMed] [Google Scholar]
- 47.Koessler L, Cecchin T, Colnat-Coulbois S, et al. Catching the invisible: mesial temporal source contribution to simultaneous EEG and SEEG recordings. Brain Topogr. 2014;28(1):5-20. [DOI] [PubMed] [Google Scholar]
- 48.Ray A, Tao JX, Hawes-Ebersole SM, Ebersole JS. Localizing value of scalp EEG spikes: a simultaneous scalp and intracranial study. Clin Neurophysiol. 2007;118(1):69-79. [DOI] [PubMed] [Google Scholar]
- 49.Cardinale F, Rizzi M, Vignati E, et al. Stereoelectroencephalography: retrospective analysis of 742 procedures in a single centre. Brain. 2019;142(9):2688-2704. [DOI] [PubMed] [Google Scholar]
- 50.Conrad EC, Tomlinson SB, Wong JN, et al. Spatial distribution of interictal spikes fluctuates over time and localizes seizure onset. Brain. 2020;143(2):554-569. [DOI] [PMC free article] [PubMed] [Google Scholar]
Associated Data
This section collects any data citations, data availability statements, or supplementary materials included in this article.
Data Availability Statement
Data are available on reasonable request.