Abstract
Objective:
To develop and evaluate deep learning (DL) risk assessment models for predicting pain progression in subjects with or at risk for knee osteoarthritis (OA).
Materials and Methods:
The incidence and progression cohorts of the Osteoarthritis Initiative, a multi-center longitudinal study involving 9348 knees in 4674 subjects with of at risk for knee OA that began in 2004 and is ongoing, was used to conduct this retrospective analysis. A subset of knees without and with pain progression (defined as nine point or greater increase in pain score between baseline and two or more follow-up time over the first 48-months) were randomly stratified into training (4200 knees with mean age of 61.0 years and 60% female) and hold-out testing (500 knees with mean age of 60.8 years and 60% female) datasets. A DL model was developed to predict pain progression using baseline knee radiographs. An artificial neural network was used to develop a traditional risk assessment model to predict pain progression using demographic, clinical, and radiographic risk factors. A combined model was developed to combine demographic, clinical, and radiographic risk factors with DL analysis of baseline knee radiographs. Area under the curve (AUC) analysis was performed using the hold-out testing dataset to evaluate model performance.
Results:
The traditional model had an AUC of 0.692 (66.9% sensitivity and 64.1% specificity). The DL model had an AUC of 0.770 (76.7% sensitivity and 70.5% specificity), which was significantly higher (p<0.001) than the traditional model. The combined model had an AUC of 0.807 (72.3% sensitivity and 80.9% specificity), which was significantly higher (p<0.05) than the traditional and DL models.
Conclusions:
DL models using baseline knee radiographs had higher diagnostic performance for predicting pain progression than traditional models using demographic, clinical, and radiographic risk factors.
Keywords: Osteoarthritis, Deep Learning, Radiographs, Risk Assessment Models
INTRODUCTION
Osteoarthritis (OA) is one of the most prevalent and disabling chronic diseases, with the knee being the joint most commonly affected [1]. Pain is the hallmark of knee OA and is the symptom that drives patients to seek medical attention and contributes to the reduced quality of life [2]. Developing risk assessment models for predicting pain progression in patients with knee OA could potentially improve the likelihood of successful treatment during the early stages of the disease before chronic nervous system sensitization to pain has evolved [3]. Heightening risk appraisals can influence intentions and behaviors [4] and thus may motivate patients with knee OA at high risk for pain progression to adhere to beneficial lifestyle modifications including weight loss and physical activity [5]. In addition, identifying patients with knee OA at high risk for pain progression could help triage referrals for more expensive and invasive treatment options such as corticosteroid and hyaluronic acid injections [6], genicular nerve ablation [7], and surgical correction of mechanical malalignment [8], thereby improving patient outcomes while reducing health care costs.
The etiology of pain in patients with knee OA is complex and multi-factorial [2]. Discordance between knee pain and structural knee pathology has been widely noted with relatively weak correlations between the radiographic severity of OA and the presence and severity of pain, especially during the early stages of radiographic disease [9–11]. However, risk factors for pain progression have been identified including older age [12–14], female gender [13, 15], non-Caucasian race [15, 16], higher body mass index (BMI) [12–14], increased knee pain [13, 14], and advanced radiographic disease [15, 17]. Nevertheless, risk assessment models for predicting pain progression in patients with knee OA have remained relatively limited. Current risk assessment models have primarily used demographic, clinical, and radiographic risk factors [18, 19] or detailed analysis of magnetic resonance imaging (MRI) examinations [20, 21]. Thus, new and improved strategies are needed to create widespread, cost-effective, and easily acquired risk assessment models for predicting pain progression in patients with knee OA.
Deep learning (DL) is an advanced form of artificial intelligence that has been successfully used for various medical imaging applications [22]. DL could provide a new approach for developing OA risk assessment models to predict pain progression through rapid and fully-automated extraction of useful prognostic information from imaging studies. DL could potentially learn a representative subset of features on baseline imaging studies in patients with knee OA that could distinguish between individuals without and with pain progression over time. Previous studies have demonstrated the feasibility of using DL analysis of baseline radiographs and MRI examinations in risk assessment models to predict the presence of knee pain [23], radiographic progression of knee OA [24, 25], and subsequent total knee arthroplasty [26, 27]. Our study was performed to develop and evaluate DL risk assessment models for predicting pain progression in subjects with or at risk for knee OA using baseline knee radiographs. We hypothesize that DL models would have higher diagnostic performance for predicting pain progression than traditional models using demographic, clinical, and radiographic risk factors.
METHODS
Selection Criteria
Knees eligible to be included in this retrospective analysis were selected from subjects in the Osteoarthritis Initiative (OAI). The OAI is a multi-center longitudinal study that began in 2004 and is ongoing and that collected demographic, clinical, and imaging data over a nine-year follow-up period on 4674 men and women between the ages of 45 and 79 years [28]. Knees were selected from both the incidence cohort of 3285 subjects without knee OA but with risk factors for OA incidence (knee pain, elevated BMI, prior knee injury or surgery, family history of OA, Heberden’s nodes, repetitive knee bending, and over 70 years of age) and the progression cohort of 1389 subjects with knee OA. The OAI was approved by the Internal Review Boards at University of California at San Francisco and at each individual clinical recruitment site and was performed in compliance with the Health Insurance Portability and Accountability Act (HIPAA) and with all subjects signing written informed consent.
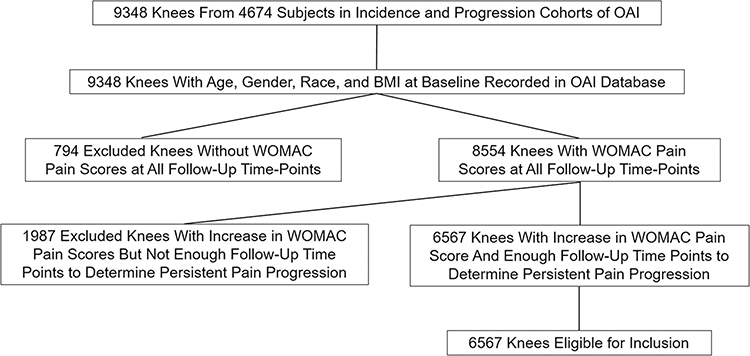
Imaging and clinical data was collected on both knees of the 4674 subjects in the OAI incidence and progression cohorts. The 9348 knees in the OAI database were eligible to be included in the study if they had the following information recorded: 1) age, gender, race, and BMI at baseline; 2) grade of knee OA at baseline according to the Kellgren-Lawrence (KL) system [29] provided by central reading using bilateral standing posterior-anterior knee radiographs; and 3) Western Ontario and McMaster Universities Osteoarthritis Index (WOMAC) pain scores normalized to a 0 to 100 scale [30] at baseline and 12-month, 24-month, 36-month, and 48-month follow-up, with sufficient data available to determine the presence or absence of persistent pain progression. Six thousand five hundred sixty-seven knees of the total 9348 knees in the OAI database met the above-mentioned criteria and were thus eligible for inclusion. Both knees from the same subject were eligible to be included in the study if they met the inclusion criteria, with each knee independently assessed for the presence or absence of persistent pain progression. Figure 1 summarizes the selection of eligible knees.
Figure 1:
Flowchart showing the selection of eligible knees for the study.
Outcome Measure for OA Risk Assessment Models
The outcome measure for the OA risk assessment models was persistent pain progression, which was defined according to the Foundation of the National Institute of Health OA Biomarker Consortium Project as a nine point or greater increase in WOMAC pain score between baseline and two or more follow-up time over the first 48-months points [31]. The nine point or greater increase in WOMAC pain score was based upon the literature for a minimum clinically important difference for pain worsening [32]. Persistent pain progression required an increase in WOMAC pain score above the threshold level at two or more follow-up time points as pain in patients with knee OA may fluctuate over time. Knees were excluded due to insufficient data if WOMAC pain scores were not recorded in the OAI database at all follow-up time points or if there were not enough follow-up time points after the first increase in WOMAC pain score above the threshold level to determine if the pain progression was persistent.
OA Risk Assessment Models
Traditional Risk Assessment Models
Traditional OA risk assessment models were developed using three alternative approaches including Random forest, logistic regression, and an artificial neural network (ANN). The ANN model had the same architecture as OA risk assessment models used in previous studies that had high diagnostic performance and consisted of four layers including an input layer, two hidden layers with 64 and 32 hidden nodes, and an output layer [25, 33]. The inputs of the traditional risk assessment models consisted of six demographic, clinical, and radiographic risk factors including baseline age, gender, race, BMI, WOMAC pain score, and KL grade, with continuous variable normalized by means and standard deviations.
DL Risk Assessment Models
The DL risk assessment models were fully-automated processing pipelines consisting of two deep convolutional neural networks (CNNs) connected in a cascaded fashion. The first joint cropping CNN was used to crop regions of interest around each individual knee joint on the baseline bilateral standing posterior-anterior knee radiographs to narrow the range of information used for DL analysis. The second classification CNN was used to evaluate the cropped images of the knee to determine the likelihood of pain progression. The processing pipeline framework was implemented in a hybrid computing environment involving Python (version 3.7, Python Software Foundation, Wilmington, DE) and MATLAB (version 2019a, MathWorks, Natick, MA). The CNNs were coded using TensorFlow (version 1.12, Google, Mountain View, CA).
The first fully-automated joint cropping CNN was adapted from You Only Look Once (YOLO) [34], which consisted of 24 convolutional layers followed by an average pooling layer. The input of the CNN was the baseline knee radiographs in DICOM format, which were resized to 448×448 matrix, normalized by means and standard deviations with respect to images in the ImageNet training dataset [35], and converted to Numpy arrays. The CNN was used to extract image features to provide the coordinates of two square boxes that defined the regions of each individual knee joint on the radiographs. The pre-defined square boxes were doubled in area to correct for potential errors in the localization process and superimposed over the original DICOM X-ray images with full matrix size. Cropped images of each knee joint were extracted, downsized to 224×224 matrix size, and used as the input to the classification CNN layer [25].
DL models were developed using two alternative classification CNNs. One CNN was adapted from DenseNet [36], which consisted of three dense blocks with each block connected by a convolutional layer and a maxpooling layer. The second CNN was adapted from EfficientNet [37], which consisted of six MBConv blocks and one SpeCov block. The MBConv block was comprised of a convolutional block connected by a list of convolution layers, a depthwise convolution layer, and a maxpooling layer. The SpeConv block was comprised of a convolution layer followed by a depthwise convolution layer. In both CNNs, the last block was connected to an average pooling layer, which was followed by a Softmax output layer. Since saliency maps have been used for visualization in many recent DL applications for creating OA risk assessment models [23–27], the average pooling layer was modified using a gradient back-propagation method to calculate saliency maps that showed the regions of discriminative high activation on the radiographs on which the classification CNN based its interpretation.
Combined Traditional and DL Risk Assessment Model
A combined model using joint training was developed to combine demographic, clinical, and radiographic risk factors with DL analysis of baseline knee radiographs. The feature extractor of risk factors was a two layer fully-connected network with the data normalized by means and standard deviations and used as the input into a six-dimensional fully connected layer. The feature extractor of DL analysis of baseline knee radiographs had the same architecture as the DL model with the highest diagnostic performance. The output of the feature extractor of risk factors and the feature extractor of DL analysis of baseline knee radiographs were combined as a new vector and then used as the input into another fully-connected network for joint model training. The CNNs and fully-connected layers were connected in a cascaded fashion to create a fully-automated processing pipeline as shown in Figure 2.
Figure 2:
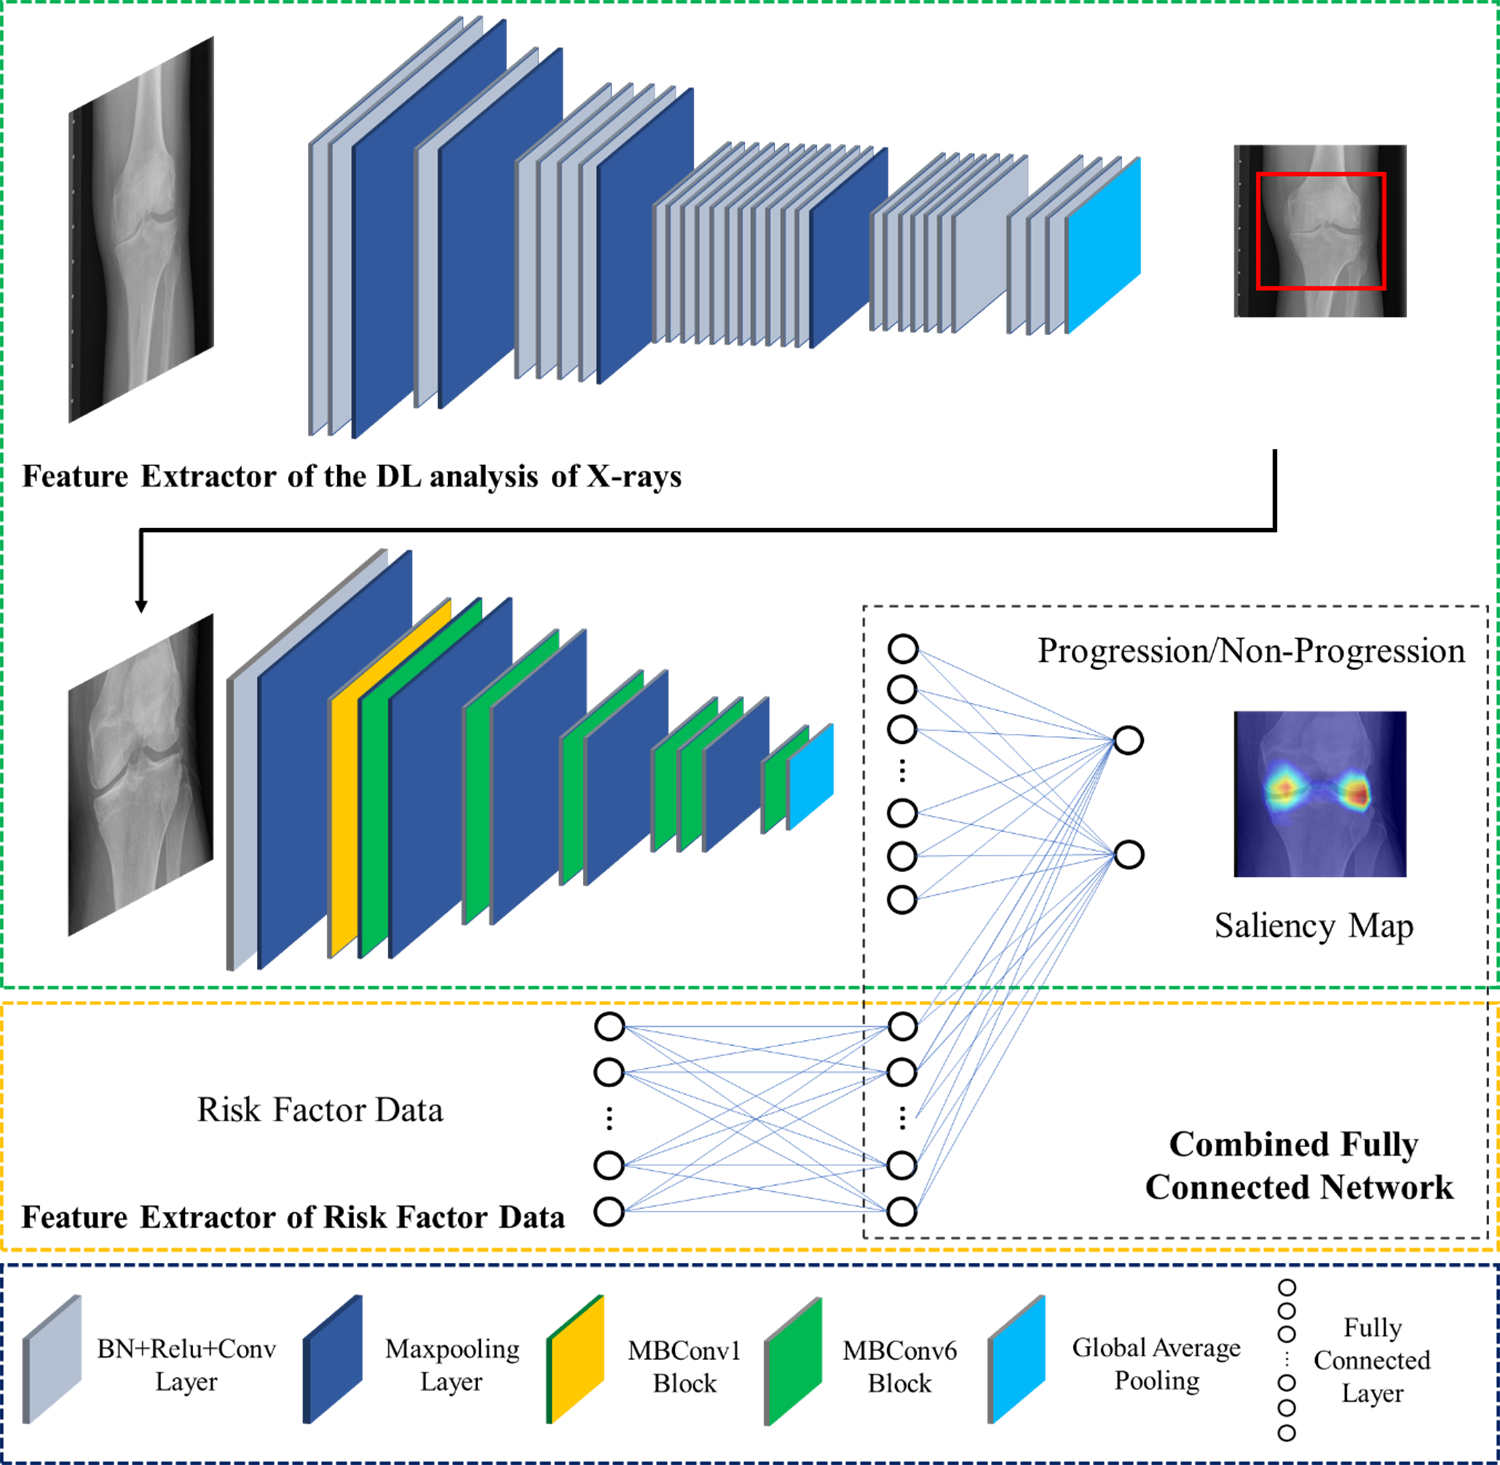
Illustration of the architecture of the combined model for predicting pain progression. The proposed model consisted of two separate convolutional neural networks connected in a cascaded fashion to create a fully-automated pipeline. The combined model was created using YOLO and EfficientNet to extract DL information from baseline knee radiographs as a feature vector, which was further concatenated with the normalized demographic, clinical, and radiographic risk factor data vector. BN: batch normalization, Conv2D: 2D convolution, ReLU: rectified linear activation, 2D: two-dimensional.
OA Risk Assessment Model Training and Evaluation
Training and evaluation of the OA risk assessment models was performed on a computer running a 64-bit Linux operating system (Ubuntu 16.04) with an Intel i7 7700k quad-core CPU with 32 GB DDR3 RAM and two Nvidia GTX 1080-Ti graphic cards with 3584 CUDA cores and 11GB GDDR5X RAM. A detailed description of the training and evaluation methods used for each model is provided in the Supplemental Material.
A total of 5000 knees of the 6567 knees eligible to be included in the study were selected for model training and evaluation, with the number chosen to achieve the largest sample size consisting of near equal numbers of knees without and with pain progression. Knees without and with pain progression were randomly selected and stratified using a random data generator in TensorFlow (version 1.12, Google, Mountain View, CA) into three non-overlapping datasets for training, validation, and hold-out testing. The training dataset consisted of 4200 knees (2097 knees without and 2103 knees with pain progression), the validation dataset consisted of 300 knees (150 knees without and 150 knees with pain progression), and the hold-out testing dataset consisted of 500 knees (245 knees without and 255 knees with pain progression).
Statistical Analysis
Statistical analysis was performed using MATLAB (version 2019a, MathWorks, Natick, MA) and MedCalc (version 14.8; MedCalc Software, Ostend, Belgium). Statistical significance was defined as a p-value less than 0.05.
Mann-Whitney U tests were used to compare differences in age, BMI, WOMAC pain score, and KL-grade between knees in the training and hold-out testing datasets without and without pain progression. Chi-square tests were used to compare differences in gender and race between knees without and with pain progression.
Receiver operator characteristic (ROC) analysis with areas under the curves (AUCs) was used to determine the diagnostic performance of all traditional models and all DL models for predicting pain progression for all knees in the hold-out testing dataset. For the best traditional model, best DL model, and combined model, AUCs and optimal sensitivities and specificities at the Youden Index [38] were determined for all knees, KL grades 0 and 1 knees at risk for OA, KL grades 2, 3, and 4 knees with OA, KL grade 2 knees with mild OA, and KL grades 3 and 4 knees with moderate and severe OA in the hold-out testing dataset. Two-sided exact binomial tests were used to calculate 95% confidence intervals. A nonparametric approach was used to compare AUCs between the models and AUCs between KL grade 0 and 1 knees and KL grades 2, 3, and 4 knees for each individual model [39]. KL grade 1 knees and KL grade 2 and 3 knees could not be included in the analysis due to insufficient sample size.
RESULTS
Tables 1 and 2 compare the distribution of demographic, clinical, and radiographic risk factors for all knees without and with pain progression in the training and hold-out testing datasets, respectively. For both datasets, BMI and KL grade were significantly higher (p<0.05) for knees with pain progression than knees without pain progression. However, there was no significant difference (p=0.093–0.996) between knees without and with pain progression for age, gender, race, or baseline WOMAC pain score for either the training or hold-out testing datasets.
Table 1:
Distribution of demographic, clinical, and radiographic risk factors for all knees, knees without pain progression, and knees with pain progression in the training dataset.
| Risk Factor | All Knees (N=4200) |
Knees Without Progression (N=2097) |
Knees With Progression (N=2103) |
*P-Value |
|---|---|---|---|---|
|
| ||||
| Age in Years (Mean, SD) | 61.0, 9.2 | 61.2, 9.5 | 60.8, 8.9 | 0.470 |
| Gender (Number Female, %) | 2507, 59.7 | 1235, 58.9 | 1272, 60.5 | 0.576 |
| Race (Number Caucasian, %) | 3404, 81.4 | 1715, 81.8 | 1689, 80.3 | 0.724 |
| BMI in km/m2 (mean, SD) | 28.6, 4.8 | 28.0, 4.7 | 29.1, 4.9 | < 0.001 |
| WOMAC Score (Mean, SD) | 11.1, 15.6 | 13.1, 18.0 | 9.6, 13.2 | 0.101 |
| KL-Grade (Mean, SD) | 1.2, 1.2 | 1.1, 1.2 | 1.4, 1.2 | < 0.001 |
SD: Standard Deviation
BMI: Body Mass Index
WOMAC: Western Ontario and McMaster Universities Osteoarthritis Index Pain Score
KL: Kellgren-Lawrence
P-Values for Difference Between Knees Without and With Pain Progression
Table 2:
Distribution of demographic, clinical, and radiographic risk factors for all knees, knees without pain progression, and knees with pain progression in the hold-out testing dataset.
| Risk Factor | All Knees (N=500) |
Knees Without Progression (N=245) |
Knees With Progression (N=255) |
*P-Value |
|---|---|---|---|---|
|
| ||||
| Age in Years (Mean, SD) | 60.8, 9.3 | 61.0, 9.4 | 60.6, 9.1 | 0.861 |
| Gender (Number Female, %) | 299, 59.8 | 146, 59.6 | 153, 60.0 | 0.996 |
| Race (Number Caucasian, %) | 395, 79.0 | 186, 75.9 | 209, 81.9 | 0.892 |
| BMI in km/m2 (mean, SD) | 28.6, 5.1 | 28.0, 4.8 | 29.2, 5.4 | 0.015 |
| WOMAC Score (Mean, SD) | 10.7, 15.7 | 13.0, 18.1 | 8.3, 12.4 | 0.093 |
| KL Grade (Mean, SD) | 1.2, 1.2 | 1.0, 1.2 | 1.4, 1.2 | < 0.001 |
SD: Standard Deviation
BMI: Body Mass Index
WOMAC: Western Ontario and McMaster Universities Osteoarthritis Index Pain Score
KL: Kellgren-Lawrence
P-Values for Difference Between Knees Without and With Pain Progression
The AUCs of the traditional models for predicting pain progression for all knees in the hold-out testing dataset were 0.692 (95% confidence interval of 0.660 to 0.742) for the ANN model, 0.681 (95% confidence interval of 0.637 to 0.721) for the random forest model, and 0.660 (95% confidence interval of 0.616 to 0.701) for the logistic regression model. The AUCs of the DL models for predicting pain progression for all knees in the hold-out testing dataset were 0.751 (95% confidence interval of 0.711 to 0.788) for the DenseNet model and 0.770 (95% confidence interval of 0.730 to 0.806) for the EfficientNet model. The EfficientNet model had significantly higher diagnostic performance (p<0.05) than the DenseNet model.
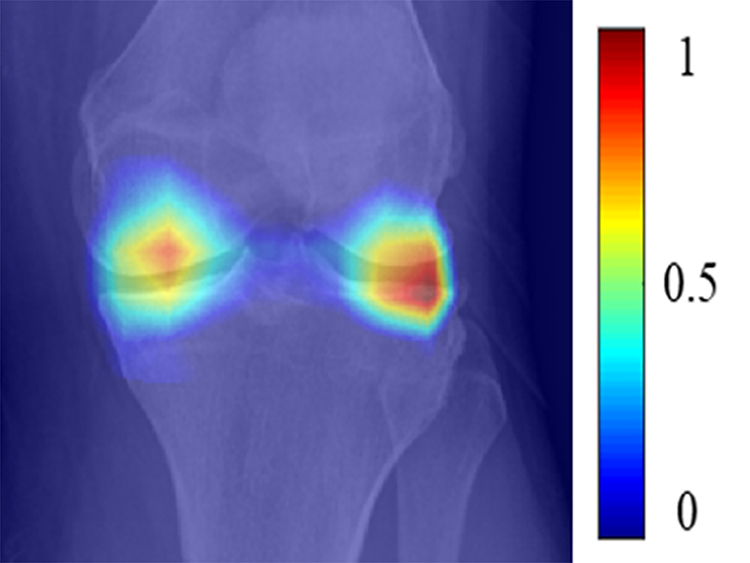
Table 3 shows the sensitivity, specificity, and AUCs of the best traditional ANN model, best DL EfficientNet model, and combined model for predicting pain progression for all knees, KL grade 0 and 1 knees, KL grades 2, 3, and 4 knees, KL grade 2 knees, and KL grades 3 and 4 knees in the hold-out testing dataset, with the ROC curves shown in Figures 3 and 4. The AUCs for all models were significantly higher (p<0.05) for KL grades 2, 3, and 4 knees than KL grades 0 and 1 knees. The combined model had the highest diagnostic performance with an AUC of 0.807 (72.3% sensitivity and 80.9% specificity) for all knees, 0.776 (67.7% sensitivity and 83.0% specificity) for KL grades 0 and 1 knees, 0.841 (82.8% sensitivity and 74.5% specificity) for KL grades 2, 3, and 4 knees, 0.877 (82.5% sensitivity and 80.0% specificity) for KL grade 2 knees, and 0.794 (77.8% sensitivity and 74.4% specificity) for KL grades 3 and 4 knees. Figures 5, 6, 7, and 8 show saliency maps for baseline knee radiographs without and with pain progression evaluated by the combined model which show the regions of discriminative high activation on which the classification CNN based its interpretation.
Table 3:
Sensitivity, specificity, and AUCs for the OA risk assessment models for predicting pain progression in knees in the hold-out testing dataset.
| All Knees with Baseline KL Grades of 0, 1, 2, 3, and 4 (N= 500 Knees) | |||
| Model | Sensitivity % | Specificity % | AUC |
|
| |||
| Traditional Model | 66.9 (59.6 – 71.7) [164/249] |
64.1 (57.9 – 70.1) [161/251] |
0.692 (0.660 – 0.742) |
| DL Model | 76.7 (71.0 – 81.8) [191/249] |
70.5% (64.5 – 76.1) [177/251] |
0.770 (0.730 – 0.806) |
| Combined Model | 72.3% (66.3 – 77.8) [180/249] |
80.9% (75.5 – 85.6) [203/251] |
0.807 (0.769 – 0.840) |
|
| |||
| Knees With Baseline KL Grades of 0 and 1 at Risk for OA (N= 286 Knees) | |||
| Models | Sensitivity % | Specificity % | AUC |
|
| |||
| Traditional Model | 62.4 (53.7 – 70.9) [83/133] |
62.7 (54.7 – 70.6) [96/153] |
0.684 (0.627 – 0.738) |
| DL Model | 70.7 (62.2 – 78.2) [94/133] |
71.9 (64.1 – 78.9) [110/153] |
0.754 (0.700 – 0.803) |
| Combined Model | 67.7 (59.0 – 75.5) [90/133] |
83.0% (76.1 – 88.6) [127/153] |
0.776 (0.723 – 0.823) |
|
| |||
| Knees with Baseline KL Grades of 2, 3, and 4 with OA (N= 214 Knees) | |||
| Models | Sensitivity | Specificity | AUC |
|
| |||
| Best Traditional Model | 69.8 (60.9 – 78.4) [81/116] |
66.3(56.1 – 75.6) [65/98] |
0.714 (0.648 – 0.774) |
| DL Efficient-Net Model | 83.6 (75.6 – 89.8) [97/116] |
70.4 (60.3 – 79.2) [69/98] |
0.786 (0.725 – 0.839) |
| Combined Model | 82.8 (74.6 – 89.1) [96/116] |
74.5 (64.7 – 82.8) [73/98] |
0.841 (0.784 – 0.887 |
|
| |||
| Knees with Baseline KL Grade of 2 with Mild OA (N= 135 Knees) | |||
| Models | Sensitivity | Specificity | AUC |
|
| |||
| Best Traditional Model | 77.5 (66.8 – 86.1) [62/80] |
63.6 (49.6 – 76.2) [35/55] |
0.733 (0.650 – 0.805) |
| DL Efficient-Net Model | 83.8 (73.8 – 91.1) [67/80] |
70.9 (57.1 – 82.4) [39/55] |
0.819 (0.743 – 0.880) |
| Combined Model | 82.5 (72.4 – 90.1) [66/80] |
80.0 (67.0 – 89.6) [44/55] |
0.877 (0.810 – 0.927) |
|
| |||
| Knees with Baseline KL Grades of 3 and 4 with Moderate to Severe OA (N= 79 Knees) | |||
| Models | Sensitivity | Specificity | AUC |
|
| |||
| Best Traditional Model | 94.4 (81.3 – 99.3) [34/36] |
37.2 (23.0 – 53.3) [16/43] |
0.683 (0.569 – 0.783) |
| DL Efficient-Net Model | 83.3 (67.2 – 93.6) [30/36] |
69.8 (53.9 – 82.8) [30/43] |
0.734 (0.622 – 0.827) |
| Combined Model | 77.8 (60.8 – 89.9) [28/36] |
74.4 (58.8 – 86.5) [32/43] |
0.794 (0.688 – 0.877) |
Numbers in Parentheses are 95% Confidence Intervals
Number in Brackets are Raw Data
AUC: Area under the Curve
KL: Kellgren-Lawrence
OA: Osteoarthritis
Figure 3:
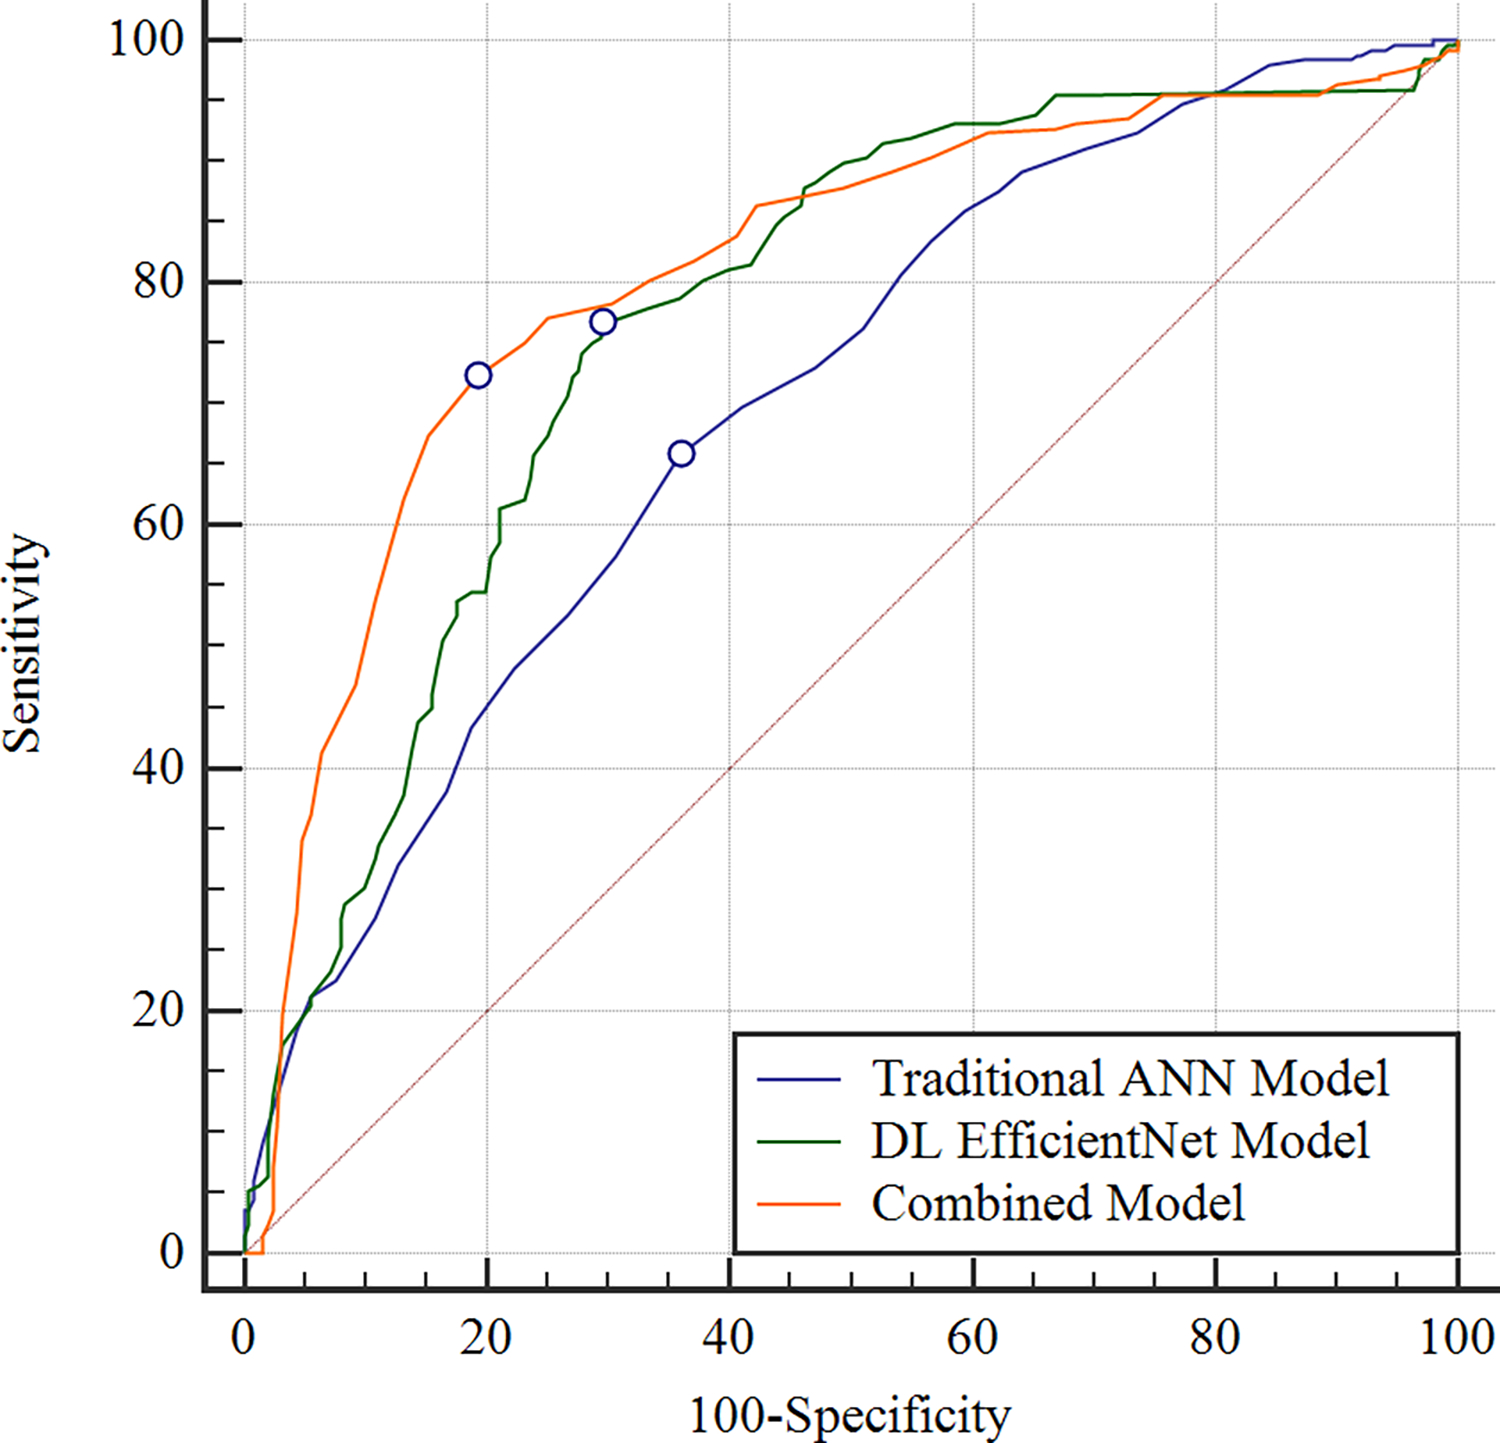
Receiver operating characteristic curves showing the diagnostic performance of the OA risk assessment models for predicting pain progression for all knees in the hold-out testing dataset. The combined model which used demographic, clinical and radiographic risk factors and deep learning (DL) analysis of baseline knee radiographs together had an AUC of 0.807, the DL EfficientNet model which used DL analysis of baseline knee radiographs alone had an AUC of 0.770, and the traditional artificial neural network (ANN) model which used demographic, clinical, and radiographic risk factors alone had an AUC of 0.692.
Figure 4:
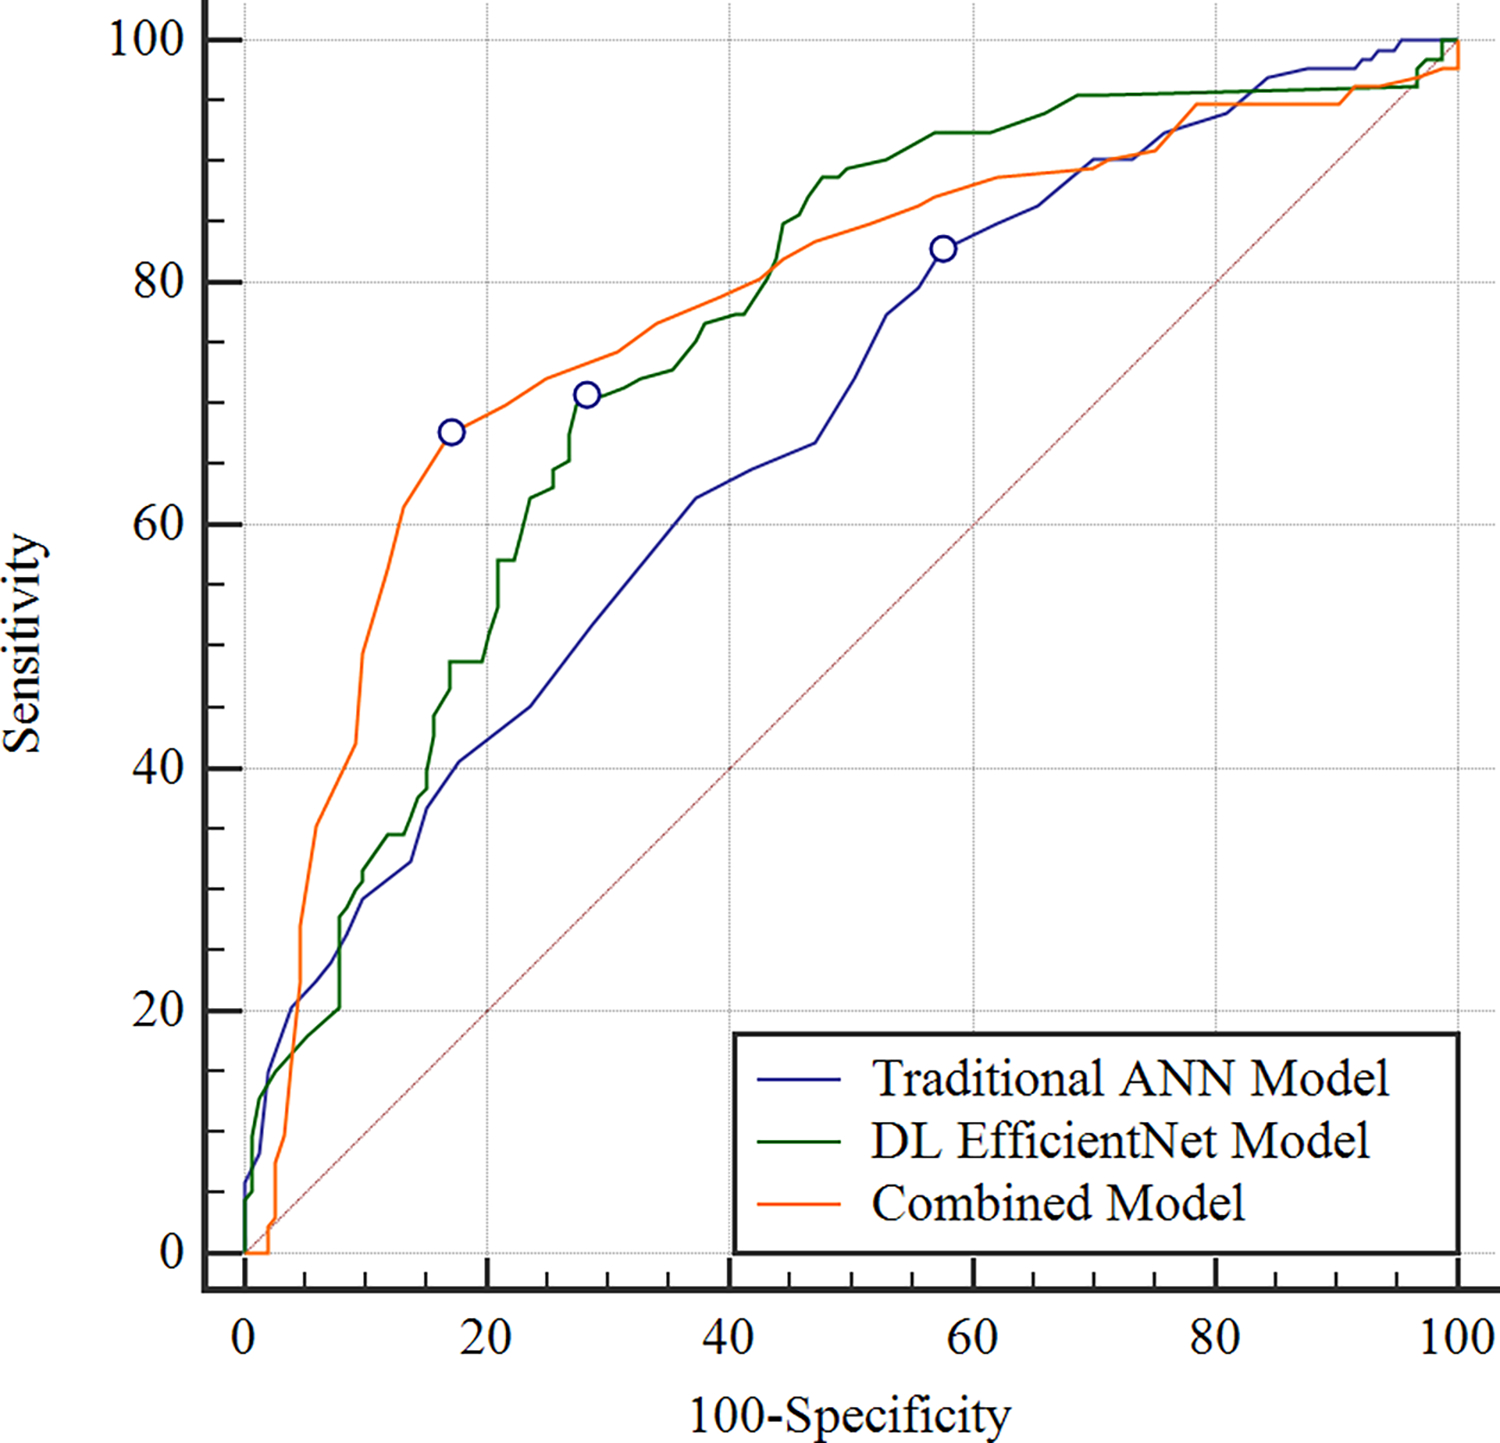

Receiver operating characteristic curves showing the diagnostic performance of the OA risk assessment models for predicting pain progression for (a) knees in the hold-out testing dataset with baseline KL grades of 0 and 1 at risk for OA and (b) knees in the hold-out testing dataset with baseline KL grades of 2, 3, and 4 with OA. For knees with baseline KL grades of 0 and 1, the combined model which used demographic, clinical and radiographic risk factors and deep learning (DL) analysis of baseline knee radiographs together had an AUC of 0.776, the DL EfficientNet model which used DL analysis of baseline knee radiographs alone had an AUC of 0.754, and the traditional artificial neural network (ANN) model which used demographic, clinical, and radiographic risk factors alone had an AUC of 0.684. For knees with baseline KL grades of 2, 3, and 4, the combined model had an AUC of 0.841, the DL EfficientNet model had an AUC of 0.786, and the traditional model had an AUC of 0.714.
Figure 5:
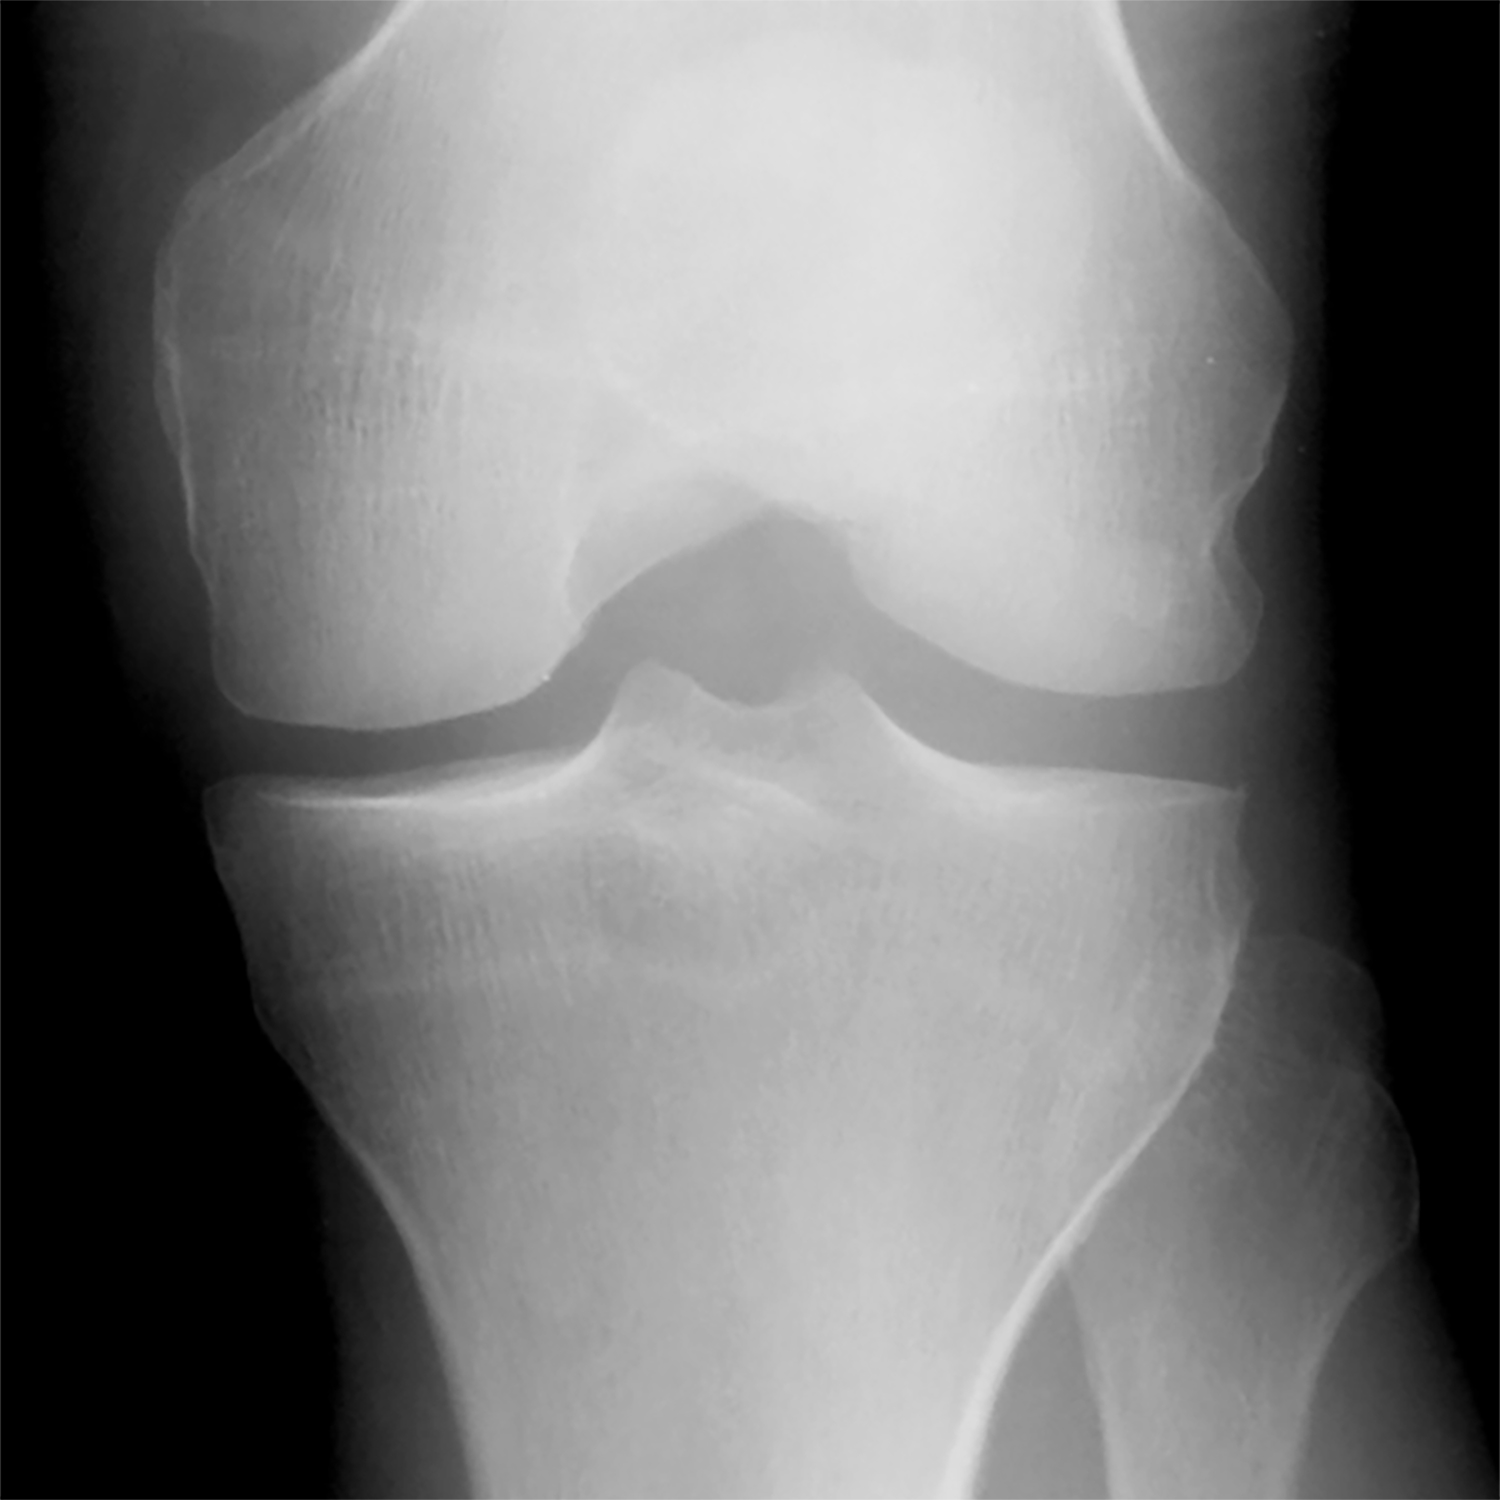
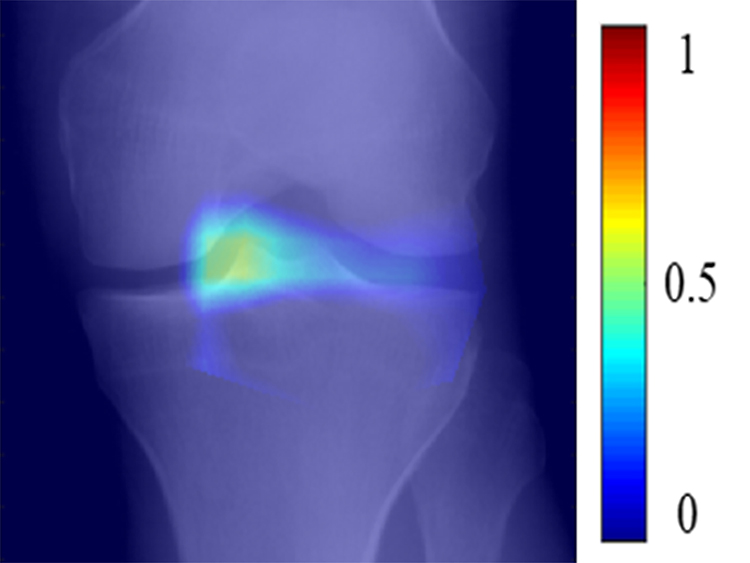
(a) Baseline radiograph and (b) corresponding saliency map for a knee in the hold-out testing dataset from a 59 year old female with a KL grade of 0 without pain progression evaluated by the combined model, which made a true negative interpretation of no pain progression. Note that the strong discriminative high activation region on the radiograph on which the model based its interpretation was centered on the joint space and surrounding bone (color region).
Figure 6:
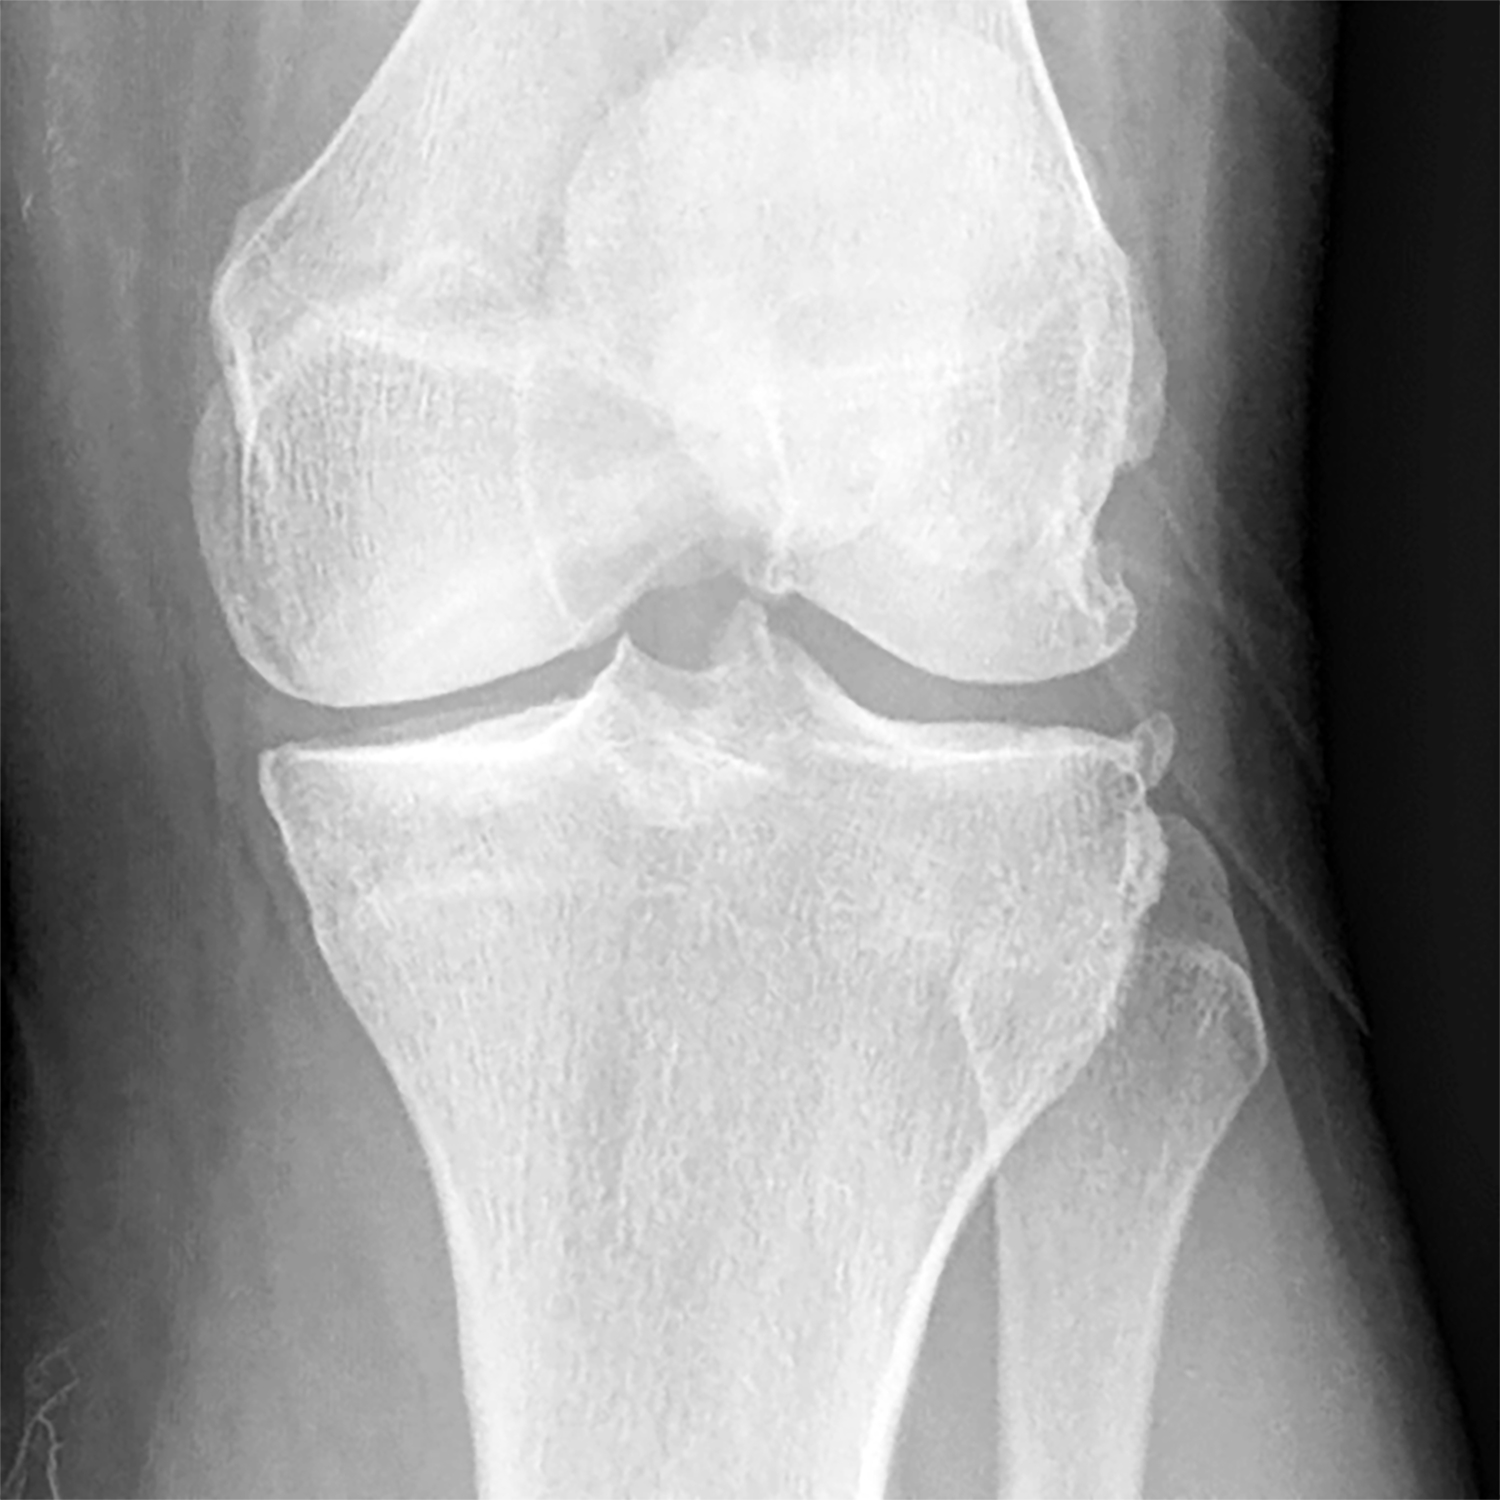
(a) Baseline radiograph and (b) corresponding saliency map for a knee in the hold-out testing dataset from a 65 year old male with a KL grade of 2 with pain progression evaluated by the combined model, which made a true positive interpretation of pain progression. Note that the strong discriminative high activation regions on the radiograph on which the model based its interpretation were centered on the joint space and surrounding bone (color regions).
Figure 7:
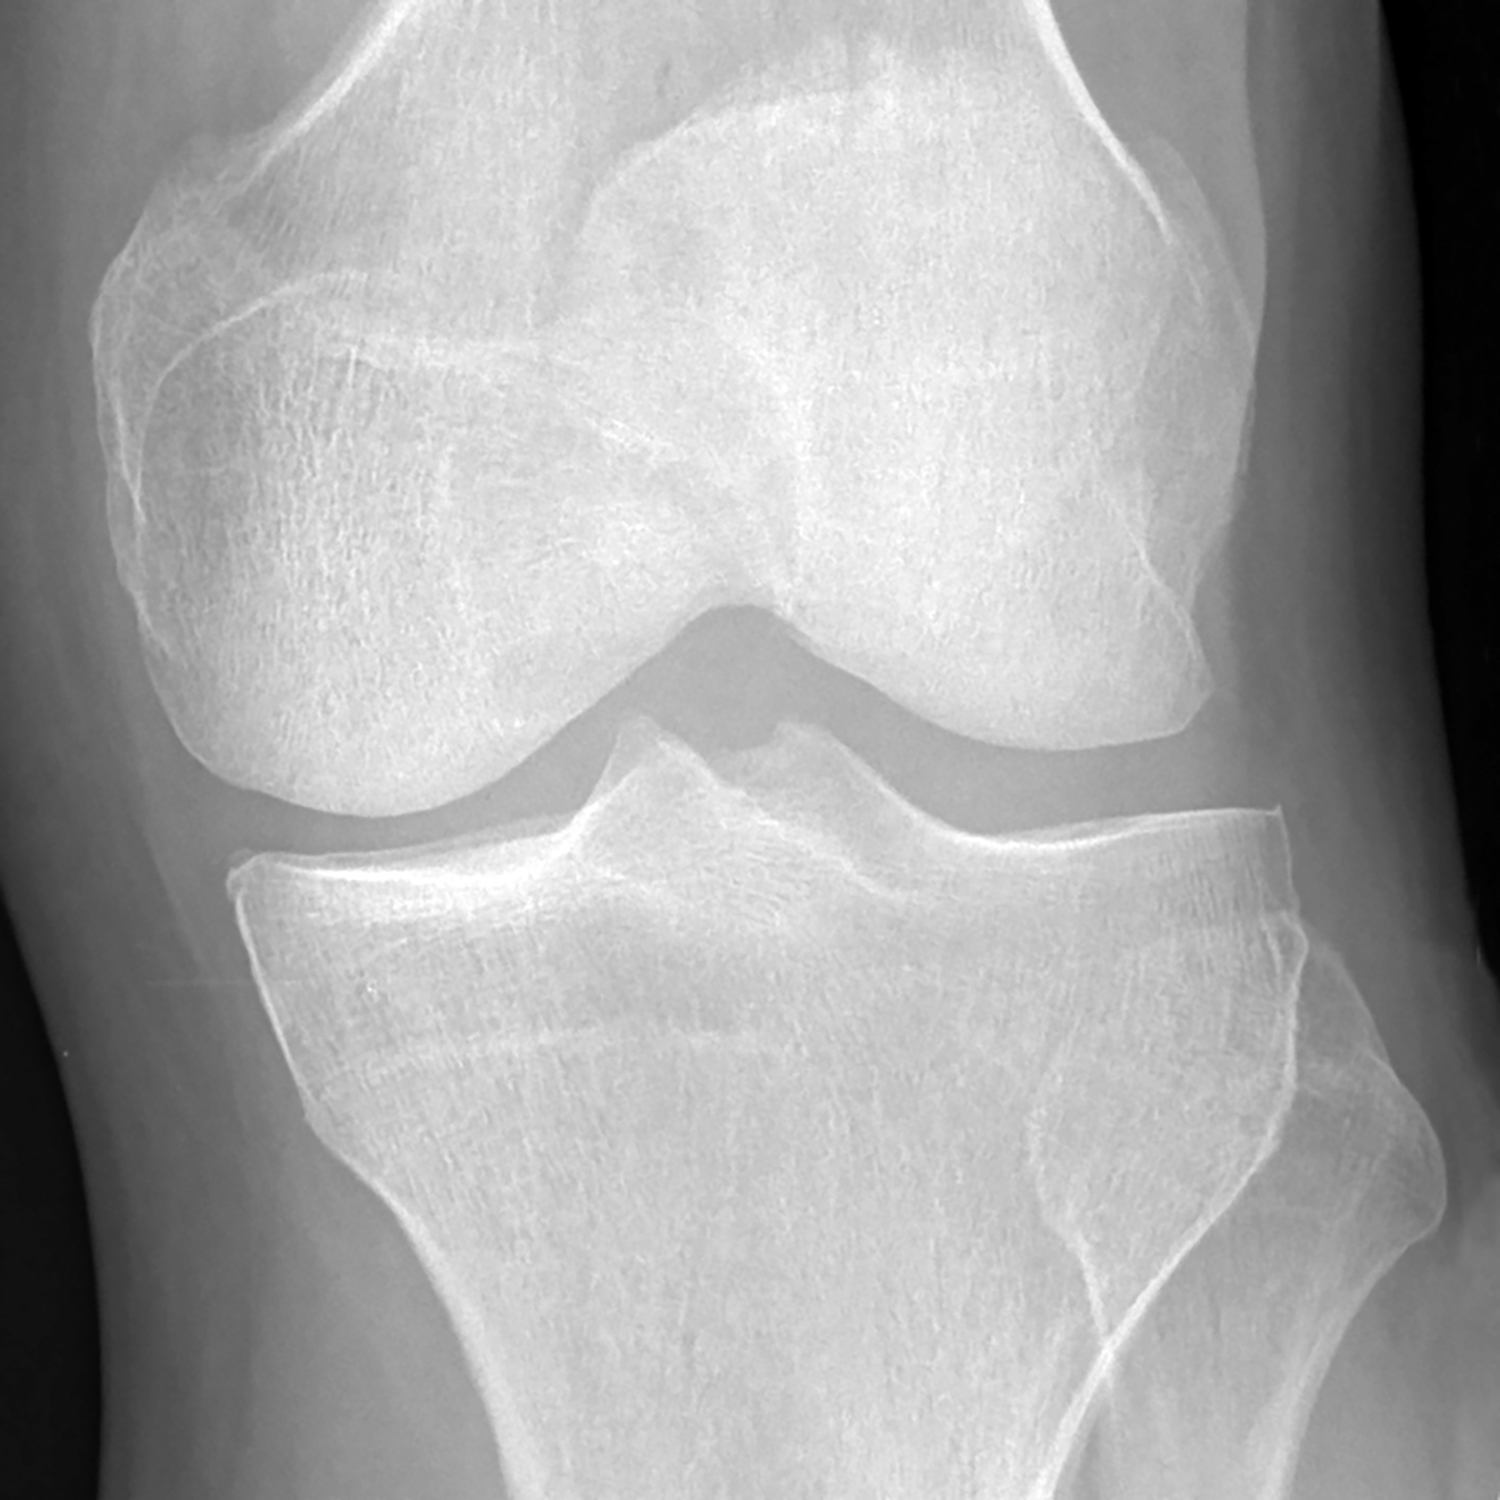
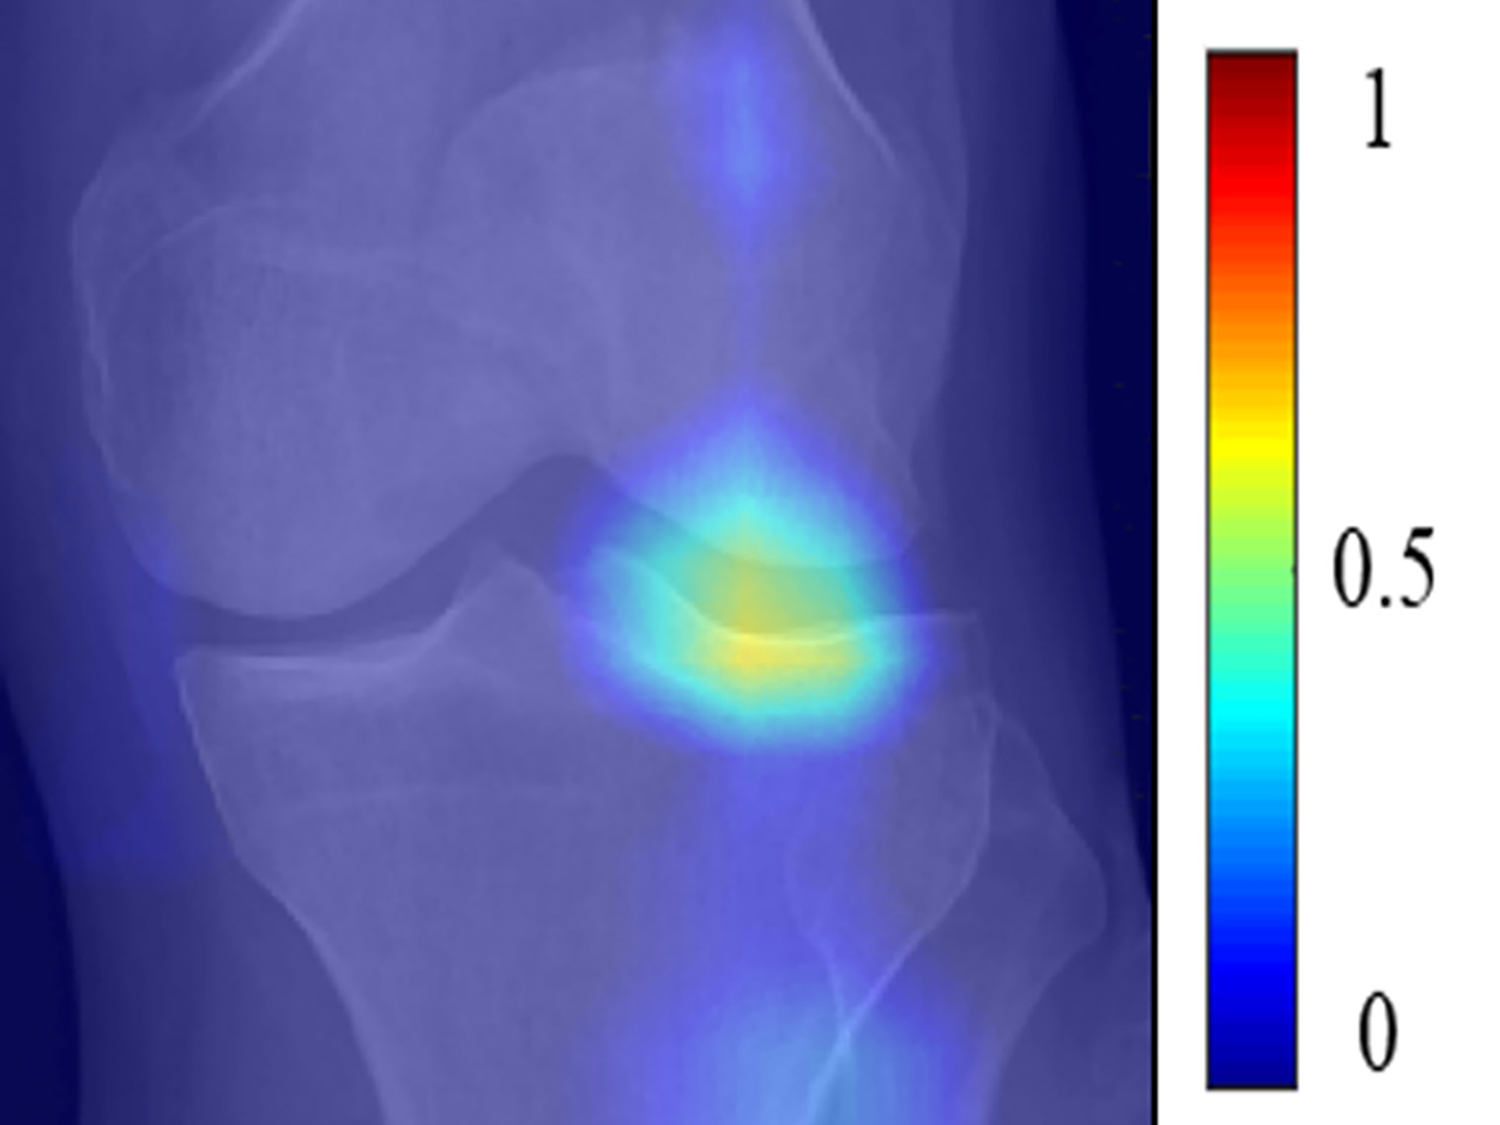
(a) Baseline radiograph and (b) corresponding saliency map for a knee in the hold-out testing dataset from a 67 year old female with a KL grade of 2 without pain progression evaluated by the combined model, which made a false positive interpretation of pain progression. Note that the strong discriminative high activation region on the radiograph on which the model based its interpretation was centered on the joint space and surrounding bone (color region), similar to the locations of high activation on the cases with true negative and true positive interpretations. The reason for the false positive interpretation cannot be determined.
Figure 8:
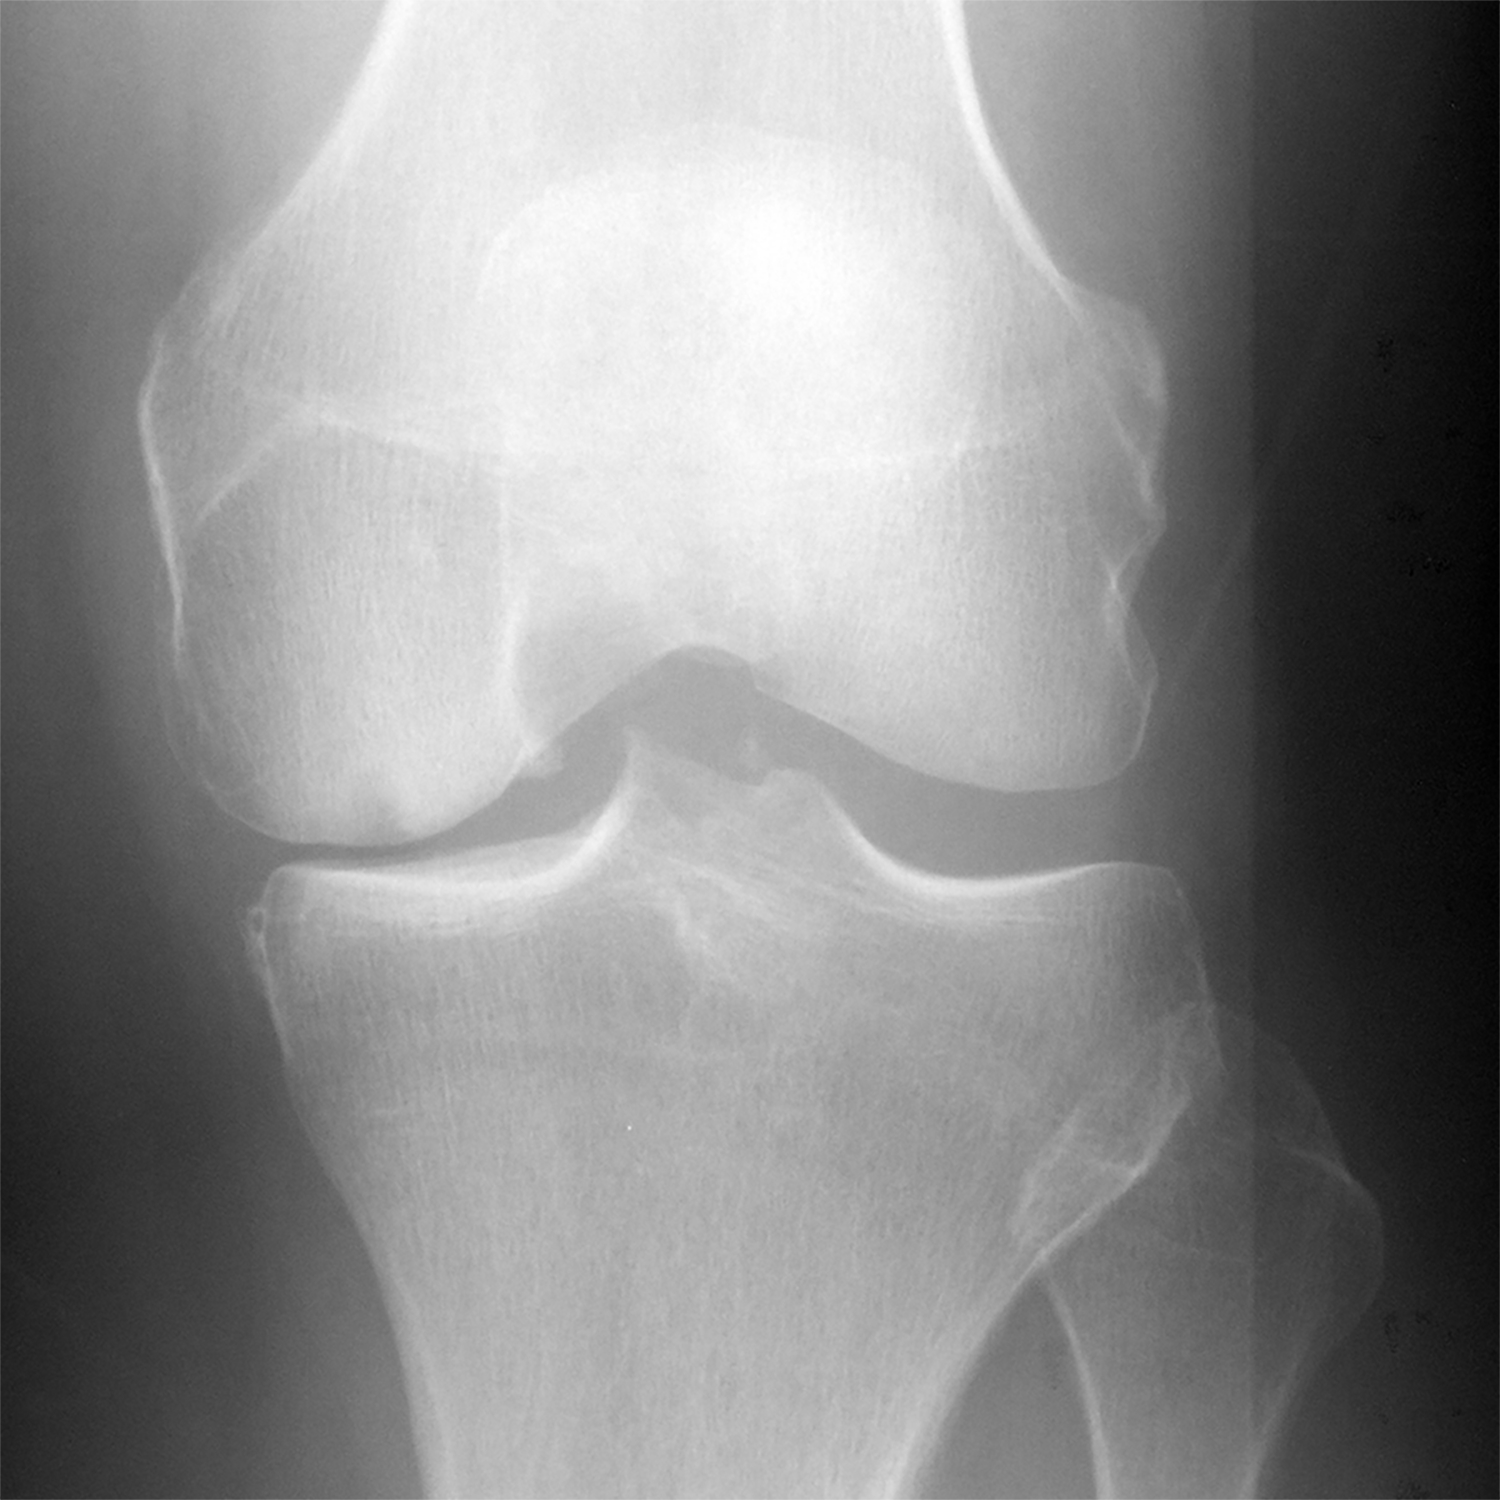

(a) Baseline radiograph and (b) corresponding saliency map for a knee in the hold-out testing dataset from a 61 year old male with a KL grade of 3 with pain progression evaluated by the combined model, which made a false negative interpretation of no pain progression. Note that there was not a strong discriminative high activation region on the radiograph on which the model based its interpretation (color region), which was the likely cause of the false negative interpretation.
DL analysis of baseline knee radiographs improved the diagnostic performance for predicting pain progression when compared to traditional models using demographic, clinical, and radiographic risk factors. The DL EfficientNet model and combined model had significantly higher (p<0.001) AUCs than the traditional ANN model for all knees, KL grades 0 and 1 knees, and KL grades 2, 3, and 4 knees. The combined model had significantly higher (p<0.05) AUCs than the DL EfficientNet model for all knees and KL grades 2, 3, and 4 knees and marginally significantly higher AUC (p=0.058) for KL grades 0 and 1 knees.
DISCUSSION
Our study has demonstrated the feasibility of using DL risk assessment models for predicting pain progression in subjects with or at risk for knee OA using baseline knee radiographs. The combined model had the top diagnostic performance with an AUC of 0.807 for predicting pain progression for all knees, compared to AUCs of 0.692 and 0.770 for the best traditional ANN model and best DL EfficientNet model, respectively. The AUCs of the combined model and DL EfficientNet model were significantly higher (p<0.001) than the AUC of the traditional ANN model. The AUCs of all models were significantly higher (p<0.05) for KL grades 2, 3, and 4 knees than KL grades 0 and 1 knees, indicating higher diagnostic performance for predicting pain progression in knees with OA than knees with risk factors for OA that had not yet developed radiographic manifestations of the disease.
Two previous studies have described traditional OA risk assessment models for predicting pain progression in subjects at risk for knee OA using demographic, clinical, and radiographic risk factors [18, 19]. Landsmeer et al [19] used a traditional model to predict the onset of frequent knee pain over a six-year follow-up period in 472 knees of overweight and obese women without knee OA in the Prevention of Knee Osteoarthritis in Overweight Females (PROOF) study. A multivariate logistic regression model using BMI, baseline knee pain, knee pain climbing stairs, morning stiffness, post-menopausal status, and heavy lifting had an AUC of 0.71 for predicting the onset of frequent knee pain. Halilaj et al [18] used a much larger number of potential risk factors, including demographics, knee symptoms, medication usage, family history, general health status, comorbidities, nutritional and mental health information, walking ability and upper leg strength assessments, and KL grade and knee alignment measurements on radiographs, to predict pain progression in 1243 knees in the OAI incidence cohort. A LASSO regression model had an AUC of 0.79 for predicting pain progression over an eight-year follow-up period. The model developed by Halilaj et al [18] achieved high diagnostic performance but would be difficult to incorporate into widespread clinical use, as it analyzed a large number of risk factors obtained from detailed and time-consuming clinical history, physical examination, and radiographic evaluations.
Two previous studies have described OA risk assessment models for predicting pain progression in patients at risk for knee OA using baseline MRI examinations [20, 21]. Both studies analyzed cartilage T2 relaxation time texture information on T2 maps to distinguish between knees in the OAI control cohort without pain progression and knees in the OAI incidence cohort with pain progression over a four-year follow-up period [20, 21]. A support machine vector had a sensitivity and specificity of 71.2% and 72.3%, respectively for distinguishing between knees without and with pain progression in a study performed by Urish et al [20] and an AUC of 0.87 with a sensitivity and specificity of 77.2% and 89.3%, respectively in a study performed by Zhong et al. [21]. Both models achieved high diagnostic performance. However, analyzing baseline T2 maps is relatively time-consuming and requires segmenting cartilage, identifying specific features that warrant investigation, and then extracting the features from an MRI examination that is costly and not performed as commonly as radiographs in clinical practice to evaluate patients with or at risk for knee OA.
Our combined model had an AUC of 0.770 for predicting pain progression for KL grades 0 and 1 knees, which compares favorably to the AUCs of other models reported in the literature for subjects at risk for knee OA [18–21]. Furthermore, the diagnostic performance of the combined for predicting pain progression for grades 2, 3, and 4 knees was significantly higher (p<0.05), with an AUC of 0.841. To our knowledge, no previous studies have described a risk assessment model for predicting pain progression exclusively in subjects with knee OA. Our combined joint training model also has several unique advantages. The model threshold for predicting pain progression can be adjusted to achieve the desired level of sensitivity and specificity for use in different clinical scenarios. For example, a more sensitive but less specific threshold could be used to help motivate high risk patients to adhere to beneficial lifestyle modifications, while a more specific but less sensitive threshold could be used to help triage high risk patients for referrals for more expensive and invasive treatment options. Our combined model also provides a fully-automated method to simultaneously analyze readily obtainable demographic, clinical, and radiographic risk factors and baseline knee radiographs. Thus, the model could potentially be used in clinical practice to rapidly and accurately predict pain progression in patients with or at risk factors for knee OA.
Our study has several limitations. One limitation was the inclusion of only a relatively small number of demographic, clinical, and radiographic risk factors in our traditional and combined risk assessment models. However, the main objective of our study was to create widespread, cost-effective, and easily acquired OA risk assessment models for predicting pain progression. Thus, our models only analyzed readily obtainable demographic, clinical, and radiographic variables that have been shown to be risk factors for pain progression in multiple previously published studies. Another limitation was that the diagnostic performance of our OA risk assessment models were only evaluated using a hold-out testing dataset in the OAI. Future studies are needed to determine whether similar high diagnostic performance could be achieved when our DL models are evaluated in different subject populations using knee radiographs potentially acquired with different imaging protocols and quality assurance standards. In addition, the classification CNNs in our DL and combined models required equal numbers of knees with and without pain progression in the training dataset as the neural networks were unable to adapt to unbalanced data in the training process. Thus, the proportion of knees with pain progression in the training, validation, and testing datasets were not the same as the true prevalence of pain progression in the OAI database or in the real population. Furthermore, our study only used the definition of pain progression provided by the Foundation of the National Institute of Health OA Biomarker Consortium Project, which is a nine point or greater increase in WOMAC pain score between baseline and two or more follow-up time over the first 48-months. Additional studies are needed to investigate the ability of our DL models to predict other pain trajectories such as severe, rapidly progressing pain, and pain persisting and worsening over longer follow-up periods. Our study also did not take into account the specific treatment regiments received by subjects in the OAI, which could have influenced the severity of their knee pain. A final limitation was that our DL models could provide no mechanistic information regarding the imaging features responsible for pain progression in subjects with knee OA or risk factors for knee OA.
In conclusion, our study has demonstrated the feasibility of using DL risk assessment models for predicting pain progression in subjects with knee OA or risk factors for knee OA using baseline knee radiographs. Our combined model, which used demographic, clinical and radiographic risk factors and DL analysis of baseline knee radiographs together, achieved the highest diagnostic performance for predicting pain progression, which was significantly higher (p<0.05) than the diagnostic performance of the traditional and DL models. However, future work is needed to further validate our combined model in different subject populations and to optimize threshold levels best suited for different clinical scenarios. Furthermore, future prospective studies are needed to determine whether the increase in diagnostic performance of our combined model could directly translate into improvements in clinical care and whether early initiation of treatment of patients with or at risk for knee OA using the model is clinically feasible and ultimately successful.
Supplementary Material
Footnotes
COMPLIANCE WITH ETHICAL STANDARDS
Conflict of interest: The authors declare that they have no conflict of interest
REFERENCES
- 1.Felson DT, Zhang Y, Hannan MT, Naimark A, Weissman BN, Aliabadi P, et al. The incidence and natural history of knee osteoarthritis in the elderly. The Framingham Osteoarthritis Study. Arthritis and rheumatism. 1995; 38(10):1500–1505. [DOI] [PubMed] [Google Scholar]
- 2.Neogi T The epidemiology and impact of pain in osteoarthritis. Osteoarthr Cartilage. 2013; 21(9):1145–1153. [DOI] [PMC free article] [PubMed] [Google Scholar]
- 3.Neogi T, Frey-Law L, Scholz J, Niu J, Arendt-Nielsen L, Woolf C, et al. Sensitivity and sensitisation in relation to pain severity in knee osteoarthritis: trait or state? Ann Rheum Dis. 2015; 74(4):682–688. [DOI] [PMC free article] [PubMed] [Google Scholar]
- 4.Sheeran P, Harris PR, Epton T. Does heightening risk appraisals change people’s intentions and behavior? A meta-analysis of experimental studies. Psychol Bull. 2014; 140(2):511–543. [DOI] [PubMed] [Google Scholar]
- 5.Roddy E, Doherty M. Changing life-styles and osteoarthritis: what is the evidence? Best practice & research Clinical rheumatology. 2006; 20(1):81–97. [DOI] [PubMed] [Google Scholar]
- 6.Nguyen C, Lefevre-Colau MM, Poiraudeau S, Rannou F. Evidence and recommendations for use of intra-articular injections for knee osteoarthritis. Ann Phys Rehabil Med. 2016; 59(3):184–189. [DOI] [PubMed] [Google Scholar]
- 7.Hong T, Wang H, Li G, Yao P, Ding Y. Systematic Review and Meta-Analysis of 12 Randomized Controlled Trials Evaluating the Efficacy of Invasive Radiofrequency Treatment for Knee Pain and Function. Biomed Res Int. 2019; 2019:9037510. [DOI] [PMC free article] [PubMed] [Google Scholar]
- 8.Amendola A, Bonasia DE. Results of high tibial osteotomy: review of the literature. International orthopaedics. 2010; 34(2):155–160. [DOI] [PMC free article] [PubMed] [Google Scholar]
- 9.Hannan MT, Felson DT, Pincus T. Analysis of the discordance between radiographic changes and knee pain in osteoarthritis of the knee. The Journal of rheumatology. 2000; 27(6):1513–1517. [PubMed] [Google Scholar]
- 10.Hochberg MC, Lawrence RC, Everett DF, Cornoni-Huntley J. Epidemiologic associations of pain in osteoarthritis of the knee: data from the National Health and Nutrition Examination Survey and the National Health and Nutrition Examination-I Epidemiologic Follow-up Survey. Seminars in arthritis and rheumatism. 1989; 18(4 Suppl 2):4–9. [DOI] [PubMed] [Google Scholar]
- 11.Lethbridge-Cejku M, Scott WW Jr., Reichle R, Ettinger WH, Zonderman A, Costa P, et al. Association of radiographic features of osteoarthritis of the knee with knee pain: data from the Baltimore Longitudinal Study of Aging. Arthritis Care Res. 1995; 8(3):182–188. [DOI] [PubMed] [Google Scholar]
- 12.Paradowski PT, Englund M, Lohmander LS, Roos EM. The effect of patient characteristics on variability in pain and function over two years in early knee osteoarthritis. Health and quality of life outcomes. 2005; 3:59. [DOI] [PMC free article] [PubMed] [Google Scholar]
- 13.Jinks C, Jordan KP, Blagojevic M, Croft P. Predictors of onset and progression of knee pain in adults living in the community. A prospective study. Rheumatology. 2008; 47(3):368–374. [DOI] [PubMed] [Google Scholar]
- 14.Mallen CD, Peat G, Thomas E, Lacey R, Croft P. Predicting poor functional outcome in community-dwelling older adults with knee pain: prognostic value of generic indicators. Annals of the rheumatic diseases. 2007; 66(11):1456–1461. [DOI] [PMC free article] [PubMed] [Google Scholar]
- 15.Collins JE, Katz JN, Dervan EE, Losina E. Trajectories and risk profiles of pain in persons with radiographic, symptomatic knee osteoarthritis: data from the osteoarthritis initiative. Osteoarthritis and cartilage / OARS, Osteoarthritis Research Society. 2014; 22(5):622–630. [DOI] [PMC free article] [PubMed] [Google Scholar]
- 16.Vina ER, Ran D, Ashbeck EL, Kwoh CK. Natural history of pain and disability among African-Americans and Whites with or at risk for knee osteoarthritis: A longitudinal study. Osteoarthritis and cartilage / OARS, Osteoarthritis Research Society. 2018; 26(4):471–479. [DOI] [PMC free article] [PubMed] [Google Scholar]
- 17.Oak SR, Ghodadra A, Winalski CS, Miniaci A, Jones MH. Radiographic joint space width is correlated with 4-year clinical outcomes in patients with knee osteoarthritis: data from the osteoarthritis initiative. Osteoarthritis Cartilage. 2013; 21(9):1185–1190. [DOI] [PubMed] [Google Scholar]
- 18.Halilaj E, Le Y, Hicks JL, Hastie TJ, Delp SL. Modeling and predicting osteoarthritis progression: data from the osteoarthritis initiative. Osteoarthritis and cartilage / OARS, Osteoarthritis Research Society. 2018; 26(12):1643–1650. [DOI] [PMC free article] [PubMed] [Google Scholar]
- 19.Landsmeer MLA, Runhaar J, van Middelkoop M, Oei EHG, Schiphof D, Bindels PJE, et al. Predicting Knee Pain and Knee Osteoarthritis Among Overweight Women. J Am Board Fam Med. 2019; 32(4):575–584. [DOI] [PubMed] [Google Scholar]
- 20.Urish KL, Keffalas MG, Durkin JR, Miller DJ, Chu CR, Mosher TJ. T2 texture index of cartilage can predict early symptomatic OA progression: data from the osteoarthritis initiative. Osteoarthritis and cartilage / OARS, Osteoarthritis Research Society. 2013; 21(10):1550–1557. [DOI] [PMC free article] [PubMed] [Google Scholar]
- 21.Zhong H, Miller DJ, Urish KL. T2 map signal variation predicts symptomatic osteoarthritis progression: data from the Osteoarthritis Initiative. Skeletal radiology. 2016; 45(7):909–913. [DOI] [PMC free article] [PubMed] [Google Scholar]
- 22.Singh SP, Wang L, Gupta S, Goli H, Padmanabhan P, Gulyas B. 3D Deep Learning on Medical Images: A Review. Sensors (Basel). 2020; 20(18). [DOI] [PMC free article] [PubMed] [Google Scholar]
- 23.Chang GH, Felson DT, Qiu S, Guermazi A, Capellini TD, Kolachalama VB. Assessment of knee pain from MR imaging using a convolutional Siamese network. Eur Radiol. 2020; 30(6):3538–3548. [DOI] [PMC free article] [PubMed] [Google Scholar]
- 24.Tiulpin A, Klein S, Bierma-Zeinstra SMA, Thevenot J, Rahtu E, Meurs JV, et al. Multimodal Machine Learning-based Knee Osteoarthritis Progression Prediction from Plain Radiographs and Clinical Data. Sci Rep. 2019; 9(1):20038. [DOI] [PMC free article] [PubMed] [Google Scholar]
- 25.Guan B, Liu F, Haj-Mirzaian A, Demehri S, Samsonov A, Neogi T, et al. Deep learning risk assessment models for predicting progression of radiographic medial joint space loss over a 48-MONTH follow-up period. Osteoarthritis Cartilage. 2020; 28(4):428–437. [DOI] [PMC free article] [PubMed] [Google Scholar]
- 26.Leung K, Zhang B, Tan J, Shen Y, Geras KJ, Babb JS, et al. Prediction of Total Knee Replacement and Diagnosis of Osteoarthritis by Using Deep Learning on Knee Radiographs: Data from the Osteoarthritis Initiative. Radiology. 2020; 296(3):584–593. [DOI] [PMC free article] [PubMed] [Google Scholar]
- 27.Tolpadi AA, Lee JJ, Pedoia V, Majumdar S. Deep Learning Predicts Total Knee Replacement from Magnetic Resonance Images. Sci Rep. 2020; 10(1):6371. [DOI] [PMC free article] [PubMed] [Google Scholar]
- 28.Lester G Clinical research in OA--the NIH Osteoarthritis Initiative. Journal of musculoskeletal & neuronal interactions. 2008; 8(4):313–314. [PubMed] [Google Scholar]
- 29.Kellgren JH, Lawrence JS. Radiological assessment of osteo-arthrosis. Ann Rheum Dis. 1957; 16(4):494–502. [DOI] [PMC free article] [PubMed] [Google Scholar]
- 30.Bellamy N WOMAC: a 20-year experiential review of a patient-centered self-reported health status questionnaire. J Rheumatol. 2002; 29(12):2473–2476. [PubMed] [Google Scholar]
- 31.Osteoarthritis Biomarkers Consortium FNIH Project: Study Design. Osteoarthritis Biomarkers Consortium FNIH Project: Study Design. https://www.oai.ucsf.edu/datarelease/biospecimens.asp. Assessed June 20, 2019.
- 32.Angst F, Aeschlimann A, Stucki G. Smallest detectable and minimal clinically important differences of rehabilitation intervention with their implications for required sample sizes using WOMAC and SF-36 quality of life measurement instruments in patients with osteoarthritis of the lower extremities. Arthritis Rheum. 2001; 45(4):384–391. [DOI] [PubMed] [Google Scholar]
- 33.Hafezi-Nejad N, Guermazi A, Roemer FW, Hunter DJ, Dam EB, Zikria B, et al. Prediction of medial tibiofemoral compartment joint space loss progression using volumetric cartilage measurements: Data from the FNIH OA biomarkers consortium. Eur Radiol. 2017; 27(2):464–473. [DOI] [PubMed] [Google Scholar]
- 34.Redmon J, Divvala S, Girshick R, Farhadi A. You Only Look Once: Unified, Real-Time Object Detection. Proc Cvpr Ieee. 2016:779–788. [Google Scholar]
- 35.Deng J, Dong W, Socher R, Li LJ, Li K, Li FF. ImageNet: A Large-Scale Hierarchical Image Database. Cvpr: 2009 Ieee Conference on Computer Vision and Pattern Recognition, Vols 1–4. 2009:248–255. [Google Scholar]
- 36.Huang G, Liu Z, van der Maaten L, Weinberger KQ. Densely Connected Convolutional Networks. 30th Ieee Conference on Computer Vision and Pattern Recognition (Cvpr 2017). 2017:2261–2269. [Google Scholar]
- 37.Tan M, Le Q. EfficientNet: Rethinking Model Scaling for Convolutional Neural Networks. In: Kamalika C, Ruslan S, eds. Proceedings of the 36th International Conference on Machine Learning. Proceedings of Machine Learning Research: PMLR 2019:6105–6114. [Google Scholar]
- 38.Fluss R, Faraggi D, Reiser B. Estimation of the Youden Index and its associated cutoff point. Biom J. 2005; 47(4):458–472. [DOI] [PubMed] [Google Scholar]
- 39.DeLong ER, DeLong DM, Clarke-Pearson DL. Comparing the areas under two or more correlated receiver operating characteristic curves: a nonparametric approach. Biometrics. 1988; 44(3):837–845. [PubMed] [Google Scholar]
Associated Data
This section collects any data citations, data availability statements, or supplementary materials included in this article.


