

Abstract
Wastewater-based epidemiology (WBE) surveillance of COVID-19 and other future outbreaks is a challenge for developing countries as most households are not connected to a sewerage system. In December 2019, SARS-CoV-2 RNA was detected in the Danube River at a site severely affected by wastewaters from Belgrade. Rivers are much more complex systems than wastewater systems, and efforts are needed to address all the factors influencing the adoption of WBE as an alternative to targeting raw wastewater. Our objective was to provide a more detailed insight into the potential of SARS-CoV-2 surveillance in Serbian surface waters for epidemiological purposes. Water samples were collected at 12 sites along the Sava and Danube rivers in Belgrade during the fourth COVID-19 wave in Serbia that started in late February 2021. RNA was concentrated using Amicon Ultra-15 centrifugal filters and quantified using RT-qPCR with primer sets targeting nucleocapsid (N1 and N2) and envelope (E) protein genes. Microbiological (faecal indicator bacteria and human and animal genetic faecal source tracking markers), epidemiological, physicochemical and hydromorphological parameters were analysed in parallel. From 44 samples, SARS-CoV-2 RNA was detected in 31, but only at 4 concentrations above the level of quantification (ranging from 8.47 × 10³ to 2.07 × 10⁴ gc/L). The results indicated that surveillance of SARS-CoV-2 RNA in surface waters as ultimate recipients could be used as an epidemiological early-warning tool in countries lacking wastewater treatment and proper sewerage infrastructure. The performance of the applied approach, including advanced sampling site characterization to trace and identify sites with significant raw sewage influence from human populations, could be further improved by adaptation of the methodology for processing higher volumes of samples and enrichment factors, which should provide the quantitative instead of qualitative data needed for WBE.
Keywords: SARS-CoV-2, Surface waters, Faecal pollution, Untreated wastewaters, Serbia
Graphical abstract

1. Introduction
It has been more than two years since the start of the COVID-19 pandemic and despite vaccination and major findings regarding the transmission of the virus, the end of the pandemic cannot be predicted. Globally, by 27th April 2022 there were 508,827,830 confirmed cases of COVID-19, with 6,227,291 deaths (WHO, 2022). In Serbia, COVID-19 appeared in 6 waves and we are currently nearing the end of the sixth (https://www.worldometers.info/coronavirus/country/serbia/). The periodic increase in the number of infected individuals highlights the need to develop early warning and prediction systems for upcoming waves. Wastewater based epidemiology (WBE) has proven to be a powerful tool (Ahmed et al., 2021b; Barceló, 2020; Bibby et al., 2021; Foladori et al., 2020; Gonzalez et al., 2020; Kumar et al., 2021a, Kumar et al., 2021b; Lundy et al., 2021; Rimoldi et al., 2020; Sherchan et al., 2020; Sherchan et al., 2021). In March 2021, the EU Commission issued a recommendation on a common approach for establishing the systematic surveillance of SARS-CoV-2 and its variants in EU wastewaters (EU Commission, 2021). This has raised the question of the applicability and adoption of WBE in countries with poor sanitation, i.e. those lacking wastewater treatment plants or having insufficiently developed sewerage infrastructure, and has highlighted the need for it (Ahmed et al., 2021b; Jakariya et al., 2021). Such a situation is still prevalent in most EU neighbouring countries in the Western Balkans where all have the perspective of accession to the European Union, including the Republic of Serbia. Belgrade, the capital of Serbia with 1,700,000 inhabitants, does not have any wastewater treatment facility. Although Belgrade has quite a developed sewer system comprised of combined and separate sewers with a total length of over 1500 km to which 1.2 million inhabitants are connected, a large part of the sewage is still discharged into natural watercourses in the city's urban area (such as the Topčiderska River and Mirijevski Potok). Most of the sewer outlets are submerged in the final recipients (the Sava and Danube) and are only directly accessible during periods of low flow. The lack of centralized sampling stations, such as influents in wastewater treatment plants as proposed in the EU Commission Recommendation (EU Commission, 2021), makes clear the need for the adoption of a systematic surveillance program. On the other hand, potential issues related to the discharge of untreated wastewaters into natural watercourses are recognized in Serbia and the assessment of microbiological indicators of faecal pollution is included in the national monitoring program of surface waters (Official Gazette of the Republic of Serbia No.74/2011, 2011). Existing national databases could be useful in defining the sampling stations affected by faecal pollution and could be potentially used for surveillance of SARS-CoV-2 and its variants since SARS-CoV-2 RNA can be detected in surface waters (Kolarević et al., 2021). RNA was quantified using RT-qPCR with primer sets targeting nucleocapsid (N1 and N2) and envelope (E) protein genes. The SARS-CoV-2 gene copy number in the analysed samples ranged from 5.96 × 10³ to 1.30 × 10⁴/L and corresponded to values reported for raw wastewater treatment plant influents in other countries. Viral RNA was not detected in the water sample collected at the site situated 20 km downstream. With the fourth wave of COVID-19, which started in late February 2021, we obtained more information about SARS-CoV-2 RNA in surface waters. Our goal was to investigate if the surveillance of SARS-CoV-2 RNA in surface waters in countries with poor wastewater treatment can serve as an epidemiological indicator. While the same site was used as before, additional aspects were included in this study, such as hourly variations related to defecation frequency and timing, longitudinal impact of wastewaters on the river, variations in hydrometeorological conditions in situ, and epidemiological parameters including the dynamics of active cases. In parallel, water samples were collected at 8 additional locations affected by untreated wastewater discharges in the urban area of Belgrade in order to demonstrate that the site used previously was not an isolated case.
2. Materials and methods
2.1. Sampling sites
Table 1 shows the coordinates of the sampling sites on the Danube River, the Sava River and its right tributary, the Topčiderska River, with satellite captions of the sites provided in Fig. 1 . Five sites were investigated along the Sava, the largest tributary of the Danube by discharge. Site S1 is situated next to the pedestrian/recreational zone of the newly reconstructed city area. At 60 m upstream of this site the combined sewer outlet “Lasta” drains the southwestern part of the central area of Belgrade with a wastewater load of 74,800 population equivalents (p.e.). Site S2 is situated next to the recreational zone, 100 m downstream of the biggest combined sewer outlet “Sajam”, which accounts for almost 40 % of the total of Belgrade's wastewater discharge (537,000 p.e.). Site S3 is the only sampling site near the left bank of the river at the confluence of the Sava and Danube, and is located near the largest separate sewer outlet “Ušće” with a wastewater load of 268,000 p.e. Site S4 is situated on the Topčiderska River which empties into the Sava 4400 m upstream of the confluence of the Sava and Danube. Site S5 is in the Sava River branch near the mouth of the Topčiderska River. There are no precise data on the sewerage outlets in the vicinity or upstream of S4 and S5. A main trunk sewer along the Topčiderska River collects wastewater from the watershed and sends it further downstream to the outlet “Sajam”. However, the quality of the Topčiderska River is degraded due to the discharge of untreated sewage from small outlets, sewer overflows, discharges from commercial enterprises and polluted surface runoffs. In the absence of more precise data, it is estimated that about 15 % of the wastewater from the watershed area is discharged directly into the Topčiderska River instead of the sewer system.
Table 1.
Sampling sites and characteristics of the closest wastewater sewer outlets relative to the sampling site (Master Plan of the Belgrade Sewerage System, 2011).
| Sampling spot | Coordinates | Distance from closest outlet (m) |
Sewer type | Average sewage flow rate (m3/day) |
Wastewater load, p.e.(−)a |
|---|---|---|---|---|---|
| S1 | 44°48′46.05″N 20°26′58.59″E |
60 | Combined | 17,500 | 74,800 |
| S2 | 44°47′59.21″N 20°26′20.58″E |
100 | Separate and combined | 94,250 | 537,000 |
| S3 | 44°49′23.75″N 20°26′32.21″E |
20 | Separate | 47,820 | 268,000 |
| S4 | 44°46′51.28″N 20°26′16.82″E |
-b | Separate and combined | 5000b | 20,000b |
| S5 | 44°47′34.71″N 20°25′34.50″E |
80 | Separate and combined | 5000b | 20,000b |
| S6 | 44°49′15.72″N 20°31′35.82″E |
250 | Separate | 7900 | 37,500 |
| S7 | 44°49′29.69″N 20°29′44.31″E |
30 | Combined | 46,650 | 246,000 |
| S7a | 44°49′25.6″N 20°30′51.5″E |
2000 | Combined | 46,650 | 246,000 |
| S7b | 44°49′50.1″N 20°32′34.3″E |
4570 | Combined | 46,650 | 246,000 |
| S8 | 44°49′47.99″N 20°32′43.07″E |
250 | Separate | 13,050 | 61,300 |
| S9 | 44°49′54.76″N 20°32′50.87″E |
620 | Separate | 13,050 | 61,300 |
| S9b | 44°50′22.6″N 20°33′29.2″E |
1800 | Separate | 13,050 | 61,300 |
p.e. – population equivalent, 1 p.e. = 60 gBOD5/day; BOD5–5-day biochemical oxygen demand.
- no precise data on wastewater outlets, estimated values.
Fig. 1.

Satellite images of sampling sites (Google Earth).
On the Danube River, 7 sites were investigated. The Danube downstream of Belgrade has an average flow of 5600 m3/s. Site S6 is situated on the Danube branch 250 m from the mouth of the small tributary, Mirijevski Potok (stream). This natural waterbody is used as a recipient for domestic wastewater with a total average load of 37,500 p.e. The sites S7, S7a and S7b are situated near the right riverbank downstream (30, 2000 and 4570 m, respectively) of the second largest combined sewer outlet in Belgrade (246,000 p.e.). Site S8 is situated at the end of Danube's side channel, 250 m from the outlet of a separate sewer, with a wastewater load of 61,300 p.e. The outlet can be seen in the satellite image. Sites S9 and S9b are situated further downstream (620 and 1800 m, respectively) on the Danube River.
2.2. Samples
Four groups with a total of 44 samples were processed. All samples were collected as grab samples at 30 cm below the surface in 500-mL polyethylene bottles and transported to the laboratory in dark cooling boxes at 4 °C. Physicochemical and bacterial parameters were measured directly upon sampling. An overview of groups and sample types is given in Table 2 .
Table 2.
An overview of the water samples collected and processed in the 3rd and 4th COVID-19 waves.
| Sample group | Date of sampling | COVID-19 wave in RS | Frequency of sampling | Number of samples | Sampling sites |
|---|---|---|---|---|---|
| Group I | 10th December 2020 | 3rd | Multiple-hourly | 12 | S9 |
| Group II | 28th February 2021 | 4th | single grab | 6 | S7, S7a, S7b, S9, S9b |
| Group III | 9th March-28th May 2021 | 4th | 1–2 times per week | 19 | S9 |
| Group IV | 29th March-2nd April 2021 | 4th | single grab | 7 | S1, S2, S3, S4, S5, S6, S8 |
2.2.1. Group I – hourly variations related to the frequency and timing of defecation
Samples were collected at site S9 and used for composite sample preparation (Kolarević et al., 2021). Each hour, 1000-mL grab samples were collected over a 12-h period (commencing at 07.00) on 10th December 2020 (12 samples in total). Samples used for RNA extraction were stored at −20 °C until analysis (for up to 7 months).
2.2.2. Group II – longitudinal impact of wastewaters on the river
Samples were collected on 28th February 2021 at 6 sites along the right riverbank of the Danube in Belgrade as follows: S7 (upstream and downstream of the outlet), S7a, S7b, S9 and S9b. All samples used for RNA extraction were stored at −20 °C until analysis (up to 4 months).
2.2.3. Group III – temporal variations related to the epidemiological and hydrometeorological factors
Samples were collected throughout the 4th wave of COVID-19 in Serbia at site S9 once or twice a week from 9th March to 28th May 2021. Sampling was performed at 11.00. Grab samples were collected at 30 cm below the surface in 500-mL polyethylene bottles. A total of 19 samples were analysed. Physicochemical, chemical and bacterial parameters were measured immediately upon sampling. All samples used for RNA extraction were stored at −20 °C until analysis (up to 5 months).
2.2.4. Group IV – additional wastewater-affected locations along the Sava and Danube rivers in Belgrade's urban area
Samples were collected at 7 sites (S1, S2, S3, S4, S5, S6, S8) during the peak of the 4th wave of COVID-19 in Serbia from 29th March to 2nd April 2021. A total of 19 samples were analysed. All samples used for RNA extraction were stored at −20 °C until analysis (up to 3 months).
2.3. Physicochemical and cultivation-based bacteriological characterization of the samples
Temperature, pH, conductivity and dissolved oxygen levels were measured onsite using a multiparameter probe (WTW/Xylem Analytics, Germany). Data are provided in the supplementary material (Supplementary Tables S1–4).
Standard faecal indicator bacteria (SFIB; E. coli and intestinal enterococci) were quantified using defined substrate technology IDEXX Quanti-Tray 2000, which provides a Most Probable Number (MPN) result based on the change in colour/fluorescence in 97 wells. Powdered reagents Colilert-18 and Enterolert-E were used for E. coli and enterococci, respectively. Trays were incubated for at least 18 h at 37 °C for E. coli and at least 24 h at 44 °C for intestinal enterococci.
2.4. Microbial faecal source tracking markers
From each sample, 100 mL were filtered over 0.2-μm pore-size polycarbonate filters (Merck-Millipore, Darmstadt, Germany) which were subsequently frozen and stored at −80 °C until DNA extraction. A clean filter was frozen and stored with the sample filters as a filter control. DNA was extracted by a mechanical, bead-beating-based DNA-extraction protocol with chemical phenol-chloroform-based isolation of DNA as described previously (Griffiths et al., 2000; Mayer et al., 2018; Reischer et al., 2008). DNA was eluted in 100 μL of 10 mM Tris buffer, pH 8. All qPCR reactions were run on a Rotor-Gene Q thermocycler (Qiagen, Netherlands) in duplicate and were performed in a 15-μL reaction volume as described (Mayer et al., 2018). Quantification was achieved by parallel quantification of a dilution series of standard plasmids of known concentration. As a robust estimate for the sample limit of detection we applied the threshold of detection (TOD) concept (Reischer et al., 2007, Reischer et al., 2008). The filtration volume (50–100 mL), the use of 2.5 μL diluted DNA extract in the qPCR reaction and the minimal number of detectable targets per PCR reaction define the detection threshold (Reischer et al., 2007). The human-associated faecal marker BacHum (Kildare et al., 2007) was used to track human-associated faecal pollution. Ruminant-associated pollution was traced by the BacR qPCR assay (Reischer et al., 2006) while the Pig2Bac qPCR assay was used to trace pig-associated pollution (Mieszkin et al., 2009). The quantitative microbial source tracking results were expressed as marker equivalents per 100 mL (ME/100 mL).
2.5. SARS-CoV-2 RNA extraction and RT-qPCR
The protocol described in Medema et al. (2020) was applied with modifications as indicated previously (Kolarević et al., 2021). Samples were processed in parallel and for each sample a process control spiked sample was prepared by adding 9.6 × 10² genomic copies of heat inactivated viral material (ATCC Heat Inactivated 2019 Novel Coronavirus VR-1986HK, (ATCC, USA)). To remove solid suspended matter, the samples were centrifuged at 4,000 ×g for 40 min; supernatants were removed and concentrated using Amicon Ultra-15 centrifugal filters (Ultracel-100,000 NMWL, Merck Millipore, Ireland) in 3 × 15 mL steps at 4,000 ×g for 30 min each. RNA extraction was performed using the NucleoSpin RNA Virus kit (Macharey-Nagel, Germany).
Two targets on the nucleoprotein gene (N1 and N2, US Centers for Disease Control and Prevention, 2019) and one on the envelope gene (E, Corman et al., 2020) were probed (primer and probe sets shown in Supplementary Table 5). The PCR reaction was carried out in 20 μL final volume, containing 5 μL TaqMan Fast Virus 1-Step Master Mix (ThermoFischer Scientific, Lithuania) supplemented with 0.4 μL BSA (Bovine Serum Albumin; 20 mg/mL, Thermo Fisher Scientific, USA), primers and probes (Merck, Darmstadt, Germany) at final concentrations shown in Supplementary Table 5, and 5 μL of the isolated RNA. RT-PCR was carried out with a QuantStudio 5 real-time PCR device (Thermo Fisher Scientific, USA) for 5 min at 50 °C, followed by 45 cycles of 10 s at 95 °C and 30 s at 60 °C. The threshold of detection was set at 40 cycles (Kolarević et al., 2021). Each RNA was analysed in technical duplicate, as well as the process control sample used to estimate recovery values; each assay included negative and positive template controls. The presence of potential inhibitory substances in the isolated RNA was assessed by testing and evaluating an 8-fold dilution of the isolated RNA. A standard curve was derived from the quantitative genomic RNA reference material (quantitative genomic RNA from severe acute respiratory syndrome-related coronavirus 2 strain 2019-nCoV/USA-WA1/2020, VR-1986D) provided by ATCC (USA) by preparing and measuring 10-fold dilutions in parallel for the N2 gene. The calibrated concentration range was between 3.7 × 10⁵ to 0.37 genome copies/reaction (gc/rxn) using a 7-point calibration.
The N1, N2 and E gene detection validation with purified RNA from the ATCC VR-1986 virus material previously yielded the following results: N1 and N2 genes were detected at a 2 gc/rxn level, the E gene reaction had a slightly higher threshold at 14 gc/rxn (Kolarević et al., 2021). The verified sample limit of detection (SLOD) for the N2 region was 3.47 × 10² gc/L raw sample. The sample limit of quantification (SLOQ) was determined for an individual measurement batch based on the calibration point data that gave Ct values ≤40. Samples for which the measured concentration was above the SLOD but below the SLOQ were extrapolated based on the calibration equation and are shown in Table 4, Table 5, Table 6, Table 7.
Table 4.
Results of RT-qPCR amplification shown as gc/L of SARS-CoV-2 target gene in Group I samples (calculation is based on N2 primer set) and observed quality assessment (above SLOD or above SLOQ).
| Sample code | Genetic region detected | gc/L | Quality assessment | SLOQ (gc/L) |
|---|---|---|---|---|
| B-1220-7.00 | N2 | 4.22E+03 | >SLOD | 1.44E+04 |
| B-1220-8.00 | N2 | 3.58E+03 | >SLOD | 1.44E+04 |
| B-1220-9.00 | N2 | 7.34E+03 | >SLOD | 1.44E+04 |
| B-1220-10.00 | N2 | 6.17E+03 | >SLOD | 1.44E+04 |
| B-1220-11.00 | N2 | 1.05E+04 | >SLOD | 1.93E+04 |
| B-1220-12.00 | N2 | 5.17E+03 | >SLOD | 1.02E+04 |
| B-1220-13.00 | N2 | 7.83E+03 | >SLOD | 1.02E+04 |
| B-1220-14.00 | N2 | 4.60E+03 | >SLOD | 1.02E+04 |
| B-1220-15.00 | – | – | – | |
| B-1220-16.00 | N2,E | 1.28E+04 | >SLOQ | 8.47E+03 |
| B-1220-17.00 | N2 | 6.56E+03 | >SLOD | 8.47E+03 |
| B-1220-18.00 | N2 | 8.97E+03 | >SLOQ | 8.47E+03 |
Table 5.
Results of RT-qPCR amplification shown as gc/L of SARS-CoV-2 target gene in Group II samples (calculation is based on the N2 primer set) and observed quality assessment (above SLOD or SLOQ).
| Sample code | Site | Genetic region detected | gc/L | Quality assessment | SLOQ (gc/L) |
|---|---|---|---|---|---|
| B-0221-0 | S7 us outlet | – | – | – | |
| B-0221-1 | S7 ds outlet | N2 | 1.18E+04 | >SLOD | 2.07E+04 |
| B-0221-2 | S7a | – | – | – | |
| B-0221-3 | S7b | – | – | – | |
| B-0221-4 | S9 | N2 | 5.66E+02 | >SLOD | 1.21E+04 |
| B-0221-5 | S9b | N2 | 1.05E+04 | >SLOD | 4.42E+04 |
Table 6.
Results of RT-qPCR amplification shown as gc/L of the SARS-CoV-2 target gene in Group III samples (calculation is based on the N2 primer set) and the observed quality of assessment (above SLOD and SLOQ).
| Sample code | Sampling date | Genetic region detected | gc/L | quality assessment | SLOQ (gc/L) |
|---|---|---|---|---|---|
| B-090321 | 3/9/21 | N2 | 1.50E+04 | >SLOQ | 8.47E+03 |
| B-120321 | 3/12/21 | – | – | – | |
| B-160321 | 3/16/21 | N2 | 1.12E+04 | >SLOD | 2.42E+04 |
| B-190321 | 3/19/21 | – | – | – | |
| B-220321 | 3/22/21 | N2 | 1.51E+04- | >SLOD | 1.76E+04 |
| B-250321 | 3/25/21 | N2 | 1.01E+04 | >SLOD | 2.40E+04 |
| B-290321 | 3/29/21 | N2,N1,E | 6.86E+03 | >SLOD | 2.85E+04 |
| B-020421 | 4/2/21 | N2,N1,E | 3.01E+04 | >SLOD | 2.85E+04 |
| B-050421 | 4/5/21 | – | – | – | |
| B-090421 | 4/9/21 | N2 | 1.52E+04 | >SLOD | 4.42E+04 |
| B-130421 | 4/13/21 | – | – | – | |
| B-160421 | 4/16/21 | N2 | 1.13E+03 | >SLOD | 1.21E+04 |
| B-190421 | 4/19/21 | – | – | – | |
| B-220421 | 4/22/21 | – | – | – | |
| B-010521 | 5/1/21 | N2,N1,E | 8.62E+04 | >SLOQ | 2.07E+04 |
| B-060521 | 5/6/21 | N2 | 1.88E+04 | >SLOD | 2.07E+04 |
| B-120521 | 5/12/21 | – | – | – | |
| B-200521 | 5/20/21 | – | – | – | |
| B-280521 | 5/28/21 | – | – | – | – |
Table 7.
Results of RT-qPCR amplification shown as gc/L of SARS-CoV-2 target gene in Group IV samples (calculation is based on the N2 primer set) and observed quality assessment (above SLOD and SLOQ).
| Sample code | Sampling date | Genetic region detected | gc/L | Quality assessment | SLOQ (gc/L) |
|---|---|---|---|---|---|
| S8 | 3/29/21 | N2,N1,E | 1.02E+04 | >SLOD | 2.85E+04 |
| S1 | 3/31/21 | N2,N1,E | 1.42E+04 | >SLOD | 2.85E+04 |
| S2 | 3/31/21 | N2,N1,E | 1.75E+04 | >SLOD | 4.23E+04 |
| S5 | 3/31/21 | N2,E | 1.03E+04 | >SLOD | 4.23E+04 |
| S4 | 3/31/21 | N2 | 1.25E+04 | >SLOD | 4.23E+04 |
| S3 | 3/31/21 | N2,N1,E | 1.05E+04 | >SLOD | 4.23E+04 |
| S6 | 4/2/21 | N2,N1,E | 3.73E+04 | >SLOD | 4.42E+04 |
The recovery efficiency was assessed by adding 9.6 × 10² genomic copies of heat inactivated viral material (ATCC Heat Inactivated 2019 Novel Coronavirus VR-1986HK, (ATCC, USA) to each sample. The recovery efficiency was calculated based on the copies quantified by RT-qPCR as follows:
and was found to be on average 10.4 % (standard deviation 6.3 %) for the negative samples.
Inhibition was checked by observing the Ct values of the spiked samples in the recovery study and comparing them to Ct values of samples, that were 8-fold diluted. The expected increase in Ct values of the diluted samples was theoretically 3 but due to the low viral concentrations and the background natural contamination a positive shift was accepted as indication of lack of presence of inhibitors. Data on the calibration and reaction efficiencies of the SARS-CoV-2 N2 assays are provided in Supplementary Table 6. Data on inhibition and recovery data for the SARS-CoV-2 N2 assay are provided in Supplementary Table 7.
2.6. Epidemiological background
Data were obtained from https://www.worldometers.info/coronavirus/country/serbia/, official national data (https://covid19.rs/), the European Centre for Disease Prevention and Control (ECDC) and Serbian public news reports.
3. Results and discussion
3.1. General overview of the results
A total of 12 sites were investigated to identify good WBE candidates for sampling spots on rivers as an alternative to the sampling of wastewater treatment plant effluents. The major criteria were that the sites were situated near to the major outlets, that they were predominantly influenced by nearly fresh human sewage and minimally affected by dilution by the river or affected by faecal pollution of animal origin. At all sites, the prevalence of human-associated pollution was recorded (Fig. 2 ). The median for the BacHum marker (7.61 log (ME+1)/100 mL) in all samples was several logarithms higher in comparison to the median for the animal-associated markers (the BacR and Pig2Bac medians were 0 and 2.59 log (ME+1)/100 mL, respectively). Table 3 summarises data on the measured SFIBs and BacHum markers. It is evident that the sites were under different levels of pollution pressure. The sites under maximum human influence were S1, S2, S6, S8, S9 and S7 ds outlets. At these sites, the concentrations of E. coli (5.8 to 7.2 log MPN/100 mL) and the BacHum marker (7.6 to 9.1 log (ME+1)/100 mL) were in the range of those reported in the literature for raw wastewaters (E. coli 6.1 log MPN/100 mL and BacHum 8.6 log (ME+1)/100 mL (Mayer et al., 2016)), and several logarithms higher in comparison to the median values for the whole Danube (E. coli 2.4 log MPN/100 mL and BacHum 3.8 log (ME+1)/100 mL, as reported in Kirschner et al. (2017)) which marks these sites as primary candidates for surveillance.
Fig. 2.
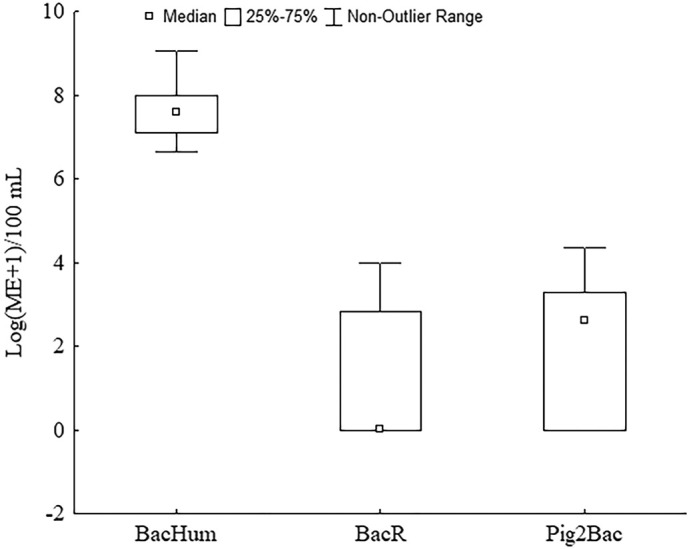
Results of MST marker analyses for all samples expressed as marker equivalents (log (ME+1)/100 mL) for human- (BacHum), ruminant- (BacR) and pig- (Pig-2-Bac) associated genetic faecal markers.
Table 3.
Numbers of standard faecal indicator bacteria (E. coli and intestinal enterococci expressed as log MPN/100 mL) and the microbial source tracking marker BacHum expressed as log (ME+1)/100 mL.
| Group/site | E. coli | E. faecalis | BacHum |
|---|---|---|---|
| Leterature datac | |||
| Raw WW | 6.1a | 4.8a | 8.6a |
| Treated WW | 3.8a | 3.4a | 6.4a |
| Danube-whole river | 2.4b | 1.5b | 3.8b |
| Danube-annual ds Belgrade | 3.5b | 2.9b | 5.0b |
| Group Ic | |||
| S9 | 5.9 | 5.1 | 8.1 |
| Group IId | |||
| S7 us outlet | 3.2 | 2.6 | 5.0 |
| S7 ds outlet | 6.8 | 6.0 | 8.4 |
| S7a | 3.6 | 2.8 | 5.4 |
| S7b | 3.7 | 2.5 | 5.2 |
| S9 | 5.3 | 4.1 | 6.6 |
| S9b | 4.1 | 2.8 | 5.8 |
| Group IIIc | |||
| S9 | 5.8 | 5.0 | 7.6 |
| Group IVd | |||
| S1 | 6.1 | 5.2 | 8.1 |
| S2 | 7.2 | 6.5 | 9.1 |
| S3 | 5.9 | 4.8 | 7.6 |
| S4 | 5.5 | 3.8 | 7.0 |
| S5 | 5.1 | 3.6 | 6.7 |
| S6 | 6.0 | 5.1 | 7.7 |
| S8 | 6.5 | 5.1 | 7.7 |
median value of multiple measurments.
single measurement.
Out of 44 samples analysed for the current study, 31 were positive for at least one of the SARS-CoV-2 target regions. In the positive samples, the N2 region was detected in 31, the N1 region in 8, and the E region in 10 samples, respectively. Discrepancies in the sensitivity of the applied primer sets have been reported by other authors (Ahmed et al., 2021a; Medema et al., 2020; Nalla et al., 2020), but to our knowledge it is unknown if the reason for this is variability in the performance of the assays or due to degradation in the target genetic material (Philo et al., 2021). Lu et al. (2020) had demonstrated that the N2 assay had less nucleotide mismatches than the N1 assay when compared with 7158 available SARS-CoV-2 genome data and this could result in changes in PCR efficiencies when starting out with difficult matrices like environmental samples. Environmental factors such as temperature and pH can also significantly impact longevity of viral RNA in the environment which should not be neglected at this point (Jakariya et al., 2021). Although most authors reported higher sensitivity for the N1 primer set (Ahmed et al., 2021a; Medema et al., 2020), the results of our study are in favour of the N2 primer set. Of the 31 samples yielding positive results for N2, the quality assessment revealed for 27 samples that the determined concentrations were at the SLOD and only 4 samples were at the SLOQ. Similarly, the study by Hata et al. (2021) reported that for most tested wastewater samples the quality assessments were at the LOD. This significantly impacts the interpretation of the obtained dataset and establishment of the model in relation to other monitored parameters. However, only a few of the studies dealing with the detection of coronavirus RNA in wastewaters properly addressed LOD and LOQ. Bivins et al. (2021) reviewed the data published in 125 preprint and peer-reviewed publications concerning wastewater surveillance for SARS-CoV-2 RNA. A LOQ value was reported for only 19 % of the RT-qPCR assays. If LOQ values were reported, they ranged from 5 to >10,000 gc/rxn. Additionally, when multiple RT-qPCR assays were used in a single publication, the reported LOD and LOQ values were often not attributed to a specific assay.
3.2. Group I – hourly variations related to the frequency and timing of defecation
Ahmed et al. (2021a) indicated that sampling design is a pivotal factor for detecting SARS-CoV-2 RNA as it is expected to vary diurnally, based on defecation frequency and timing. It is expected that samples collected during periods of peak faecal loading may be more enriched in SARS-CoV-2 RNA. Therefore, samples were collected every hour and SFIBs were used as an indication of the faecal load of the samples. Sampling for the determination of possible effects of hourly variations on the detection frequency of SARS-CoV-2 targets (Group I samples) was performed in the 50th week of 2020 when the 14-day incidence rate in Serbia was 1396 per 100,000 citizens according to the ECDC. On the date of sampling, the number of new cases in Serbia was 7393 (Fig. 3 ).
Fig. 3.

Number of new COVID-19 cases in Serbia reported per day, sampling dates for Group I samples are marked in green, those for Group II are marked in blue, for Group III in red, and for Group IV in yellow (data retrieved from https://www.worldometers.info/coronavirus/country/serbia/).
The major deviations in SFIB concentrations were observed in samples collected at 13.00 and 15.00 h. The trend in the variation of SFIB was not followed by the MST marker; thus, it should be taken into consideration that BacHum was not assessed in all samples (Fig. 4 ).
Fig. 4.
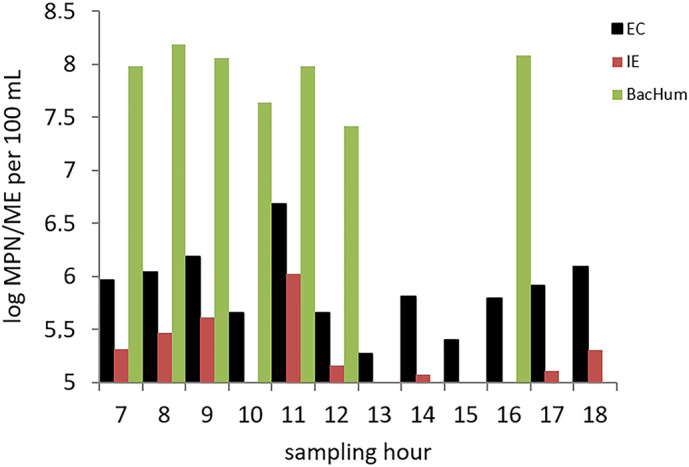
Numbers of standard faecal indicators (EC – E. coli and IE – intestinal enterococci expressed as log MPN/100 mL) and microbial source tracking markers (BacHum expressed as log (ME+1)/100 mL) in water samples from Group I.
It was expected that the faecal load peak would occur in the antemeridian as defecation in the general population is most frequent in the early morning (Heaton et al., 1992). Having in mind the additional retention time in the sewerage and the retention time from the outlet until the wastewater reaches the sampling point, the peak in E. coli concentration observed at 11.00 h was as expected. The concentration of SARS-CoV-2 RNA was assessed in each sample (Table 4 ). The N2 region was present in 11 of 12 investigated samples, but in 9, the concentration of RNA was above the SLOD but below the SLOQ. One of the samples that was negative for the presence of viral RNA (B-1220-15.00) was one of two samples with the lowest faecal load based on E. coli concentrations. The RNA concentration measured in the sample with the highest faecal load based on E. coli (B-1220-11.00) was one of the highest, but the concentration was below the SLOQ. Bearing in mind that the RNA concentration in most of the samples was above the SLOD but below the SLOQ, it is difficult to draw conclusions on the correlation between RNA concentration and faecal load. It was taken into account that SARS-CoV-2 RNA was not present in all samples and that in a composite sample prepared from these samples, all three regions (N1, N2 and E) were detectable, as previously reported (Kolarević et al., 2021). Composite samples have an advantage over grab samples, especially for sampling actions aiming to detect shedding by very few individuals (Ahmed et al., 2021a).
3.3. Group II – longitudinal impact of wastewaters on the Danube River
Previously, we observed that SARS-CoV-2 RNA was present in samples taken at the site directly affected by the wastewaters. Positive signals have not been detected for any of the primer sets in samples taken at the site situated 20 km downstream of Belgrade, suggesting the high dilution potential of the Danube River over the investigated stretch that was also reflected in the decline in concentrations of indicator bacteria (Kolarević et al., 2021). In this follow-up research we further investigated the spatial impact of wastewaters on the Danube River. Sampling for Group II commenced in the 8th week of 2021 with a 14-day incidence rate of 554 per 100,000 citizens.
At site S7, the concentrations of microbial indicators in samples collected upstream of the outlet (Table 3) were in the range characteristic for this section based on the values reported in Kirschner et al. (2017). The impact of the outlet at site 7 was evident by the >3 orders of magnitude increase in faecal indicators at the sampling location downstream of the outlet (marked as 7ds) compared to the location situated upstream of the outlet. The impact of wastewater was also evident according to the physicochemical parameters measured on site (change in temperature, conductivity and oxygen concentration, Supplementary Table S2). However, 2 km further downstream at site S7a, the concentrations of all faecal indicators and the values of physicochemical parameters were in line with those measured at location S7us, confirming the high dilution potential of the river. Further downstream, the impact of the wastewater outlets from sites S6 and S8 (with a combined amount of almost 100,000 p.e.) was evident at site S9 where an increase in E. coli values of two orders of magnitude was recorded.
Table 5 shows the data of the RT-qPCR amplification and SARS-CoV-2 copy number in those samples. Only the N2 region was found in 3 out of 6 investigated samples, while the concentrations were below the SLOQ. Given that the samples were collected at the start of the fourth wave of COVID-19, it is evident that only sites with a high wastewater impact should be used for surveillance. Considering that viral RNA was detected at site S9 and that the location is “an open river site” with a distance from outlets that enables mixing of wastewaters with the river water matrix, this site was chosen for collecting Group III samples.
3.4. Group III – temporal variations related to epidemiological and hydrometeorological factors
Although the analysis of composite samples has its advantages (Ahmed et al., 2021a), the preparation could be too demanding if an automated sampler cannot be installed. This was the case for all investigated sites in our study. Therefore, for grab samples, 11.00 h was chosen as the optimal time of sampling. Sampling for Group III samples started in the 10th week (with a 14-day incidence rate of 823 per 100,000 individuals) and ended in the 21st week (with a 14-day incidence rate of 83 per 100,000 persons) of 2021 when the peak of the fourth wave was reached in weeks 12 and 13 (14-day incidence rate of 999 and 960 per 100,000 people, respectively).
Data on the epidemiological, physicochemical and hydrometeorological parameters related to Group III samples is provided in Supplementary Table 3. Based on the bacterial faecal indicators, none of the samples in Group III were identified as an outlier. Based on 7 days of cumulative precipitation, three rainy periods were recorded (16th-22nd March, 19th April and 20th May), which was also reflected in the change in water level.
Table 6 provides an overview of the RT-qPCR amplification and SARS-CoV-2 copy number in samples. The N2 region was detected in 10 out of 19 analysed samples. In three samples, all three regions (N1, N2 and E) were present, of which two samples were taken in the 13th week of 2021 (peak of the fourth wave). Only in two out of 10 positive samples were target RNA concentrations above the SLOQ. The highest viral RNA concentration of 8.62 × 10⁴ gc/L was recorded in the sample taken on 1st May when the 14-day incidence rate was 440 per 100,000.
When examining the samples that were negative for SARS-CoV-2 RNA, a change in hydrometeorological conditions could provide an explanation for three samples: the sample taken on 19th March when 7 days of cumulative precipitation of 81 mm and an increase in the water level of 33 cm were recorded, and samples taken on 19th and 22nd of April, when 7 days of cumulative precipitation of 49 mm and an increase in the water level for 47 cm were recorded. The last three samples that were negative were taken during the tail of the fourth wave when the 14-day incidence rate was below 300 per 100,000 (last positive sample was taken on 6th May with a 14-day incidence of 341 per 100,000). This might provide information about the sensitivity of the used approach with respect to the threshold of active cases (assessed via a 14-day incidence) that needed to be reached for detection of viral RNA in the environment. To establish SARS-CoV-2 WBE as a reliable tool for early-warning and surveillance of the current or future COVID-19 outbreaks, the method's detection limit, precision, accuracy and reliability must meet certain criteria to be useful for public surveillance (Westhaus et al., 2021). Setting the presumptive threshold at 300 per 100,000 indicates that the approach is not as sensitive as the ones applied to wastewater in treatment plant inlets. The most striking example is the study of Hata et al. (2021) performed in Japan where SARS-CoV-2 was detected, even when the number of cases was <1.0 per 100,000. But at the EU level, the threshold currently set in Germany for wastewater surveillance is 50 acute cases per 100,000, which was reported in the study of Westhaus et al. (2021) in dry weather conditions.
The study of Ahmed et al. (2022) provides a simplified conceptual model that demonstrates the challenges of detecting SARS-CoV-2 RNA in a sewer system when the percentage of individuals excreting SARS-CoV-2 is relatively low. When assessing our dataset in light of the proposed model, it is indicative that the actual frequency of positive samples is higher in comparison with the frequency predicted by the model. However, the model indicates that the probability of all samples being negative is significantly reduced if the frequency of the collected samples is increased, which could be applied in further improving the sensitivity of the approach used in our study.
The study of Westhaus et al. (2021) shows that RNA load-based evaluations are reliable and capable of coping with variations in wastewater flow, e.g. storm water events in combined sewer systems. Indeed, herein we observed the impact of precipitation events within the sampling campaign in Group III. However, the studied set of parameters could not provide an explanation for three samples that were negative (12th March, 5th and 13th April).
3.5. Group IV – additional wastewater-affected locations along the Sava and Danube in Belgrade's urban area
Finally, we compared the situation recorded at site S9 with other sites in the urban area of Belgrade that are under the direct impact of untreated wastewaters. Group IV was sampled at the peak of the 4th wave in the 13th week of 2021 with a 14-day incidence rate of 960 per 100,000. The study of Ahmed et al. (2021b) reported the accumulation of SARS-CoV-2 genetic material along the sewer network from primary to tertiary drains, suggesting that monitoring of major drains could represent a city's health. The authors point out that the distance of sampling location in meters of the sewerage systems is not likely to have a significant impact on the detected gene concentration. Therefore, within Group IV, the focus was placed on the major outlets. Sewage plumes at the outlets and the extent of pollution along the riverbanks of the Sava and Danube can be observed on satellite images. The impact of wastewaters on water quality at the selected sites was evident from the concentrations of faecal indicators (Table 3). It is important to emphasize that these major outlets that are scattered in the central area of the city, are not properly isolated from trespassing, being close to pedestrian zones and in city parks, while some are situated in recreational areas and accessible to recreational fishermen, presenting a high risk of exposure or contact with the contaminated water.
In Group IV, a total of 7 sites was analysed (Table 7 ). All samples were positive for the N2 region with target RNA concentrations above the SLOD. The E region was found in 6 samples, while the N1 region was present in 5 samples. Based on the Ct values, it can be concluded that the concentration of viral RNA in the samples in Group IV was like the concentration of viral RNA in samples of Group III collected in the 13th week.
3.6. Guidance for surveillance – what have we learned
Challenges related to wastewater surveillance of SARS-CoV-2 in countries with poor sanitation is recognized and recent studies from different parts of the world deal with this topic (Ahmed et al., 2021b; De Araujo et al., 2021; Dharmadhikari et al., 2022; Pandey et al., 2021; Tandukar et al., 2021). To our knowledge this is the first study that investigates the practical application of surveillance in such a scenario, shifting the focus from wastewaters to surface waters as ultimate recipients. WBE monitoring and surveillance of COVID-19 and other future outbreaks is a challenge for developing countries as many households are not connected to sewer networks (Jakariya et al., 2021; Pandey et al., 2021). The present situation in Serbia is slightly better where only 54 % of the entire population is connected to public sewers (Kolarević et al., 2021). In our study, the examples of Topčiderska River (site S4) and Mirjevski Potok (site S6) indicate that smaller natural waterbodies, which serve as ultimate wastewater recipients, have the potential to be used for surveillance. The study of Guerrero-Latorre et al. (2020) is also in favour of this approach as SARS-CoV-2 RNA was detected in smaller watercourses in the urban area of Quito (i.e. the Machángara River), which receives wastewaters from Ecuador's capital. A similar study performed in Bangladesh (Jakariya et al., 2021) showed that in rural areas where a sewerage system is not available, channels and natural streams in municipalities for sewage drainage could be used for sampling.
The situation is more complex for rivers with significant discharge and dilution potential such as the Danube and Sava. The analysis of Group II samples demonstrated a high dilution potential of the Danube River but also stressed that the hydromorphological characteristics of the sampling sites play an important role. Therefore, sites with hydromorphological characteristics that maximally reduce the mixing of wastewaters and the river matrix should be preferred. In the case when multiple choices for selection of the outlets are available, the outlets of separate sewage systems should be focused in order to reduce the influence of hydrometeorological conditions. SFIBs and MST markers should be of high importance for the identification of sites with maximum human influence and in distinguishing between suitable sites affected by human raw sewage from unsuitable sites affected by diluted or treated human faecal pollution or influenced by background animal or surface runoff faecal pollution for WBE. Further, if the installation of an autosampler is not an option, SFIBs should be useful for assessment of the peak of the defecation period as an optimal period for sampling.
Limitations of the applied approach should also be addressed. From 44 analysed samples, SARS-CoV-2 RNA was detectable in 31 samples but only in 4 samples was the concentration above the SLOQ. In order to increase the performance of the applied approach and to attain quantitative instead of qualitative qPCR data, higher sample volumes and enrichment factors should be taken into consideration in further research. This would also lower the threshold (mean of the number of active cases) of the approach, which is based on our dataset at 300 per 100,000, as discussed above.
4. Conclusions
Our study provides a detailed insight into the potential of SARS-CoV-2 surveillance in surface waters for epidemiological purposes in countries with poor sanitation. The obtained results indicate that with proper selection of sampling sites and a tailor-made sampling strategy, surveillance of surface waters for SARS-CoV-2 RNA in countries with poor wastewater treatment has a potential epidemiological indicator function. The performance of the applied approach, including advanced sampling site characterization to trace and identify sites of significant raw sewage influence from human populations (e.g. faecal indicators and genetic source tracking markers), could be further improved by adaptation of the methodology for processing higher volumes of samples and enrichment factors, which should enable the acquisition of quantitative instead of qualitative data needed for WBE.
The following are the supplementary data related to this article.
Physical-chemical parameters measured in samples of the Group I and Group II.
Epidemiological, physical-chemical and hydro-meteorological parameters related to Group III samples.
Physical-chemical parameters measured in samples of the Group IV.
Primer-probe sets used for RT-qPCR assays.
Data on the calibration and reaction efficiencies of the SARS-CoV-2 N2 assays (Wolffs et al., 2004) for samples from Group I (green), Group II (blue), Group III (yellow) and Group IV (orange).
Inhibition and recovery data for the SARS-CoV-2 N2 assay.
CRediT authorship contribution statement
Stoimir Kolarević, Conceptualization, Methodology, Formal analysis, Investigation Formal analysis, Writing - Original Draft.
Adrienn Micsinai, Conceptualization, Methodology, Formal analysis, Investigation, Resources, Writing - Original Draft.
Réka Szántó-Egész, Methodology, Investigation, Formal analysis.
Alena Lukács, Methodology, Investigation, Formal analysis.
Margareta Kračun-Kolarević, Conceptualization, Methodology, Investigation, Resources, Visualization.
Ana Djordjevic, Conceptualization, Writing - Original Draft.
Danijela Vojnović-Milutinović Conceptualization, Writing - Original Draft.
Alexander K.T. Kirschner, Methodology, Validation, Resources.
Andreas A.H. Farnleitner, Validation, Writing - Review & Editing.
Rita Linke Methodology, Validation, Writing - Review & Editing.
Aleksandar Djukić, Conceptualization, Formal analysis, Writing - Original Draft.
Jovana Kostić-Vuković Methodology, Resources.
Jovana Jovanović Marić, Methodology, Validation.
Momir Paunović, Conceptualization, Resources, Writing - Original Draft, Supervision.
Declaration of competing interest
The authors declare that they have no conflicts of interest.
Acknowledgements
This study was funded by the Ministry of Education, Science and Technological Development of Republic of Serbia, Grant Nos. 451-03-68/2020-14/200007, 451-03-9/2021-14/200007 and 451-03-68/2022-14/200007, the bilateral project of the Republic of Serbia and the Republic of Austria 2019-2021 (WTZ-SRB12-2018), and the Austrian Science Fund (FWF) Project P32464. We would like to acknowledge the assistance of colleagues Dr. Karolina Sunjog and PhD student Jelena Đorđević in the field work.
Editor: Damia Barcelo
Footnotes
Interuniversity Cooperation Center Water and Health (ICC): www.waterandhealth.at.
References
- Ahmed F., Islam M.A., Kumar M., Hossain M., Bhattacharya P., Islam M.T., Hossen F., Hossain M.S., Islam M.S., Uddin M.M., Islam M.N., Bahadur N.M., Didar-ul-Alam M., Reza H.M., Jakariya M. First detection of SARS-CoV-2 genetic material in the vicinity of COVID-19 isolation Centre in Bangladesh: variation along the sewer network. Sci. Total Environ. 2021;776 doi: 10.1016/j.scitotenv.2021.145724. [DOI] [PMC free article] [PubMed] [Google Scholar]
- Ahmed W., Bivins A., Bertsch P.M., Bibby K., Gyawali P., Sherchan S.P., Simpson S.L., Thomas K.V., Verhagen T.R., Kitajima M., Mueller J.F., Korajkic A. Intraday variability of indicator and pathogenic viruses in 1-h and 24-h composite wastewater samples: implications for wastewater-based epidemiology. Environ. Res. 2021;193 doi: 10.1016/j.envres.2020.110531. [DOI] [PMC free article] [PubMed] [Google Scholar]
- Ahmed W., Simpson S., Bertsch P., Bibby K., Bivins A., Blackall L., Bofill-Mas S., Bosch A., Ciesielski M., Donner E., D’Souza N., Farnleitner A., Gerrity D., Gonzalez R., Griffith J., Gyawali P., Haas C., Hamilton K., Hapuarachchi C., Harwood V., Haque R., Jackson G., Khan S., Khan W., Kitajima M., Korajkic A., LaRosa G., Layton B., Lipp E., McLellan S., McMinn B., Medema G., Metcalfe S., Meijer W., Mueller J., Murphy H., Naughton C., Noble R., Payyappat S., Petterson S., Pitkanen T., Rajal V., Reyneke B., Roman F., Rose J., Rusinol M., Sadowsky M., Sala-Comorera L., Setoh Y., Sherchan S., Sirikanchana K., Smith W., Steele J., Sabburg R., Symonds E., Thai P., Thomas K., Tynan J., Toze S., Thompson J., Whiteley A., Wong J., Sano D., Wuertz S., Xagoraraki I., Zhang Q., Zimmer-Faust A., Shanks O. Minimizing errors in RT-PCR detection and quantification of SARS-CoV-2 RNA for wastewater surveillance. Sci. Total Environ. 2022;805 doi: 10.1016/j.scitotenv.2021.149877. [DOI] [PMC free article] [PubMed] [Google Scholar]
- Barceló D. Wastewater-based epidemiology to monitor COVID-19 outbreak: present and future diagnostic methods to be in your radar. Case Stud. Chem. Environ. Eng. 2020;2 doi: 10.1016/j.cscee.2020.100042. [DOI] [PMC free article] [PubMed] [Google Scholar]
- Bibby K., Bivins A., Wu Z., North D. Making waves: plausible lead time for wastewater based epidemiology as an early warning system for COVID-19. Water Res. 2021;117438 doi: 10.1016/j.watres.2021.117438. [DOI] [PMC free article] [PubMed] [Google Scholar]
- Bivins A., Kaya D., Bibby K., Simpson S.L., Bustin S.A., Shanks O.C., Ahmed W. Variability in RT-qPCR assay parameters indicates unreliable SARS-CoV-2 RNA quantification for wastewater surveillance. Water Res. 2021;203 doi: 10.1016/j.watres.2021.117516. [DOI] [PMC free article] [PubMed] [Google Scholar]
- Corman V.M., Landt O., Kaiser M., Molenkamp R., Meijer A., Chu D.K., Bleicker T., Brünink S., Schneider J., Schmidt M.L., Mulders D., Haagmans B.L., Veer B., van den Brink S., Wijsman L., Goderski G., Romette J.L., Ellis J., Zambon M., Peiris M., Goossens H., Reusken C., Koopmans M., Drosten C. Detection of 2019 novel coronavirus (2019-nCoV) by real-time RT-PCR. Euro Surveill. 2020;25 doi: 10.2807/1560-7917.ES.2020.25.3.2000045. [DOI] [PMC free article] [PubMed] [Google Scholar]
- De Araujo J.C., Gavazza S., Leao T.L., Florencio L., Da Silva H.P., De Oliveira Albuquerque J., De Lira Borges M.A., De Oliveira Alves R.B., Alves Rodrigues R.H., Dos Santos E.B. SARS-CoV-2 sewage surveillance in low-income countries: potential and challenges. J. Water Health. 2021;19:1–19. [Google Scholar]
- Dharmadhikari T., Rajput V., Yadav R., Boargaonkar R., Patil D., Kale S., Kamble P., Dastager S., Dharne M.S. High throughput sequencing based direct detection of SARS-CoV-2 fragments in wastewater of Pune, West India. Sci. Total Environ. 2022;807 doi: 10.1016/j.scitotenv.2021.151038. [DOI] [PMC free article] [PubMed] [Google Scholar]
- EU Commission . 2021. Recommendation on a common approach to establish a systematic surveillance of SARS-CoV-2 and its variants in wastewaters in the EU. [Google Scholar]
- Foladori P., Cutrupi F., Segata N., Manara S., Pinto F., Malpei F., Bruni L., La Rosa G. SARS-CoV-2 from faeces to wastewater treatment: what do we know? A review. Sci. Total Environ. 2020;743 doi: 10.1016/j.scitotenv.2020.140444. [DOI] [PMC free article] [PubMed] [Google Scholar]
- Gonzalez R., Curtis K., Bivins A., Bibby K., Weir M.H., Yetka K., Thompson H., Keeling D., Mitchell J., Gonzalez D. COVID-19 surveillance in Southeastern Virginia using wastewater-based epidemiology. Water Res. 2020;186 doi: 10.1016/j.watres.2020.116296. [DOI] [PMC free article] [PubMed] [Google Scholar]
- Griffiths R.I., Whiteley A.S., O'Donnell A.G., Bailey M.J. Rapid method for coextraction of DNA and RNA from natural environments for analysis of ribosomal DNA-and rRNA-based microbial community composition. Appl. Environ. Microbiol. 2000;66:5488–5491. doi: 10.1128/aem.66.12.5488-5491.2000. [DOI] [PMC free article] [PubMed] [Google Scholar]
- Guerrero-Latorre L., Ballesteros I., Villacrés-Granda I., Granda M.G., Freire-Paspuel B., Ríos-Touma B. SARS-CoV-2 in river water: implications in low sanitation countries. Sci. Total Environ. 2020;743 doi: 10.1016/j.scitotenv.2020.140832. [DOI] [PMC free article] [PubMed] [Google Scholar]
- Hata A., Hara-Yamamura H., Meuchi Y., Imai S., Honda R. Detection of SARS-CoV-2 in wastewater in Japan during a COVID-19 outbreak. Sci. Total Environ. 2021;758 doi: 10.1016/j.scitotenv.2020.143578. [DOI] [PMC free article] [PubMed] [Google Scholar]
- Heaton K.W., Radvan J., Cripps H., Mountford R.A., Braddon F.E., Hughes A.O. Defecatio frequency and timing, and stool form in the general population: a prospective study. Gut. 1992;33:818–824. doi: 10.1136/gut.33.6.818. [DOI] [PMC free article] [PubMed] [Google Scholar]
- Jakariya M., Ahmed F., Islam M.A., Ahmed T., Al Marzan A., Hossain M., Reza H., Bhattacharya P., Nahla T., Bahadur N.M., Hasan M.N., Islam M.T., Hossen F., Didar-ul-Alam M., Mow N., Jahan H. 2021. Wastewater based surveillance system to detect SARS-CoV-2 genetic material for countries with on-site sanitation facilities: an experience from Bangladesh. medRxiv. [DOI] [Google Scholar]
- Kildare B.J., Leutenegger C.M., McSwain B.S., Bambic D.G., Rajal V.B., Wuertz S. 16S rRNA-based assays for quantitative detection of universal, human-, cow-, and dog-specific faecal bacteroidales: a Bayesian approach. Water Res. 2007;41:3701–3715. doi: 10.1016/j.watres.2007.06.037. [DOI] [PubMed] [Google Scholar]
- Kirschner A.K.T., Reischer G.H., Jakwerth S., Savio D., Ixenmaier S., Toth E., Sommer R., Mach R., Linke R., Eiler A., Kolarevic S., Farnleitner A.H. Multiparametric monitoring of microbial faecal pollution reveals the dominance of human contamination along the whole Danube River. Water Res. 2017;124:543–555. doi: 10.1016/j.watres.2017.07.052. [DOI] [PMC free article] [PubMed] [Google Scholar]
- Kolarević S., Micsinai A., Szántó-Egész R., Lukács A., Kračun-Kolarević M., Lundy L., Kirschner A.K.T., Farnleitner A., Djukic A., Čolić J., Nenin T., Sunjog K., Paunović M. Detection of SARS-CoV-2 RNA in the Danube River in Serbia associated with the discharge of untreated wastewaters. Sci. Total Environ. 2021;783 doi: 10.1016/j.scitotenv.2021.146967. [DOI] [PMC free article] [PubMed] [Google Scholar]
- Kumar M., Joshi M., Patel A.K., Joshi C.G. Unravelling the early warning capability of wastewater surveillance for COVID-19: a temporal study on SARS-CoV-2 RNA detection and need for the escalation. Environ. Res. 2021;196 doi: 10.1016/j.envres.2021.110946. [DOI] [PMC free article] [PubMed] [Google Scholar]
- Kumar M., Joshi M., Shah A.V., Srivastava V., Dave S. Wastewater surveillance-based city zonation for effective COVID-19 pandemic preparedness powered by early warning: a perspectives of temporal variations in SARS-CoV-2-RNA in Ahmedabad, India. Sci. Total Environ. 2021;148367 doi: 10.1016/j.scitotenv.2021.148367. [DOI] [PMC free article] [PubMed] [Google Scholar]
- Lu X., Wang L., Sakthivel S.K., Whitaker B., Murray J., Kamili S., Lynch B., Malapati L., Burke S.A., Harcourt A., Tamin A., Thornburg N.J., Villanueva J.M., Lindstrom S. US CDC real-time reverse transcription PCR panel for detection of severe acute respiratory syndrome coronavirus 2. Emerg. Infect. Dis. 2020;26:1654–1665. doi: 10.3201/eid2608.201246. [DOI] [PMC free article] [PubMed] [Google Scholar]
- Lundy L., Kassinos D.F., Slobodnik J., Karaolia P., Cirka L., Kreuzinger N., Castiglioni S., Bijlsma L., Dulio V., Deviller G., Lai F.Y., Alygizakis N., Barneo M., Baz-Lomba J.A., Béen F., Cíchová M., Conde K., Covaci A., Donner E., Ficek A., Hassard F., Hedström A., Hernandez F., Janská V., Jellison K., Hofman J., Hill K., Hong P., Kasprzyk-Hordern B., Kolarević S., Krahulec J., Lambropoulou D., de Llanos R., Mackuľak T., Martinez-García T.L., Martínez F., Medema G., Micsinai A., Nozal L., Myrmel M., Nasser M., Niederstaetter H., Oberacher H., Očenášková V., Ogorzaly L., Peinado B., Pitkänen T., Papadopoulos D., Poza M., Rumbo-Feal S., Sánchez B., Székely A.J., Soltysova A., Thomaidis N.S., Vallejo H., van Nuijs A., Ware V., Viklander M. Making waves: collaboration in the time of SARS-CoV-2 -rapid development of an international wastewater surveillance dataset to support public health decision-making. Water Res. 2021 doi: 10.1016/j.watres.2021.117167. [DOI] [PMC free article] [PubMed] [Google Scholar]
- Master Plan of the Belgrade Sewerage System . 2011. Belgrade Land Development Agency, Belgrade, Serbia (in Serbian) [Google Scholar]
- Mayer R.E., Bofill-Mas S., Egle L., Reischer G.H., Schade M., Fernandez-Cassi X., Fuchs W., Mach R.L., Lindner G., Kirschner A., Gaisbauer M., Piringer H., Blanschke A.P., Girones R., Zessner M., Sommer R., Farnleitner A.H. Occurrence of human-associated Bacteroidetes genetic source tracking markers in raw and treated wastewater of municipal and domestic origin and comparison to standard and alternative indicators of faecal pollution. Water Res. 2016;90:265–276. doi: 10.1016/j.watres.2015.12.031. [DOI] [PMC free article] [PubMed] [Google Scholar]
- Mayer E., Reischer G., Ixenmaier S., Derx J., Blaschke A., Edbon J., Linke R., Egle L., Ahmed W., Blanch A., Byamuka D., Savill M., Mushi D., Cristobal H., Edge T., Schade M., Aslan A., Brooks Y., Sommer R., Masago Y., Sato M., Taylor H., Rose J., Wuertz S., Shanks O., Piringer H., Mach R., Savio D., Zessner M., Farnleitner A. Global distribution of human-associated faecal genetic markers in reference samples from six continents. Environ. Sci. Technol. 2018;52:5076–5084. doi: 10.1021/acs.est.7b04438. [DOI] [PMC free article] [PubMed] [Google Scholar]
- Medema G., Heijnen L., Elsinga G., Italiaander R., Brouwer A. Presence of SARS-Coronavirus-2 in sewage. Environ. Sci. Technol. Lett. 2020 doi: 10.1021/acs.estlett.0c00357. [DOI] [PubMed] [Google Scholar]
- Mieszkin S., Furet J.P., Corthier G., Gourmelon M. Estimation of pig faecal contamination in a river catchment by real-time PCR using two pig-specific bacteroidales 16S rRNA genetic markers. Appl. Environ. Microbiol. 2009;75:3045–3054. doi: 10.1128/AEM.02343-08. [DOI] [PMC free article] [PubMed] [Google Scholar]
- Nalla A.K., Casto A.M., Huang M.-L.W., Perchetti G.A., Sampoleo R., Shrestha L., Wei Y., Zhu H., Jerome K.R., Greninger A.L. Comparative performance of SARS-CoV-2detection assays using seven different primer-probe sets and one assay kit. J. Clin. Microbiol. 2020;58 doi: 10.1128/JCM.00557-20. [DOI] [PMC free article] [PubMed] [Google Scholar]
- Official Gazette of the Republic of Serbia No.74/2011 . 2011. Regulation on the parameters of ecological and chemical status of surface water and parameters of the chemical and quantitative status of groundwater. [Google Scholar]
- Pandey D., Verma S., Verma P., Mahanty B., Dutta K., Daverey A., Arunachalam K. SARS-CoV-2 in wastewater: challenges for developing countries. Int. J. Hyg. Environ. Health. 2021;231 doi: 10.1016/j.ijheh.2020.113634. [DOI] [PMC free article] [PubMed] [Google Scholar]
- Philo S.E., Keim E.K., Swanstrom R., Ong A.Q., Burnor E.A., Kossik A.L., Harrison J.C., Demeke B.A., Zhou N.A., Beck N.K., Shirai J.H., Meschke J.S. A comparison of SARS-CoV-2 wastewater concentration methods for environmental surveillance. Sci. Total Environ. 2021;760 doi: 10.1016/j.scitotenv.2020.144215. [DOI] [PMC free article] [PubMed] [Google Scholar]
- Reischer G.H., Kasper D.C., Steinborn R., Mach R.L., Farnleitner A.H. Quantitative PCR method for sensitive detection of ruminant faecal pollution in freshwater and evaluation of this method in alpine karstic regions. Appl. Environ. Microbiol. 2006;72:5610–5614. doi: 10.1128/AEM.00364-06. [DOI] [PMC free article] [PubMed] [Google Scholar]
- Reischer G.H., Kasper D.C., Steinborn R., Farnleitner A.H., Mach R.L. A quantitative real-time PCR assay for the highly sensitive and specific detection of human faecal influence in spring water from a large alpine catchment area. Let. Appl. Microbiol. 2007;44:351–356. doi: 10.1111/j.1472-765X.2006.02094.x. [DOI] [PMC free article] [PubMed] [Google Scholar]
- Reischer G.H., Haider J.M., Sommer R., Stadler H., Keiblinger K.M., Hornek R., Zerobin W., Mach R.L., Farnleitner A.H. Quantitative microbial faecal source tracking with sampling guided by hydrological catchment dynamics. Environ. Microbiol. 2008;10:2598–2608. doi: 10.1111/j.1462-2920.2008.01682.x. [DOI] [PMC free article] [PubMed] [Google Scholar]
- Rimoldi S.G., Stefani F., Gigantiello A., Polesello S., Comandatore F., Mileto D., Maresca M., Longobardi C., Mancon A., Romeri F., Pagani C., Moja L., Gismondo M.R., Salerno F. Presence and vitality of SARS-CoV-2 virus in wastewaters and rivers. Sci. Total Environ. 2020 doi: 10.1016/j.scitotenv.2020.140911. [DOI] [PMC free article] [PubMed] [Google Scholar]
- Sherchan S.P., Shahin S., Ward L.M., Tandukar S., Aw T.G., Schmitz B., Warish A., Kitajima M. First detection of SARS-CoV-2 RNA in wastewater in North America: a study in Louisiana, USA. Sci. Total Environ. 2020;743 doi: 10.1016/j.scitotenv.2020.140621. [DOI] [PMC free article] [PubMed] [Google Scholar]
- Sherchan S.P., Shahin S., Patel J., Ward L.M., Tandukar S., Uprety S., Schmitz B., Ahmed W., Simpson S., Gyawali P. Occurrence of SARS-CoV-2 RNA in six municipal wastewater treatment plants at the early stage of COVID-19 pandemic in the United States. Pathogens. 2021;10:798. doi: 10.3390/pathogens10070798. [DOI] [PMC free article] [PubMed] [Google Scholar]
- Tandukar S., Khanal R., Manandhar R., Pandey A., Sthapit N., Sherchan S.P., Haramoto E. Possibility of detection of severe acute respiratory syndrome coronavirus 2 (SARS-CoV-2) through wastewater in developing countries. Water. 2021;13:3412. [Google Scholar]
- US Centers for Disease Control and Prevention . 2019. Novel Coronavirus (2019-nCoV) Real-time rRT-PCR Panel Primers And Probes. Last accessed Mar 24, 2020. [Google Scholar]
- Westhaus S., Weber F.A., Schiwy S., Linnemann V., Brinkmann M., Widera M., Greve C., Janke A., Hollert H., Wintgens T., Ciesek S. Detection of SARS-CoV-2 in raw and treated wastewater in Germany–suitability for COVID-19 surveillance and potential transmission risks. Sci. Total Environ. 2021;751 doi: 10.1016/j.scitotenv.2020.141750. [DOI] [PMC free article] [PubMed] [Google Scholar]
- WHO 2022. https://covid19.who.int/ (assessed on 28.05.2022.)
- Wolffs P., Grage H., Hagberg O., Radstrom P. Impact of DNA polymerases and their buffer systems on quantitative real-time PCR. J. Clin. Microbiol. 2004;42:408–411. doi: 10.1128/JCM.42.1.408-411.2004. [DOI] [PMC free article] [PubMed] [Google Scholar]
Associated Data
This section collects any data citations, data availability statements, or supplementary materials included in this article.
Supplementary Materials
Physical-chemical parameters measured in samples of the Group I and Group II.
Epidemiological, physical-chemical and hydro-meteorological parameters related to Group III samples.
Physical-chemical parameters measured in samples of the Group IV.
Primer-probe sets used for RT-qPCR assays.
Data on the calibration and reaction efficiencies of the SARS-CoV-2 N2 assays (Wolffs et al., 2004) for samples from Group I (green), Group II (blue), Group III (yellow) and Group IV (orange).
Inhibition and recovery data for the SARS-CoV-2 N2 assay.