

ABSTRACT
Background and Objective
Patients with dementia with Lewy bodies (DLB) may have overlapping Alzheimer's disease pathology. We investigated the longitudinal rate of tau accumulation and its association with neurodegeneration and clinical disease progression in DLB.
Methods
Consecutive patients with probable DLB (n = 22) from the Mayo Clinic Alzheimer's Disease Research Center and age‐matched and sex‐matched cognitively unimpaired controls (CU; n = 22) with serial magnetic resonance imaging and flortaucipir positron emission tomography scans within an average of 1.6 years were included. Regional annualized rates of flortaucipir uptake standardized uptake value ratios (SUVr) were calculated. Regional annualized rates of cortical volume change were measured with the Tensor Based Morphometry–Syn algorithm.
Results
The annual increase of flortaucipir SUVr was greater in the middle and superior occipital, fusiform, and inferior parietal cortices in DLB (mean: 0.017, 0.019, 0.019, and 0.015, respectively) compared with the CU (mean: −0.006, −0.009, −0.003, and − 0.005, respectively; P < 0.05). In patients with DLB (but not the CU), a longitudinal increase in flortaucipir SUVr was associated with longitudinal cortical atrophy rates in the lateral occipital and inferior temporoparietal cortices, hippocampus, and the temporal pole as well as a concurrent decline on Mini‐Mental State Examination and Clinical Dementia Rating–Sum of Boxes in the lateral occipital and the fusiform cortices.
Conclusions
Tau accumulation was faster in DLB compared with the CU, with increased accumulation rates in the lateral occipital and temporoparietal cortices. These increased rates of tau accumulation were associated with neurodegeneration and faster disease progression in DLB. Tau may be a potential treatment target in a subset of patients with DLB. © 2022 The Authors. Movement Disorders published by Wiley Periodicals LLC on behalf of International Parkinson and Movement Disorder Society
Keywords: dementia with Lewy bodies, tau, neurodegeneration, longitudinal, PET
Patients with probable dementia with Lewy bodies (DLB) often have overlapping Alzheimer's disease (AD) pathology in addition to the α‐synuclein pathology, 1 , 2 such that more than 50% of patients with DLB are amyloid‐β positive and approximately 20% are tau positive. 2 , 3 , 4 Coexisting AD pathology in patients with DLB has been related to more severe clinical disease, 1 , 2 , 5 , 6 , 7 , 8 , 9 , 10 atrophy, 11 , 12 , 13 decreased overall survival, and faster clinical progression, 1 , 4 , 8 , 13 , 14 , 15 making AD pathology a potential target for the treatment of cognitive symptoms in individuals with DLB with coexisting AD.
Flortaucipir positron emission tomography (PET) is an in vivo quantitative biomarker of neurofibrillary tangle (NFT) tau pathology 16 , 17 , 18 that can longitudinally track the spread of NFT tau in the cortex. 19 , 20 , 21 , 22 Although flortaucipir uptake in DLB is substantially lower than the flortaucipir uptake in patients with AD dementia, 10 , 23 there is a specific pattern of uptake in the posterior temporoparietal and occipital cortex in patients with DLB. 9 , 10 , 24 Medial temporal lobe and cortical atrophy on magnetic resonance imaging (MRI) has been associated with NFT tau but not with α‐synuclein at autopsy, 25 , 26 indicating that AD pathology may be a significant driver of neurodegeneration in patients with DLB with coexisting AD pathology.
Based on our previous reports on cross‐sectional tau accumulation in DLB, 10 We hypothesized that longitudinal accumulation of tau pathology would be greater in DLB relative to cognitively unimpaired individuals and that regional rates of tau accumulation would be associated with rates of cortical atrophy as a biomarker of neurodegeneration as well as clinical disease progression. We used flortaucipir PET to investigate the longitudinal pattern of tau accumulation in DLB compared with an age‐matched and sex‐matched cognitively unimpaired control (CU) group. We further explored the association between rates of tau accumulation and rates of atrophy on MRI and clinical progression to gain insights into the spatial associations between tau accumulation, neurodegeneration, and clinical progression.
1. Methods
1.1. Participants
We included consecutive patients with clinically probable DLB (n = 22) enrolled in the Mayo Clinic Alzheimer's Disease Research Center who were followed approximately annually and underwent at least a pair of flortaucipir PET and MRI scans ranging between 0.9 to 3.3 years apart from May 2015 until February 2020. All participants completed a comprehensive clinical evaluation at both time points. Baseline and follow‐up evaluations included a medical history interview, informant interview, mental status examination, neurological examination by a neurologist, and neuropsychological assessment. Patients with probable DLB also underwent amyloid‐β PET scans with the Pittsburgh compound‐B (PiB) ligand at baseline. An automated greedy match algorithm was used to 1:1 age and sex match the CU (n = 22) from the Mayo Clinic Study of Aging, which is an epidemiologic study of aging in Olmsted County, MN. Most of the matches were within 3 years for age with one exception where the age difference was 7 years. The sex was an exact match. The CU had two flortaucipir PET and MRI examinations ranging between 1.1 to 2.9 years apart.
The clinical diagnosis of probable DLB was based on the Fourth Consortium Criteria. 27 Clinical disease severity was measured with the Clinical Dementia Rating–Sum of Boxes (CDR‐SOB), and cognitive performance was measured with the Mini‐Mental State Examination (MMSE) at both time points. Diagnosis of parkinsonism was based on a neurologic examination, and the severity of extrapyramidal motor impairment was quantified using the Unified Parkinson's Disease Rating Scale Part III. 28 Probable rapid eye movement sleep behavior disorder (RBD) was defined using the published criteria. 29 The presence of visual hallucinations was based on informant and patient reports, and the fluctuations were considered to be present with the Mayo Fluctuations Scale scores of 3 or 4. 30
1.2. Ethics Statement
The study was approved by the Mayo Clinic Institutional Review Board. Informed consent was obtained from all participants and/or their proxies for participation in this study.
1.3. Flortaucipir PET and MRI Acquisitions
Structural MRI was performed at 3 Tesla during the same visit cycle as PET. The MRI examination included a three‐dimensional, high‐resolution, magnetization‐prepared rapid acquisition gradient echo (MPRAGE) with approximately 1‐mm cubic resolution for cross‐sectional and longitudinal measurements of gray matter volume and for anatomical segmentation and labeling of PET images. An average of 386 MBq (range, 347–406 MBq) flortaucipir was injected, followed by an 80‐minute uptake period. A 20‐minute flortaucipir PET scan consisting of four 5‐minute frames was obtained. An average of 596 MBq (range, 292–729 MBq) 11C PiB was injected followed by a 40‐minute uptake period. A 20‐minute PiB PET scan consisting of four 5‐minute dynamic frames was obtained.
1.4. MRI Image Processing
T1‐weighted MRI scans were segmented into tissue classes and corrected for B0 inhomogeneities using Unified Segmentation 31 in Statistical Parametric Mapping version 12 SPM12; www.fil.ion.ucl.ac.uk/spm) with population‐optimized templates and settings from the Mayo Clinic Adult Lifespan Template (MCALT; https://www.nitrc.org/projects/mcalt). A set of 38 cortical region of interest (ROI) labels from the MCALT 122 atlas propagated using Advanced Normalization Tools (ANTs) Symmetric Normalization. 32 , 33 A fully automated in‐house developed image‐processing pipeline, called tensor‐based morphometry with symmetric normalization (TBM‐SyN), was used to compute the annualized rates of cortical atrophy in each participant as previously reported. 34 The gray matter change was calculated in set of 38 cortical ROIs that were divided by the time between scans (in years) to get the annualized rate of cortical atrophy in each participant with right and left hemispheric values combined.
1.5. PET Image Processing
PET images were analyzed with our in‐house fully automated image processing pipeline as previously described. 3 Each tau PET image was rigidly registered to its corresponding MPRAGE using SPM12, 35 and regional PET values were extracted from automatically labeled 38 ROIs propagated from the MRI template (MCALT) 36 using SPM12 and ANTs. 37 Standardized uptake value ratio (SUVr) values were formed by normalizing the median uptake value in each ROI to the median uptake in the cerebellar crus gray matter. Annual change in flortaucipir SUVr for each participant and each ROI was calculated as the difference between the two scans divided by time between scans (in years). The global cortical PiB SUVr were classified as normal (ie, negative) or abnormal (ie, positive) using a cut point of 1.48 using previously defined ROIs and median cerebellar crus gray matter uptake as the reference. 3 Flortaucipir and PiB SUVr were not partial volume corrected.
1.6. Statistical Analysis
Baseline demographic, clinical, and cognitive characteristics were described with means and standard deviations (SDs) for continuous variables and counts and proportions (percentages) for categorical variables. Baseline characteristics were compared between patients with probable DLB and CU using conditional logistic regression models to account for the matching. Because of convergence issues, an exact conditional logistic regression was done for the CDR‐SOB comparisons. Conditional logistic regressions account for the matched design, where matched patients with DLB and CU are not independent, and each pair potentially has a different probability of risk. The conditional logistic regression model includes stratum‐specific intercepts reflecting those potentially different probabilities. Differences in annualized change in flortaucipir SUVr and annualized change in cortical gray matter volume in each ROI were compared between the DLB and CU groups by using atlas‐based ROI analysis with conditional logistic regression accounting for the matching. In a supplemental analysis, the differences in annualized change in flortaucipir SUVr between amyloid‐β positive and negative DLB were tested using t tests.
In the DLB and the CU groups, Pearson correlations were used to assess the associations between annualized change in flortaucipir SUVr and annualized change in cortical gray matter volume, and in the DLB group, between annualized change in flortaucipir SUVr and annualized change in clinical scales. Comparisons were corrected using the false discovery rate (FDR) at the ROI level. Both uncorrected P value and FDR q values corrected results at P < 0.05 were reported as statistically significant findings. Statistical analyses were performed using SAS statistical software version 9.4 (SAS Institute, Cary, NC) and R statistical software version 3.6.2 (R Foundation for Statistical Computing, Vienna, Austria).
1.7. Data Availability
Anonymized data not published within this article will be made available by request from any qualified investigator.
2. Results
Baseline demographic, clinical, and cognitive characteristics of participants in the DLB and CU groups matched on age and sex are summarized in Table 1. Because of matching, patients with DLB and CU groups were similar in age and sex. Although 50% of the patients with DLB and only 18% of the CU were apolipoprotein E ε4 carriers, this difference did not reach statistical significance in this small sample (P = 0.067). As expected, patients with DLB had worse cognitive performance with a mean MMSE of 26 and abnormal amyloid PiB of 68% compared with the CU mean MMSE of 29 and amyloid PiB of 23%. Parkinsonism and probable RBD were present in almost all of the patients with DLB, followed by fluctuations (68%), whereas visual hallucinations were less common (41%). The average interval between the baseline and follow‐up visits was 1.6 years in both the DLB and CU groups.
TABLE 1.
Baseline characteristics of participants
| Characteristic | CU, n = 22 | DLB, n = 22 | P value* |
|---|---|---|---|
| Age, y, mean (SD) | 71.3 (6.0) | 70.7 (5.9) | 0.25 |
| Male, n (%) | 20 (91) | 20 (91) | 1.00 |
| APOE ε4 carrier, n (%) | 4 (18) | 11 (50) | 0.067 |
| Education, y, mean (SD) | 15.5 (2.8) | 15.6 (2.8) | 0.96 |
| Scan interval, y, mean (SD) | 1.6 (0.5) | 1.6 (0.7) | 0.61 |
| Abnormal PiB SUVr, n (%) | 5 (23) | 15 (68) | 0.022 |
| MMSE, mean (SD) | 28.8 (0.9) | 26.0 (2.5) | 0.025 |
| CDR‐SOB, mean (SD) | 0.1 (0.3) | 3.2 (1.5) | <0.001 |
| UPDRS, mean (SD) | – | 15.3 (9.2) | |
| Visual hallucinations, n (%) | – | 9 (41) | |
| Fluctuations, n (%) | – | 15 (68) | |
| Parkinsonism, n (%) | – | 22 (100) | |
| RBD, n (%) | ‐‐‐ | 21 (95) |
Data shown are the mean (SD) listed for the continuous variables and count (percentage) for the categorical variables.
P values for differences between groups come from a conditional logistic model with the exception of the CDR‐SOB, which used an exact conditional logistic model.
Abbreviations: CU, cognitive unimpaired controls; DLB, dementia with Lewy bodies; SD, standard deviation; APOE ε4, apolipoprotein E ε4; PiB, Pittsburgh compound‐B; SUVr, standardized uptake value ratio; MMSE, Mini‐Mental State Examination; CDR‐SOB, Clinical Dementia Rating Scale–Sum of Boxes; UPDRS, Unified Parkinson's Disease Rating Scale; RBD, rapid eye movement sleep behavior disorder.
2.1. Group Differences in Longitudinal Flortaucipir SUVr and Cortical Volume Changes
The tau PET ROIs were ranked according to statistical significance of the difference between patients with probable DLB and the CU group for the annual change in flortaucipir SUVr and cortical gray matter volume (Fig. 1). The annual increase of flortaucipir SUVr was greater in the DLB group compared with the CU group in the inferior parietal (mean 0.017 vs. −0.006; P = 0.036), fusiform gyrus (0.019 vs. −0.003; P = 0.042), and middle (0.017 vs. −0.006; P = 0.036) and superior occipital cortices (0.019 vs. −0.005; P = 0.047). Trajectory plots demonstrated the flortaucipir SUVr at each time point for each participant for these four ROIs (Supplemental Fig. 1). Greater rates of cortical atrophy were found in the similar regions of superior (−0.210 vs.−0.033; P = 0.039) and inferior temporal (−0.326 vs. −0.058; P = 0.044) cortices and temporal pole superior (−0.132 vs. 0.0001; P = 0.042), fusiform gyrus (−0.221 vs. −0.057; P = 0.033), and inferior parietal cortices (−0.095 vs. −0.021; P = 0.042) in patients with probable DLB compared with the CU group. None of the regions remained statistically significant after FDR correction for multiple comparisons. In the supplemental analysis, we did not find any differences in the longitudinal change in flortaucipir SUVr among the patients with probable DLB who were amyloid‐β positive or negative.
FIG 1.
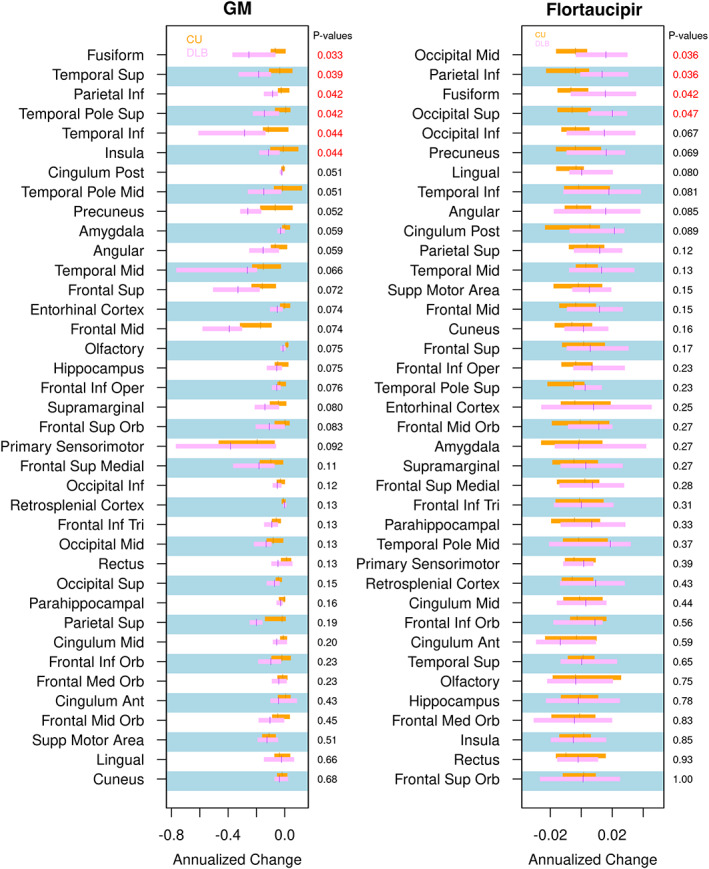
Annual change of cortical GM volume (left) and flortaucipir standardized uptake value ratio (right) in individual regions of interest in patients with probable dementia with Lewy bodies compared with controls. Median annual change of flortaucipir standardized uptake value ratio and cortical volume from the atlas regions of interest and the interquartile ranges are presented with box plots between groups. Regions of interest are ordered according to the level of statistical significance of the difference between patients with probable dementia with Lewy bodies and controls from conditional logistic models (P < 0.05 in red). The false discovery rate q values were not listed because there were no significant findings. GM, gray matter; Inf, inferior; Mid, middle; Sup, superior; Post, posterior; Oper, operculum; Orb, orbital; Tri, triangular; Ant, anterior.
2.2. Associations of Flortaucipir SUVr with Cortical Gray Matter Atrophy
The longitudinal increase in flortaucipir SUVr was associated with longitudinal cortical atrophy in a number of ROIs in patients with DLB, including the middle (r = −0.506; P = 0.038) and inferior occipital (r = −0.553; P = 0.021), inferior temporal (r = −0.523; P = 0.038), and inferior parietal (r = −0.549; P = 0.023) cortices; hippocampus (r = −0.554; P = 0.021); and middle temporal pole (r = −0.783; P < 0.001; Supplemental Fig. 2). After applying FDR correction for multiple comparisons, only the middle temporal pole remained statistically significantly associated between longitudinal increase in flortaucipir SUVr and the rates of cortical atrophy (FDR P = 0.008). To topographically display these results, we color coded the MCALT atlas regions by grouping regions with differences on their magnitude into the following three levels: nonsignificant, P < 0.05, and FDR P < 0.05 (Fig. 2).
FIG 2.
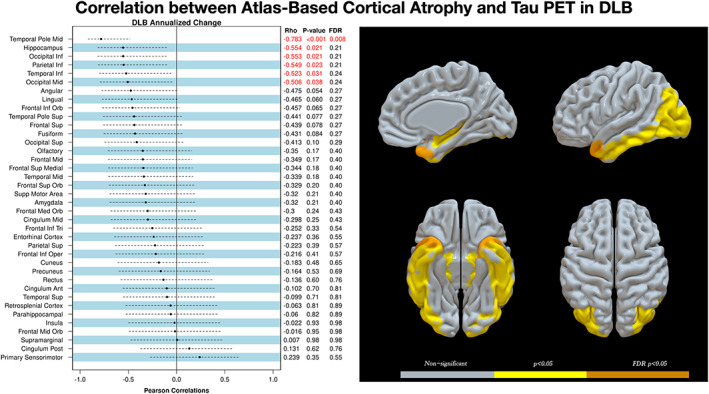
Region‐by‐region correlations of annualized rates of cortical gray matter volume change with annualized rates of flortaucipir standard value uptake unit ratio change in patients with probable DLB. Correlation coefficients, uncorrected P values, and the FDR q values after correction for multiple comparisons are listed for each of the 38 regions of interest (left). Ranking was based on the correlation coefficient, and the red labels indicate statistically significant findings (P < 0.05). A three‐dimensional projection of cortical regions of interest are grouped and thresholded at three levels of statistical significance as shown in the color scale: gray for nonsignificant, yellow for P < 0.05, and orange for FDR P < 0.05 (right). DLB, dementia with Lewy bodies; FDR, false discovery rate; Inf, inferior; Mid, middle; PET, positron emission tomography; Sup, superior; Orb, orbital; Tri, triangular; Oper, operculum; Ant, anterior; Post, posterior.
In the CU, the longitudinal increase in flortaucipir SUVr was associated with longitudinal cortical atrophy and in the medial superior frontal gyrus (r = −0.505; P = 0.039), but the association did not reach statistical significance after correcting for multiple comparisons (FDR P < 0.05; Supplemental Fig. 3).
2.3. Association of Longitudinal Change in Flortaucipir SUVr with Clinical Disease Progression
In ROIs with higher rates of increase in flortaucipir SUVr in patients with DLB compared with CU, we investigated the correlations of longitudinal change in flortaucipir SUVr with the longitudinal change in MMSE and CDR‐SOB. Among the patients with DLB, a longitudinal increase in flortaucipir SUVr was correlated with a concurrent decline on MMSE in the superior (r = −0.43; P = 0.047) and middle occipital cortices (r = −0.45; P = 0.035) and fusiform gyrus (r = −0.61; P = 0.002) as well as a concurrent increase in CDR‐SOB in the middle occipital cortex (r = 0.47; P = 0.029) and the fusiform gyrus (r = 0.44; P = 0.043; Fig. 3). In addition, we combined the fusiform gyrus and superior and middle occipital cortices as meta‐ROIs. The longitudinal increase in flortaucipir SUVr in the meta‐ROI also correlated with a concurrent decline on the MMSE (r = −0.516; P = 0.014) and a concurrent increase in CDR‐SOB (r = 0.432; P = 0.045).
FIG 3.
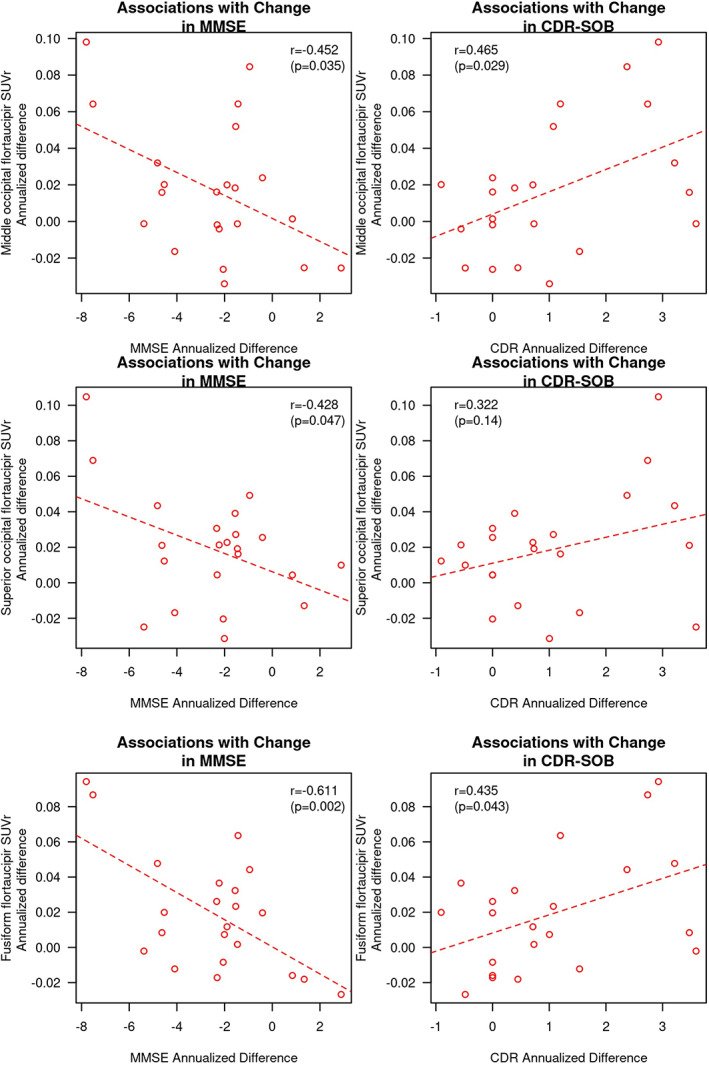
Associations of annualized change in flortaucipir SUVr and concurrent change in the MMSE and CDR‐SOB in the superior and middle occipital cortices and the fusiform gyrus. Pearson correlation coefficients and P values are displayed for each of the correlation analyses. CDR, Clinical Dementia Rating; CDR‐SOB, Clinical Dementia Rating–Sum of Boxes; MMSE, Mini‐Mental State Examination; SUVr, standard value uptake unit ratio.
3. Discussion
In this longitudinal study of flortaucipir PET, we found that the annual increase of flortaucipir SUVr was greater in the lateral occipital cortices, fusiform gyrus, and inferior parietal cortex in patients with DLB compared with CU. These increases flortaucipir SUVr were modestly higher than controls and did not survive the correction for multiple comparisons using FDR. In the patients with DLB, the longitudinal increases in flortaucipir SUVr were associated with greater cortical atrophy in the inferior temporoparietal cortices, hippocampus, temporal pole, and the lateral occipital cortices. These associations in the temporoparietal and occipital cortices were not observed in the CU group. Furthermore, among these regions, the longitudinal increase in flortaucipir SUVr observed in both the fusiform gyrus and occipital cortices correlated with a concurrent worsening in MMSE and CDR‐SOB in patients with DLB.
We had previously published the pattern of higher flortaucipir SUVr in the middle and superior occipital, fusiform, and inferior parietal cortices in a subset of participants of the current study, compared with controls, consistent with cross‐sectional flortaucipir PET findings in DLB by others. 9 , 10 , 23 In this longitudinal study of flortaucipir PET, we found that the annual increase of flortaucipir SUVr was greater in the lateral occipital cortices, fusiform gyrus, and inferior parietal cortex in patients with DLB compared with CU. These increases in flortaucipir SUVr were modestly higher than controls and did not survive the correction for multiple comparisons using FDR. Hence, our ROI‐based results show that the pattern of longitudinal increase in flortaucipir SUVr over and average of 1.6 years occurs in regions that are already involved with the NFT tau pathology in DLB. This alignment between the cross‐sectional and longitudinal pattens of tau accumulation in a short period of follow‐up is consistent with the longitudinal pattern of increase in flortaucipir SUVr in AD, where flortaucipir SUVr increases in regions that already have elevated flortaucipir SUVr within 1 to 2 years. 19 , 21 Annualized rates of tau accumulation were not different between patients who were amyloid‐β positive and DLB negative, likely because of the small subgroup size, and this needs to be investigated in a larger cohort.
The longitudinal tau accumulation was associated with the longitudinal cortical atrophy in a region‐to‐region correlation analysis in patients with DLB. Except for the superior medial frontal lobe region, these correlations did not reach statistical significance in the CU group, suggesting that this pattern of inferior temporoparietal and occipital tau accumulation and corresponding neurodegeneration is possibly a feature of DLB with coexisting AD and does not extend to those who are cognitively unimpaired. Greater whole‐brain 11 , 38 and cortical 38 atrophy rates have been previously found in patients with mixed AD and Lewy body pathology, but not in those with pure Lewy body pathology compared with healthy aging controls. Furthermore, atrophy on MRI has been associated with NFT tau but not with α‐synuclein using digital histopathology techniques both in the medial temporal lobe and the neocortex at autopsy. 25 , 26
Taken together with the findings of the current study, NFT tau pathology appears to significantly contribute to cortical neurodegeneration in patients with DLB with coexisting AD. However, this relationship between the rates of flortaucipir SUVr increase and atrophy was not present in all of the ROIs with increased atrophy rates in DLB in the current study. For example, we found increased rates of atrophy in the insula, but not increased rates of tau accumulation in that region, and neither did we find a correlation between tau accumulation and atrophy in the insula. The insula has been shown to be one of the atrophic regions at the prodromal stage in DLB. 39 , 40 It is possible that insular atrophy in DLB is specific to Lewy body pathology starting from the prodromal stages. Both the 18 F fluorodeoxyglucose PET and perfusion MRI studies indicate significant reductions in glucose metabolism and perfusion in the parietal and occipital regions in DLB, 23 , 41 suggesting that metabolic and perfusion changes related to Lewy body disease may not be fully captured on structural MRI. It is important to distinguish regions that undergo neurodegeneration associated with NFT tau, α‐synuclein, or both to determine the regional measurements that would be optimal biomarkers for clinical trials targeting one or more of the protein deposits in DLB.
The rate of increase in flortaucipir SUVr in the fusiform gyrus and lateral occipital cortex were each associated with greater rates of decline on the MMSE and an increase in CDR‐SOB scores. Coexisting NFT tau pathology or biomarker‐based tau positivity in patients with DLB have been associated with more severe clinical disease, 1 , 2 , 5 , 6 , 7 , 8 , 9 , 10 lower MMSE scores, 4 , 42 , 43 , 44 and decreased overall survival and faster clinical progression. 1 , 4 , 8 , 13 , 14 , 15 Our current data further support these findings from cross‐sectional studies by demonstrating that accelerated tau accumulation is associated with concurrent clinical progression.
A strength of this study is that we measured the longitudinal rates of tau accumulation and concurrent rates of cortical atrophy in DLB compared with an age‐matched and sex‐matched CU group. We further investigated the pattern of accelerated rates of tau accumulation in DLB and its regional relationships with atrophy and clinical progression in DLB. A limitation of our study is the relatively small sample size and a relatively short average follow‐up period of 16 months, which may have limited our observation of differences among the subgroups of participants who were amyloid‐β positive or negative. Nonetheless, the rates of tau accumulation in DLB were still faster than the CU within an average of 1.6 years. In addition, there may be some off‐target retention of flortaucipir in the choroid plexus that may impact apparent retention in the hippocampus in baseline PET analysis, but it would have a minor impact on the longitudinal results in the current study.
NFT tau accumulation is faster in patients with DLB compared with CU, with increased accumulation rates mainly in the temporoparietal and lateral occipital cortices. Increased rates of NFT tau accumulation in DLB are associated with topographically concurrent rates of atrophy and clinical progression. Although it is not possible to fully attribute cortical atrophy in DLB to NFT tau accumulation, NFT tau pathology seems to be an important component of neurodegeneration and clinical progression in DLB. Our results suggest that patients with DLB may benefit from tau‐directed therapies; therefore, NFT tau can be a potential target for future combination therapies in probable DLB.
Author Roles
(1) Research Project: A. Conception, B. Organization, C. Execution; (2) Statistical Analysis: A. Design, B. Execution, C. Review and Critique; (3) Manuscript: A. Writing of the First Draft, B. Review and Critique.
Q.C.: 1A, 1B, 1C, 2C, 3A
S.A.P.: 2C, 3B
M.L.S.: 2C, 3B
C.G.S.: 2C, 3B
T.G.L.: 2C, 3B
H.B.: 1C, 2C, 3B
D.S.K.: 1C, 2C, 3B
J.G.‐R.: 1C, 2C, 3B
R.S.: 1C, 2C, 3B
D.T.J.: 1C, 2C, 3B
J.A.F.: 1C, 2C, 3B
M.K.J.: 2C, 3B
N.R.G.‐R.: 1C, 2C, 3B
T.J.F.: 2C, 3B
W.K.K.: 2C, 3B
C.R.J.: 2C, 3B
R.C.P.: 2C, 3B
B.F.B.: 1C, 2C, 3B
V.J.L.: 2C, 3B
K.K.: 1A, 1B, 1C, 2C, 3A
Financial Disclosures
Q.C. receives the Alzheimer's Association International Conference (AAIC) travel fellowship bursary to attend the AAIC conference in 2018 and research support from National Natural Science Foundation of China (8207052203). C.G.S. receives research support from National Institutes of Health (NIH) and has received payment from Karolinska Institute for a lecture. H.B. receives research support from the NIH and National Institute on Aging (NIA) paid to Mayo Clinic (R01 DC12519‐06, NIH/National Institute on Deafness and Other Communication Disorders (NIDCD), Co‐I; U19 AG63911‐02, NIA, Co‐I; P30 AG62677‐02, NIA, study staff; RO3 NS114365‐01, NIA, Co‐investigator (Co‐I)). D.S.K. serves on the Data and Safety Monitoring Board (DSMB) of the Dominantly Inherited Alzheimer Network Trial Unit (DIAN‐TU) study for a Biogen tau drug (Mayo Clinic receives the consulting fees and he has no control over those funds) and for Agenebio (no consulting fees). He is a site primary investigator (PI) for clinical trials sponsored by Biogen, Lilly, and the University of Southern California and is funded by the NIH. J.G.‐R. receives research support from the NIH. He serves on American Academy of Neurology committee and has consulted for American Academy of Neurology (AAN) J.A.F. receives research support from the NIH. She was sponsored by the Study of Women's Health Across the Nation (SWAN)‐Aging Oversight and Monitoring Board and University of Pittsburgh. M.K.J. holds the stock of Eli Lily. T.J.F. receives funding from the Mangurian Foundation for Lewy body research and the NIH. W.K.K. receives research funding from AstraZeneca, Biogen, Roche, and the NIH. C.R.J. serves on an independent data monitoring board for Roche and has served as a speaker for Eisai and consulted for Biogen, but he receives no personal compensation from any commercial entity. He receives research support from the NIH, the GHR Foundation, and the Alexander Family Alzheimer's Disease Research Professorship of the Mayo Clinic. R.C.P. serves on scientific advisory boards for Genentech; consulted for Roche, Merck, Biogen, and Eisai; and receives royalties from publishing Mild Cognitive Impairment (Oxford University Press, 2003). He also receives research support from the NIH. B.F.B. has served as an investigator for clinical trials sponsored by GE Healthcare and Axovant. He receives royalties from the publication of a book titled Behavioral Neurology of Dementia (Cambridge Medicine, 2009, 2017). He serves on the scientific advisory board of the Tau Consortium. He receives research support from the NIH, the Mayo Clinic Dorothy and Harry T. Mangurian Jr. Lewy Body Dementia Program, and the Little Family Foundation. V.J.L. has consulted for Life Molecular Imaging, Avid Radiopharmaceuticals, and Merck Research and receives research support from GE Healthcare, Siemens Molecular Imaging, Avid Radiopharmaceuticals, and the NIH (NIA, National Cancer Institue (NCI)). K.K. serves on the data safety monitoring board for Takeda Global Research & Development Center, Inc. and the data monitoring boards of Pfizer and Janssen Alzheimer Immunotherapy. She receives research support from Avid Radiopharmaceuticals and Eli Lilly. She is funded by the Alzheimer's Drug Discovery Foundation and the NIH. S.A.P., M.L.S., T.G.L., R.S., and N.R.G.‐R. have nothing to disclose.
Supporting information
Figure S1.
Figure S2.
Figure S3.
Acknowledgments
We are grateful to our patients and informants for their participation in our detailed annual assessments and for their involvement in current study. The staffs at GE Healthcare were not involved in the analysis, the interpretation of the data, or in the preparation of this manuscript.
Relevant conflicts of interest/financial disclosures: The authors report no conflicts of interest.
Funding agencies: This work is supported by the National Institutes of Health Grants U01 NS100620, P50 AG016574, and P30 AG 062677; Foundation Dr. Corinne Schulerand; Mangurian Foundation for Lewy Body Research; Elsie and Marvin Dekelboum Family Foundation; Robert H. and Clarice Smith and Abigail Van Buren Alzheimer's Disease Research Program; Little Family Foundation; and LBD Functional Genomics Program.
Data Availability Statement
Anonymized data not published within this article will be made available by request from any qualified investigator.
References
- 1. Irwin DJ, Grossman M, Weintraub D, et al. Neuropathological and genetic correlates of survival and dementia onset in synucleinopathies: a retrospective analysis. Lancet Neurol 2017;16(1):55–65. [DOI] [PMC free article] [PubMed] [Google Scholar]
- 2. Ferreira D, Przybelski SA, Lesnick TG, et al. Beta‐amyloid and tau biomarkers and clinical phenotype in dementia with Lewy bodies. Neurology 2020;95(24):e3257–e3268. [DOI] [PMC free article] [PubMed] [Google Scholar]
- 3. Jack CR, Wiste HJ, Botha H, et al. The bivariate distribution of amyloid‐beta and tau: relationship with established neurocognitive clinical syndromes. Brain 2019;142(10):3230–3242. [DOI] [PMC free article] [PubMed] [Google Scholar]
- 4. Lemstra AW, de Beer MH, Teunissen CE, et al. Concomitant AD pathology affects clinical manifestation and survival in dementia with Lewy bodies. J Neurol Neurosurg Psychiatry 2017;88(2):113–118. [DOI] [PubMed] [Google Scholar]
- 5. Lopez OL, Becker JT, Kaufer DI, et al. Research evaluation and prospective diagnosis of dementia with Lewy bodies. Arch Neurol 2002;59(1):43–46. [DOI] [PubMed] [Google Scholar]
- 6. Merdes AR, Hansen LA, Jeste DV, et al. Influence of Alzheimer pathology on clinical diagnostic accuracy in dementia with Lewy bodies. Neurology 2003;60(10):1586–1590. [DOI] [PubMed] [Google Scholar]
- 7. Peavy GM, Edland SD, Toole BM, Hansen LA, Galasko DR, Mayo AM. Phenotypic differences based on staging of Alzheimer's neuropathology in autopsy‐confirmed dementia with Lewy bodies. Parkinsonism Relat Disord 2016;31:72–78. [DOI] [PMC free article] [PubMed] [Google Scholar]
- 8. Ferman TJ, Aoki N, Crook JE, et al. The limbic and neocortical contribution of alpha‐synuclein, tau, and amyloid beta to disease duration in dementia with Lewy bodies. Alzheimers Dement 2018;14(3):330–339. [DOI] [PMC free article] [PubMed] [Google Scholar]
- 9. Gomperts SN, Locascio JJ, Makaretz SJ, et al. Tau positron emission tomographic imaging in the Lewy body diseases. JAMA Neurol 2016;73(11):1334–1341. [DOI] [PMC free article] [PubMed] [Google Scholar]
- 10. Kantarci K, Lowe VJ, Boeve BF, et al. AV‐1451 tau and beta‐amyloid positron emission tomography imaging in dementia with Lewy bodies. Ann Neurol 2017;81(1):58–67. [DOI] [PMC free article] [PubMed] [Google Scholar]
- 11. Whitwell JL, Jack CR Jr, Parisi JE, et al. Rates of cerebral atrophy differ in different degenerative pathologies. Brain 2007;130(Pt 4):1148–1158. [DOI] [PMC free article] [PubMed] [Google Scholar]
- 12. Sarro L, Senjem ML, Lundt ES, et al. Amyloid‐beta deposition and regional grey matter atrophy rates in dementia with Lewy bodies. Brain 2016;139(Pt 10):2740–2750. [DOI] [PMC free article] [PubMed] [Google Scholar]
- 13. Kantarci K, Ferman TJ, Boeve BF, et al. Focal atrophy on MRI and neuropathologic classification of dementia with Lewy bodies. Neurology 2012;79(6):553–560. [DOI] [PMC free article] [PubMed] [Google Scholar]
- 14. Jellinger KA, Seppi K, Wenning GK, Poewe W. Impact of coexistent Alzheimer pathology on the natural history of Parkinson's disease. J Neural Transm (Vienna) 2002;109(3):329–339. [DOI] [PubMed] [Google Scholar]
- 15. Graff‐Radford J, Lesnick TG, Boeve BF, et al. Predicting survival in dementia with Lewy bodies with hippocampal volumetry. Mov Disord 2016;31(7):989–994. [DOI] [PMC free article] [PubMed] [Google Scholar]
- 16. Lowe VJ, Lundt ES, Albertson SM, et al. Tau‐positron emission tomography correlates with neuropathology findings. Alzheimers Dement 2020;16(3):561–571. [DOI] [PMC free article] [PubMed] [Google Scholar]
- 17. Fleisher AS, Pontecorvo MJ, Devous MD Sr, et al. Positron emission tomography imaging with [18F]flortaucipir and postmortem assessment of Alzheimer disease neuropathologic changes. JAMA Neurol 2020;77(7):829–839. [DOI] [PMC free article] [PubMed] [Google Scholar]
- 18. Smith R, Wibom M, Pawlik D, Englund E, Hansson O. Correlation of in vivo [18F]flortaucipir with postmortem Alzheimer disease tau pathology. JAMA Neurol 2019;76(3):310–317. [DOI] [PMC free article] [PubMed] [Google Scholar]
- 19. Jack CR Jr, Wiste HJ, Schwarz CG, et al. Longitudinal tau PET in ageing and Alzheimer's disease. Brain 2018;141(5):1517–1528. [DOI] [PMC free article] [PubMed] [Google Scholar]
- 20. Harrison TM, La Joie R, Maass A, et al. Longitudinal tau accumulation and atrophy in aging and alzheimer disease. Ann Neurol 2019;85(2):229–240. [DOI] [PMC free article] [PubMed] [Google Scholar]
- 21. Pontecorvo MJ, Devous MD, Kennedy I, et al. A multicentre longitudinal study of flortaucipir (18F) in normal ageing, mild cognitive impairment and Alzheimer's disease dementia. Brain 2019;142(6):1723–1735. [DOI] [PMC free article] [PubMed] [Google Scholar]
- 22. Chiotis K, Saint‐Aubert L, Rodriguez‐Vieitez E, et al. Longitudinal changes of tau PET imaging in relation to hypometabolism in prodromal and Alzheimer's disease dementia. Mol Psychiatry 2018;23(7):1666–1673. [DOI] [PubMed] [Google Scholar]
- 23. Wolters EE, van de Beek M, Ossenkoppele R, et al. Tau PET and relative cerebral blood flow in dementia with Lewy bodies: a PET study. Neuroimage Clin 2020;28:102504 [DOI] [PMC free article] [PubMed] [Google Scholar]
- 24. Smith R, Scholl M, Londos E, Ohlsson T, Hansson O. (18)F‐AV‐1451 in Parkinson's disease with and without dementia and in dementia with Lewy bodies. Sci Rep 2018;8(1):4717 [DOI] [PMC free article] [PubMed] [Google Scholar]
- 25. Murray ME, Ferman TJ, Boeve BF, et al. MRI and pathology of REM sleep behavior disorder in dementia with Lewy bodies. Neurology 2013;81(19):1681–1689. [DOI] [PMC free article] [PubMed] [Google Scholar]
- 26. Spotorno N, Coughlin DG, Olm CA, et al. Tau pathology associates with in vivo cortical thinning in Lewy body disorders. Ann Clin Transl Neurol 2020;7(12):2342–2355. [DOI] [PMC free article] [PubMed] [Google Scholar]
- 27. McKeith IG, Boeve BF, Dickson DW, et al. Diagnosis and management of dementia with Lewy bodies: fourth consensus report of the DLB consortium. Neurology 2017;89(1):88–100. [DOI] [PMC free article] [PubMed] [Google Scholar]
- 28. Fahn S. Recent developments in Parkinson's disease. Macmillan Health Care Inf 1987;2:293–304. [Google Scholar]
- 29. Boeve BF, Molano JR, Ferman TJ, et al. Validation of the Mayo sleep questionnaire to screen for REM sleep behavior disorder in an aging and dementia cohort. Sleep Med 2011;12(5):445–453. [DOI] [PMC free article] [PubMed] [Google Scholar]
- 30. Ferman TJ, Smith GE, Boeve BF, et al. DLB fluctuations: specific features that reliably differentiate DLB from AD and normal aging. Neurology 2004;62(2):181–187. [DOI] [PubMed] [Google Scholar]
- 31. Ashburner J, Friston KJ. Unified segmentation. Neuroimage 2005;26(3):839–851. [DOI] [PubMed] [Google Scholar]
- 32. Avants BB, Epstein CL, Grossman M, Gee JC. Symmetric diffeomorphic image registration with cross‐correlation: evaluating automated labeling of elderly and neurodegenerative brain. Med Image Anal 2008;12(1):26–41. [DOI] [PMC free article] [PubMed] [Google Scholar]
- 33. Schwarz CG, Gunter JL, Wiste HJ, et al. A large‐scale comparison of cortical thickness and volume methods for measuring Alzheimer's disease severity. Neuroimage Clin 2016;11:802–812. [DOI] [PMC free article] [PubMed] [Google Scholar]
- 34. Vemuri P, Senjem ML, Gunter JL, et al. Accelerated vs. unaccelerated serial MRI based TBM‐SyN measurements for clinical trials in Alzheimer's disease. Neuroimage 2015;113:61–69. [DOI] [PMC free article] [PubMed] [Google Scholar]
- 35. Ashburner J. Computational anatomy with the SPM software. Magn Reson Imaging 2009;27(8):1163–1174. [DOI] [PubMed] [Google Scholar]
- 36. Schwarz CG, Gunter JL, Ward CP, et al. The Mayo Clinic adult lifespan template: better quantification across the lifespan. Alzheimers Dement 2017;13:P93–P94. [Google Scholar]
- 37. Avants BB, Tustison NJ, Song G, Cook PA, Klein A, Gee JC. A reproducible evaluation of ANTs similarity metric performance in brain image registration. Neuroimage 2011;54(3):2033–2044. [DOI] [PMC free article] [PubMed] [Google Scholar]
- 38. Nedelska Z, Ferman TJ, Boeve BF, et al. Pattern of brain atrophy rates in autopsy‐confirmed dementia with Lewy bodies. Neurobiol Aging 2015;36(1):452–461. [DOI] [PMC free article] [PubMed] [Google Scholar]
- 39. Blanc F, Colloby SJ, Cretin B, et al. Grey matter atrophy in prodromal stage of dementia with Lewy bodies and Alzheimer's disease. Alzheimers Res Ther 2016;8:31 [DOI] [PMC free article] [PubMed] [Google Scholar]
- 40. Blanc F, Colloby SJ, Philippi N, et al. Cortical thickness in dementia with Lewy bodies and Alzheimer's disease: a comparison of prodromal and dementia stages. PLoS One 2015;10(6):e0127396 [DOI] [PMC free article] [PubMed] [Google Scholar]
- 41. Nedelska Z, Senjem ML, Przybelski SA, et al. Regional cortical perfusion on arterial spin labeling MRI in dementia with Lewy bodies: associations with clinical severity, glucose metabolism and tau PET. Neuroimage Clin 2018;19:939–947. [DOI] [PMC free article] [PubMed] [Google Scholar]
- 42. van Steenoven I, Aarsland D, Weintraub D, et al. Cerebrospinal fluid Alzheimer's disease biomarkers across the spectrum of Lewy body diseases: results from a large multicenter cohort. J Alzheimers Dis 2016;54(1):287–295. [DOI] [PMC free article] [PubMed] [Google Scholar]
- 43. Paraskevas GP, Bougea A, Constantinides VC, Bourbouli M, Petropoulou O, Kapaki E. In vivo prevalence of Alzheimer biomarkers in dementia with Lewy bodies. Dement Geriatr Cogn Disord 2019;47(4–6):289–296. [DOI] [PubMed] [Google Scholar]
- 44. Parnetti L, Tiraboschi P, Lanari A, et al. Cerebrospinal fluid biomarkers in Parkinson's disease with dementia and dementia with Lewy bodies. Biol Psychiatry 2008;64(10):850–855. [DOI] [PubMed] [Google Scholar]
Associated Data
This section collects any data citations, data availability statements, or supplementary materials included in this article.
Supplementary Materials
Figure S1.
Figure S2.
Figure S3.
Data Availability Statement
Anonymized data not published within this article will be made available by request from any qualified investigator.
Anonymized data not published within this article will be made available by request from any qualified investigator.