Abstract
Ribosome-inactivating proteins, a family of highly cytotoxic proteins, interfere with protein synthesis by depurinating a specific adenosine residue within the conserved α-sarcin/ricin loop of eukaryotic ribosomal RNA. Besides being biological warfare agents, certain RIPs have been promoted as potential therapeutic tools. Monitoring their deglycosylation activity and its inhibition in real time has remained, however, elusive. Herein, we describe the enzymatic preparation and utility of consensus RIP hairpin substrates in which specific G residues, neighboring the depurination site, are surgically replaced with tzG and thG, fluorescent G analogs. By strategically modifying key positions with responsive fluorescent surrogate nucleotides, RIP-mediated depurination can be monitored in real-time by steady state fluorescence spectroscopy. Subtle differences observed in preferential depurination sites provide insight into the RNA folding as well as RIPs’ substrate recognition features.
Keywords: fluorescence, RNA, protein toxins, emissive nucleosides, kinetics
Graphical Abstract
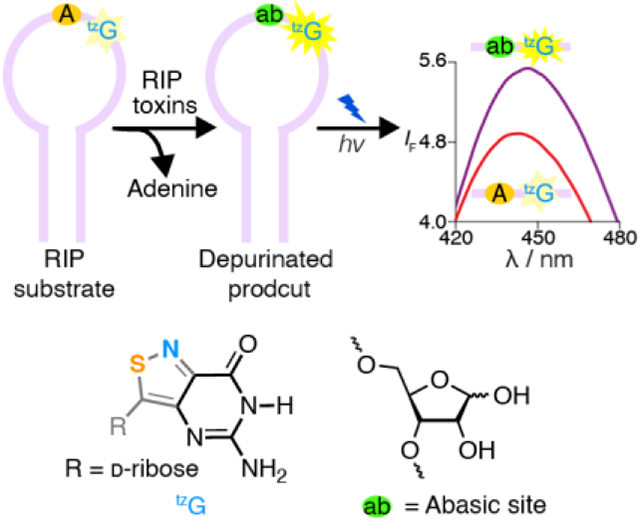
A real-time monitoring assay for RIP-mediated depurination: Ribosome-inactivating proteins (RIPs) interfere with protein synthesis by depurinating a specific adenosine residue within α-sarcin/ricin loop. By strategically modifying key position with responsive fluorescent nucleosides such as tzG, depurination by RIPs is monitored in real-time by fluorescence. The method provides insight into the RNA folding as well as RIPs’ recognition features.
Ribosome-inactivating proteins (RIPs), a family of highly toxic enzymes,[1] are broadly distributed among plants,[2] fungi[3] and bacteria[4] and have even been recently found in insects.[5] Their major catalytic depurinating activity leads to removal of a specific adenine from the α-sarcin-ricin loop,[6] a highly conserved ribosomal RNA domain, causing irreversible inhibition of protein synthesis.[7] While lethal to mammalian cells, RIPs can also display antiviral features[8] and can inhibit animal and plant viruses such as HIV-1,[9] poliovirus[10] and Tobacco etch virus.[11] RIP-conjugated toxins have also been developed as potential antitumor agents.[12,13] Their unique and surgically directed cellular activity, as well as potency and potential utility as biowarfare agents, have therefore attracted considerable interest over the years,[14] aiming particularly at the development of effective strategies for real time activity monitoring and detection.[15]
Prior studies have utilized Enzyme-linked immunosorbent assay (ELISA),[16] immuno-PCR[17] and mass spectrometry to assess RIP activity.[18] Most methods, however, require termination of the depurination reaction by either inactivating the enzyme or denaturating the RNA substrate. As such, these methods are not amenable to readily measure activity and its potential inhibition in real-time.
More than a decade ago we reported a fluorescence-based depurination-monitoring approach relying on thU, an isomorphic responsive uridine analogue.[19] Incorporating this emissive U surrogate into an RNA oligonucleotide, complementary to the highly conserved α-sarcin-ricin loop, allowed us to simultaneously quench the RIP-mediated depurination reaction and generate a fluorescent signal proportional to the reaction progress via enhanced emission (relying on the different emission intensity of thU•A vs. thU•AP, due to their distinct microenvironments).[19] While powerful, this approach still fell short of the ultimate goal of monitoring RIP action in real time. The introduction of our highly isomorphic emissive RNA alphabets thN and tzN, based on thieno[3,4-d]pyrimidine[20] and isothiazolo[4,3-d]pyrimidine cores,[21] respectively, has made this previously unattainable task possible.
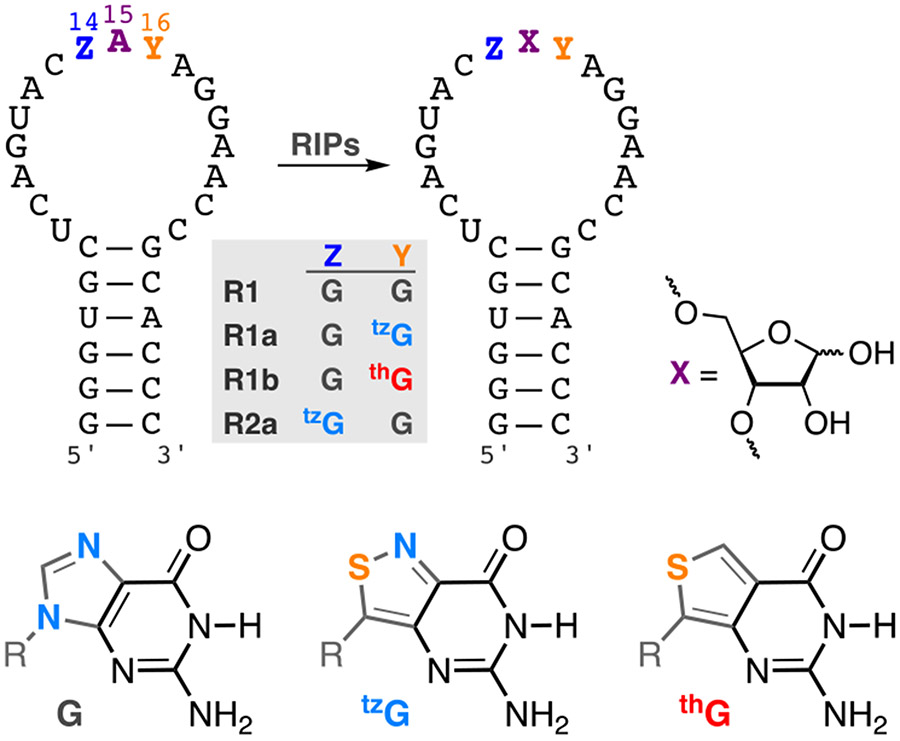
As C-nucleosides, the adenosine surrogates thA and tzA cannot replace the susceptible adenosine within the RNA substrate.[22] We hypothesized, however, that by placing the emissive and responsive thG or tzG either 5’ or 3’ to A15, the depurinatable residue within the RNA substrate (Figure 1), activity would be maintained and fluorescence changes may be observed due to the environmental perturbations induced upon RIP-mediated generation of an abasic site. Inspecting the reported structures of the consensus RNA construct,[23] we hypothesized, however, that incorporation of fluorescent G surrogates 3’ to the depurination site (i.e., at position 16), is likely to translate to a larger fluorescence signal upon depurination due to perturbation of the apparent A15/G16 stacking.[22] We further anticipated the tzG-containing RNA substrates to perform better than their thG counterparts due to the elevated isomorphicity of the former. Herein, we disclose the enzymatic synthesis of thG- and tzG-containing α-sarcin-ricin hairpin substrate RNAs and their RIP-mediated depurination reactions. We demonstrate that the emissive RNA substrates can be utilized to monitor enzymatic depurination in real-time. We critically assess the differences between the RNA substrates containing tzG or thG and compare the reaction kinetics and site preferences to that of a native RNA substrate.
Figure 1.
RIP-mediated depurination of A15 in the α-sarcin/ricin loop RNA substrate yields an abasic site. R1, R1a, R1b, R2a are the native, tzG16, thG16, and tzG14 modified hairpin substrates, respectively. R = d-ribose
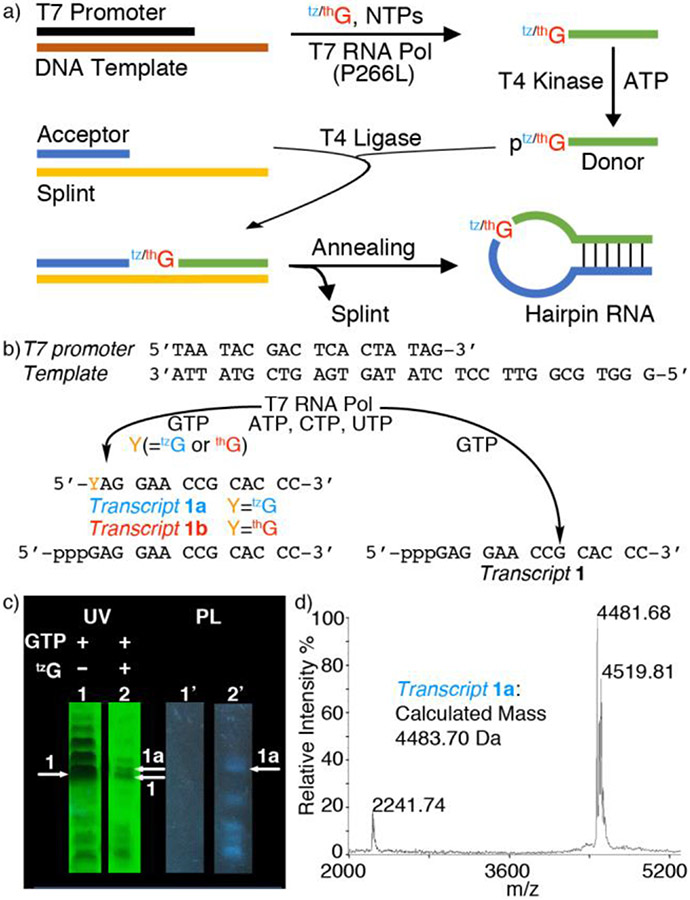
The singly substituted RNA hairpin substrates R1a (Y=tzG), R1b (Y=thG) and R2a (Z=tzG), containing the emissive guanosine surrogates at position G16(Y)/G14(Z) of the native substrate R1 (Figure 1), were synthesized through tzG/thG-initiated transcription, followed by phosphorylation and ligation, using a general protocol we disclosed in 2017 (Figure 2a).[24] The T7 promoter and corresponding DNA template oligomers were annealed and transcribed in the presence of excess tzG or thG (as the free nucleosides) and natural NTPs (Figure 2b). The tzG/thG-containing transcripts 1a/1b and unmodified native transcripts 1 were separated on a denaturing PAGE (Figure 2c, Figure S3, respectively). UV illumination (365 nm) visualized the desired and truncated RNA transcripts, which were analyzed by MALDI-TOF mass spectrometry (Figure 2c, 2d, Figure S2). Following a kinase-mediated 5’-phosphorylation and a T4 ligase-mediated ligation, the desired site specifically labeled fluorescent RNA constructs were separated by PAGE (Figure S3, Figure S5) and the isolated oligomers were subjected to MALDI and ESI mass spectrometry analyses (Figures S7-S14). To confirm the presence of intact tzG or thG and determine the ratio of each nucleoside, the RNA constructs were digested by S1 Nuclease, dephosphorylated and HPLC analyzed (Figure S15). The ratio of rC, rU, rA, rG, rtzG/rthG was 9.0:3.4:7.1:8.2:1 for tzG modified strand R1a, and 11.2:4.5:9.2:7.7:1 for thG modified strand R1b, respectively (rtzG/rthG was set as a reference value for calculation). The results were in reasonably good agreement with the expected theoretical ratio in R1a/R1b (rC, rU, rA, rG, rtzG/rthG is 9:3:7:9:1).
Figure 2.
a) Enzymatic pathways to singly modified hairpin RNAs via transcription, phosphorylation and ligation, replacing a single native guanosine with thG or tzG. See reference 24 for details of the general approach. b) Transcription reactions in the presence of natural NTPs using the T7 promotor and template shown, with or without tzG/thG. c) PAGE analysis of transcription reactions using 2 mM NTPs with or without 10 mM tzG. Lane 1 and 1’: native transcription without tzG. Lane 2 and 2’: transcription with 10 mM tzG. White arrows indicated the expected product transcript 1a (arrow 1a) and transcript 1 (arrow 1). UV: UV shadowing upon illumination at 254 nm; PL: photoluminescence upon excitation at 365 nm; d) MALDI MS of transcript 1a.
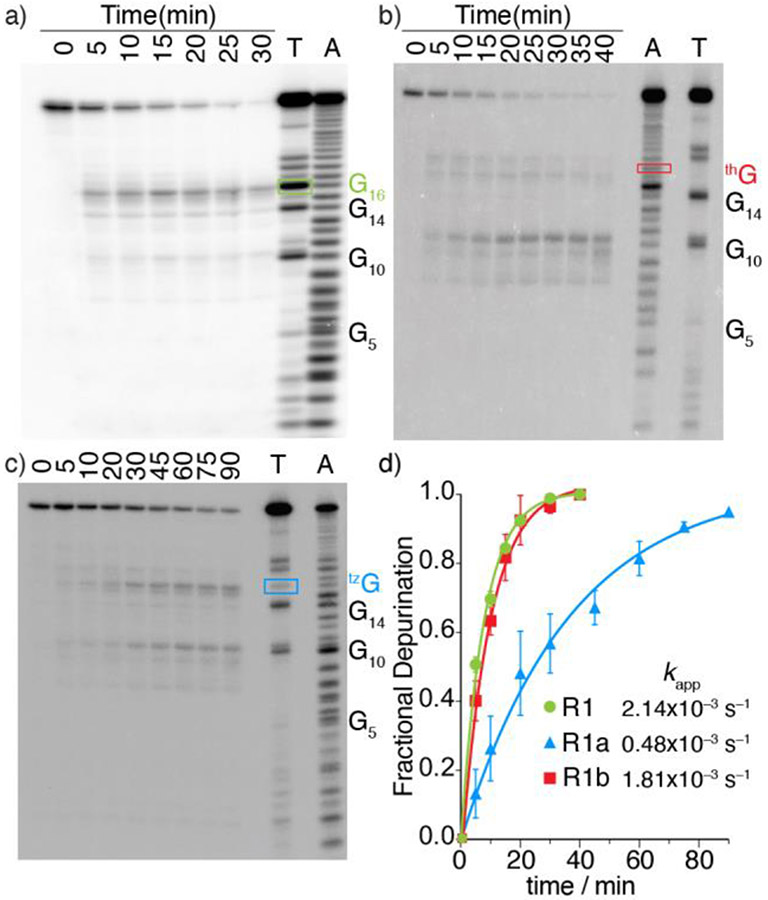
To categorically assess the viability of the modified RNAs as RIP substrates, the native and tzG/thG modified RNA substrates (R1 and R1a/R1b, respectively) were subjected to enzymatic depurination.[19] The hairpin RNA substrates, spiked with a trace amount of the corresponding 32P-labeled RNAs, were thermally denatured and refolded in a 30 mM Tris-HCl buffer. Depurination reactions with saporin as a representative RIP were carried out at 37 °C. Small aliquots of the reaction mixtures were treated with aniline-acetate buffer (pH 4.5) at given time intervals (to induce strand cleavage at the abasic sites)[25] and were resolved by PAGE (Figure 3a, 3b, 3c). T1 digestion and alkaline hydrolysis lanes reveal the sequence and assist in determining the cleavage site (Figure 3a, 3b, 3c: Lane T, A). As we previously demonstrated,[24] RNase T1, which is an N7-dependent ribonuclease, clearly shows the absence of a native G residue (and essentially a footprint) at the modification site (Figure 3b).
Figure 3.
Saporin-mediated depurination of native and tzG/thG-modified RNA substrates (R1 and R1a/R1b, respectively) spiked with the corresponding 32P-labeled constructs and resolved by 20% PAGE. All reactions were carried out in Tris buffer (30 mM, pH 6.0), NaCl (25 mM) and MgCl2 (2 mM) at 37 °C. All lanes were treated with aniline-acetate buffer (pH 4.5) at the indicated time intervals. Lanes T and A correspond to RNase T1 digestion and alkaline hydrolysis ladder, respectively. The bands labeled by rectangles in a, b and c, indicate the modified site with native G, thG, and tzG at G16 position, respectively. a) Depurination reaction of R1. b) Depurination reaction of R1b. The missing band from lane T of R1b indicated a footprint at position G16, which is replaced by thG. c) Depurination reaction of R1a at given time point. d) Kinetic profiles of saporin-mediated depurination reactions of 32P-5’-labeled R1 (Green), R1a (Blue) and R1b (Red). Reactions were done in triplicates and a representative gel is shown per experiment. Error bars indicate SD.
As seen in Figure 3, saporin largely depurinates the A15 residue in the native and tzG modified substrates (R1 and R1a, respectively, Figure 3a, 3c) suggesting tzG enables similar folding for R1a compared to R1 and does not interfere with RIP activity. In contrast, the thG substrate (R1b) is predominately depurinated at A9, which appears to only be minimally/equally depurinated in the substrate R1/R1a (Figure 3b). Additionally, a similar depurination pattern was also observed for the emissive substrate R2a which is modified with tzG at position 14 (Figure S17) indicating that tzG14 maintains similar folding compared to native R1 substrate and does not interfere with saporin’s recognition features. Additionally, longer reaction times were needed to completely consume R1a as well as R2a when compared to substrates R1 and R1b (Figure 3d, S17). To quantify the observations, the apparent kinetic rate constants kapp, obtained by fitting pseudo-first order curves to the integrated PAGE bands plotted against time, were 2.14 × 10⁻³, 0.48 × 10⁻³ and 1.81 × 10⁻³ s−1 for substrate R1, R1a, and R1b respectively.
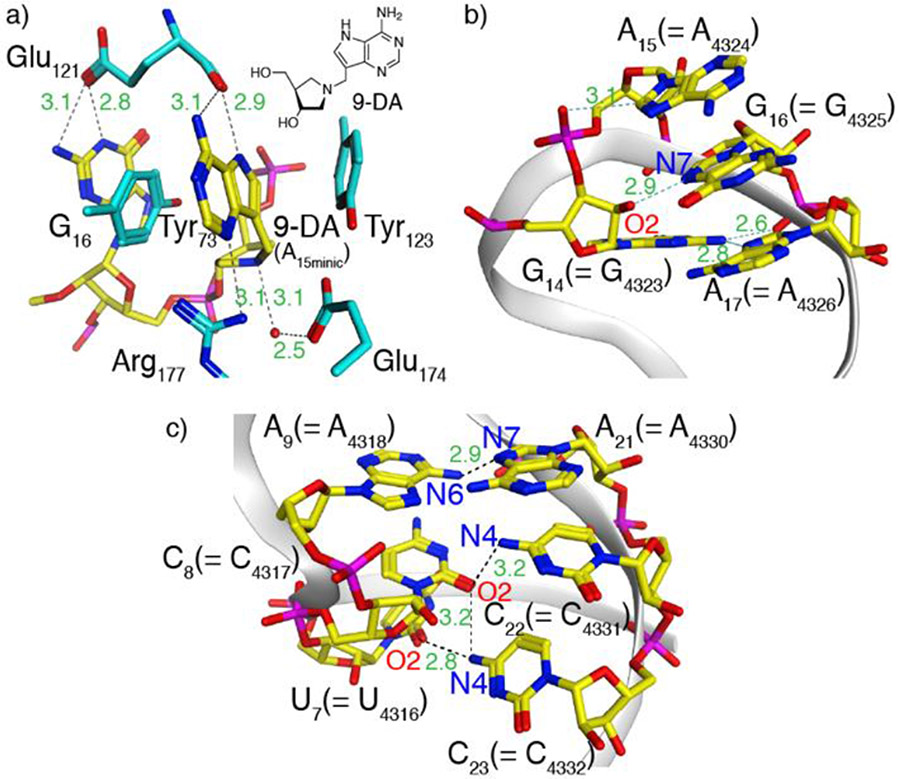
The observations reported above suggest a small perturbation in R1a when compared to the native substrate R1. As seen in the crystal structure of a bound cyclic tetranucleotide analogue of the RNA GAGA tetraloop, in which the susceptible adenosine has been replaced by 9-DA, a transition state analog (Figure 4a),[26] a cluster of aromatic residues including the RNA and two conserved tyrosine residues (Tyr73, Tyr123) forms. This unique cluster is further stabilized by an extensive hydrogen bonding network, which likely contributes to the depurination reaction. Substituting G16 for tzG in R1a might thus subtly perturb this intricate assembly, potentially lowering the population of catalytically active conformations, thus leading to its slightly slower depurination rate.
Figure 4.
a) Aromatic–aromatic interactions in saporin’s active site when bound to a cyclic tetranucleotide analogue of the RNA GAGA tetraloop, in which the susceptible adenosine has been replaced by 9-DA, a transition state analogue, illustrating the interaction between the latter and two tyrosine residues (PDB ID code 3HIW).[26] Nucleosides are shown in yellow and the amino acid side chains are shown in cyan. Inset: the structure of 9-DA. Generic numbering is shown as absolute numbering changes between species; A15 = A4324 in the rat 28S rRNA numbering. b) X-ray structure of the α-sarcin-ricin loop highlighting the GAGA tetraloop and its aromatic–aromatic interactions. c) X-ray structure of the α-sarcin-ricin loop highlighting A9–A21 and adjacent base pairs in the stem (PDB ID code 430D for b,c).[23] Images generated using MOE.
Intriguingly, when compared with R1 and R1a, the thG-containing R1b hairpin substrate showed a different reactivity pattern, with depurination predominantly at A9 rather than A15 (Figure 3b). This suggests that thG’s lower isomorphicity and G “mimicry”, when compared to tzG, particularly the lack of the basic N in the “N7” position, likely impacts the RNA substrate folding and recognition and thus the saporin-mediated depurination. As seen in the structure of the GAGA tetraloop (Figure 4b), the 2’-OH of G14 H-bonds to N7 of G16 (the residue replaced by either tzG or thG in the modified hairpin RNA strands R1a and R1b, respectively).[23] This missing attractive H bonding in the thG-containing hairpin RNA, coupled to the potentially repulsive OH•••HC interaction, might impact the substrate folding, leading to non-specific depurination that has previously been proposed.[27]
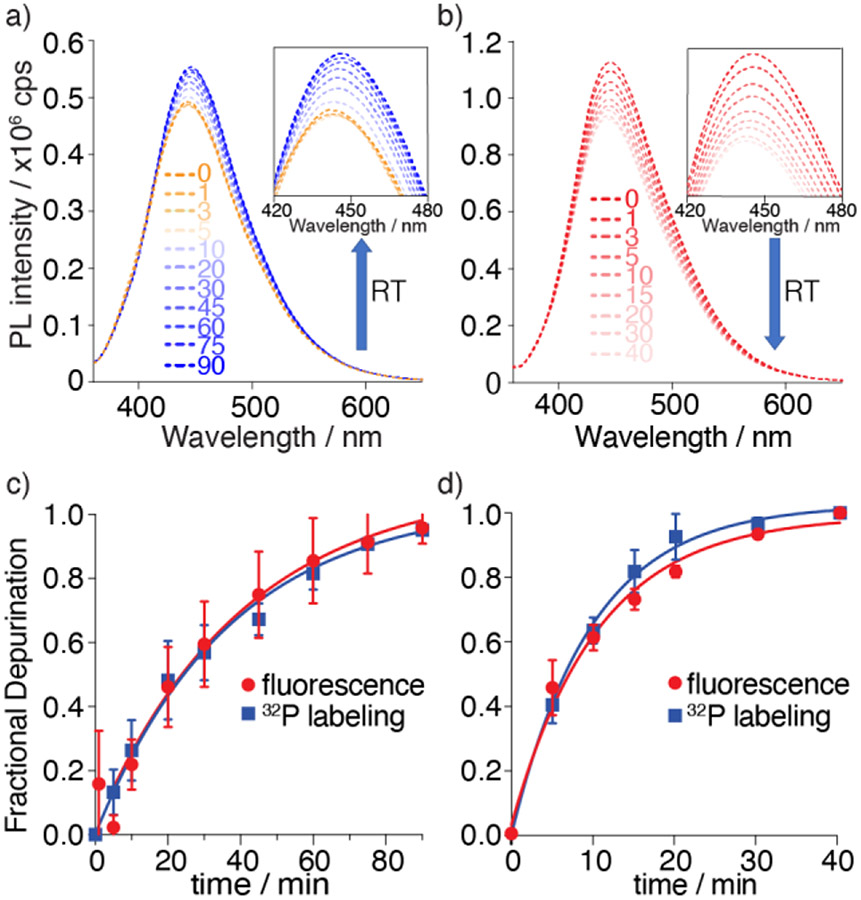
Having established the viability of R1a and R1b as RIP substrates, their photophysical response upon enzymatic depurination with saporin was monitored by steady-state fluorescence spectroscopy under the same reaction conditions as for the radiolabeled constructs. Emission spectra were recorded at given time intervals as shown in Figure 5. For the tzG substrate R1a, a noticeable decrease in fluorescence intensity was observed in the first 5 minutes, which was followed by steady increase as the reaction progressed. In contrast, a continuous fluorescence signal decrease was observed for the thG modified substrate R1b upon exposure to saporin (Figure 5b). As anticipated, while a noticeable fluorescence decrease was observed for R2a in the first 5 minutes (likely reflecting folding/binding) there was no significant fluorescence intensity change following the reaction progress (Figure S18).
Figure 5.
Top: Saporin-mediated depurination reaction of substrate R1a and R1b monitored by fluorescence as function of reaction time (RT), respectively. a) Emission spectra of depurination reaction of tzG substrate R1a. Excitation wavelength was 351 nm. Inset: Emission from 420 to 480 nm b) Emission spectra of depurination reaction of thG substrate R1b. Excitation wavelength was 351 nm. Inset: Emission from 420 to 480 nm. The area of each spectrum was integrated and plotted vs. time to yield the kinetics of the enzymatic reaction (c,d). c) Fractional depurination of R1a by saporin at various time points monitored by fluorescence (red) and 32P radiolabeling (blue). d) Fractional depurination of R1b by saporin at various time points monitored by fluorescence (red) and 32P radiolabeling (blue). Assays were done in triplicates. Error bars indicate SD.
To aid in interpreting these observations and to confirm that the fluorescence-monitored data represents the same molecular event as visualized using the corresponding radiolabeled substrates, the data sets were normalized and depicted on the same graph (Figure 5c, 5d). The apparent kinetic rate constants kapp, obtained by fitting pseudo-first order curves to the integrated area of each spectrum plotted against time, yielded values of 0.51 × 10⁻³ and 1.60 × 10⁻³ s−1 for substrate R1a, and R1b respectively (Figure 5c, 5d, Table 1). Notably, the apparent reaction rates generated by fluorescence for both R1a and R1b were in good agreement with the values extracted from the reactions visualized with the 32P-labeled substrates (Table 1), indicating the two techniques reflect the same molecular process and suggesting that fluorescence can indeed facilitate real-time monitoring of RIP-mediated RNA depurination.
Table 1.
Reaction rate constants for saporin mediated depurination.
| 32P-labeling[a] | Fluorescence[b] | ||||
|---|---|---|---|---|---|
| R1 | R1a | R1b | R1a | R1b | |
| k app [c] | 2.14 ± 0.07 | 0.48 ± 0.02 | 1.81± 0.06 | 0.51 ± 0.02 | 1.60 ± 0.08 |
| t 1/2 [d] | 3.24 ± 0.10 | 14.4 ± 0.5 | 3.84 ± 0.14 | 13.9 ± 0.5 | 4.36 ± 0.24 |
| R 2 | 0.998 | 0.996 | 0.998 | 0.994 | 0.994 |
Reaction rate constants were obtained by depurination reaction of 32P-5’-labeled substrate R1, R1a and R1b.
Reaction rate constants were obtained by measuring fluorescence change.
kapp is the pseudo-first-order rate constant [x10−3 s−1].
t1/2 is half-life [x102 s]. Data are presented as mean ± SD.
Interpreting the specific fluorescence signal changes is, as always, more challenging as the trends observed reflect the collective influence of dynamically interacting and not necessarily orthogonal microenvironmental perturbations. For R1a, a rapid drop in fluorescence was followed by a slow steady increase, which nicely correlated with the reaction kinetics as determined by the radiolabeled substrate. The early fluorescence drop observed for R1a likely reflects a substrate/enzyme binding event, which alters the folding and likely places the emissive nucleobase in a desolvated pocket (Figure 4a). Since the adenine at A15 stacks upon tzG at the G16 position (Figure 4b), its clipping generates a solvated and likely more polar void, which based upon the established photophysics of tzG should lead to higher emission quantum yield and a slight bathochromic shift,[20] as observed.
For R1b, which predominantly depurinates at A9, a decrease in fluorescence is seen. Since thG16 is not adjacent to the main depurination site, its photophysical change likely reflects a global conformational change of the depurinated RNA product. Since the A9–A21 pair lies between the Watson-Crick stem and the cross-strand stack (Figure 4c),[23] the lost hydrogen bond upon depurination of A9 disrupts this non-canonical pair, which likely results in partial collapse of the GAGA tetraloop. This thus alters the microenvironment of thG16 and its dynamics, leading to a change in its fluorescence.[28]
R2a, containing a tzG residue at position 14, undergoes enzymatic depurination (as independently established using PAGE, Figure S17). This, however, is not translated to fluorescence changes that follow the reaction kinetics beyond the initial drop, attributed to binding and refolding. Inspection of the structure shown in Figure 4b suggests that depurination of A15 is expected to be less environmentally perturbing (as it remains partially sandwiched between G16 and A17) when compared to the alteration of the stacked A15/G16 pair as in R1a, as hypothesized.
In summary, thG and tzG, highly isomorphic fluorescent nucleoside surrogates, are found to be accepted by several enzymes including T7 polymerase, T4 kinase and T4 ligase, allowing one to easily fabricate singly-substituted emissive RNA constructs. To advance the long sought-after direct monitoring of RNA depurination, we applied this protocol for the enzymatic preparation of consensus RIP hairpin substrates in which specific G residues, neighboring the depurination site, have been strategically replaced with these two emissive G surrogates. We demonstrated these enzymatic depurination reactions could indeed be monitored in real-time by steady state fluorescence spectroscopy. This unprecedented observation stands in contrast to other reported RIP-detecting methods, which all include either stepwise or time-consuming indirect processes (e.g., PCR-based techniques,[29] RNA/DNA probe hybridization,[19,30,31] aptamer-based,[32] enzyme-coupled assays,[15,33] mass spectrometry,[34] electrochemistry,[35] etc.). Monitoring a specific biochemical transformation associated with such RNA toxins (i.e., depurination), regardless of the protein immunological fingerprint, thus facilitates pathways for real-time detection of such cytotoxins and the fabrication of inhibitor discovery tools.
Supplementary Material
Acknowledgements
We thank the National Institutes of Health for generous support (through grant GM 139407) and the UCSD Chemistry and Biochemistry MS Facility.
Footnotes
Conflict of interest
The authors declare no conflict of interest
References
- [1].Sturm MB, Roday S, Schramm VL, J. Am. Chem. Soc 2007, 129, 5544–5550. [DOI] [PMC free article] [PubMed] [Google Scholar]
- [2].Law SK-Y, Wang R-R, Mak AN-S, Wong K-B, Zheng Y-T, Shaw P-C, Nucleic Acids Res. 2010, 38, 6803–6812. [DOI] [PMC free article] [PubMed] [Google Scholar]
- [3].Chan WY, Ng TB, Lam JSY, Wong JH, Chu KT, Ngai PHK, Lam SK, Wang HX, Appl. Microbiol. Biotechnol 2010, 85, 985–993. [DOI] [PubMed] [Google Scholar]
- [4].Chan YS, Ng TB, Appl. Microbiol. Biotechnol 2016, 100, 1597–1610. [DOI] [PubMed] [Google Scholar]
- [5].Lapadula WJ, Marcet PL, Mascotti ML, Sanchez-Puerta MV, Juri Ayub M, Sci. Rep 2017, 7, 1863. [DOI] [PMC free article] [PubMed] [Google Scholar]
- [6].Irvin JD, Uckun FM, Pharmacol. Ther 1992, 55, 279–302. [DOI] [PubMed] [Google Scholar]
- [7].Lord JM, Roberts LM, Robertus JD, FASEB J. 1994, 8, 201–208. [PubMed] [Google Scholar]
- [8].Domashevskiy AV, Goss DJ, Toxins 2015, 7, 274–298. [DOI] [PMC free article] [PubMed] [Google Scholar]
- [9].a) Lu J-Q, Zhu Z-N, Zheng Y-T, Shaw P-C, Toxins 2020, 12, 167; [DOI] [PMC free article] [PubMed] [Google Scholar]; b) Zarling JM, Moran PA, Haffar O, Sias J, Richman DD, Spina CA, Myers DE, Kuebelbeck V, Ledbetter JA, Uckun FM, Nature 1990, 347, 92–95. [DOI] [PubMed] [Google Scholar]
- [10].Cardinali B, Fiore L, Campioni N, De Dominicis A, Pierandrei-Amaldi P, J. Virol 1999, 73, 7070–7076. [DOI] [PMC free article] [PubMed] [Google Scholar]
- [11].Domashevskiy AV, Williams S, Kluge C, Cheng S-Y, Biochemistry 2017, 56, 5980–5990. [DOI] [PubMed] [Google Scholar]
- [12].Sun W, Sun J, Zhang H, Meng Y, Li L, Li G, Zhang X, Meng Y, Sci. Rep 2018, 8, 17729. [DOI] [PMC free article] [PubMed] [Google Scholar]
- [13].a) Polito L, Bortolotti M, Mercatelli D, Battelli MG, Bolognesi A, Toxins 2013, 5, 1698–1722; [DOI] [PMC free article] [PubMed] [Google Scholar]; b) Yuan H, Stratton CF, Schramm VL, ACS Chem. Biol 2016, 11, 1383–1390. [DOI] [PMC free article] [PubMed] [Google Scholar]
- [14].a) Puri M, Kaur I, Perugini MA, Gupta RC, Drug Discovery Today 2012, 17, 774–783; [DOI] [PubMed] [Google Scholar]; b) Walper SA, Lasarte Aragonés G, Sapsford KE, Brown CW, Rowland CE, Breger JC, Medintz IL, ACS Sens. 2018, 3, 1894–2024. [DOI] [PubMed] [Google Scholar]
- [15].Sturm MB, Schramm VL, Anal. Chem 2009, 81, 2847–2853. [DOI] [PMC free article] [PubMed] [Google Scholar]
- [16].Guo J, Shen B, Sun Y, Yu M, Hu M, Hybridoma (Larchmt) 2006, 25, 225–229. [DOI] [PubMed] [Google Scholar]
- [17].He X, McMahon S, McKeon TA, Brandon DL, J. Food Prot 2010, 73, 695–700. [DOI] [PubMed] [Google Scholar]
- [18].Kull S, Pauly D, Störmann B, Kirchner S, Stämmler M, Dorner MB, Lasch P, Naumann D, Dorner BG, Anal. Chem 2010, 82, 2916–2924. [DOI] [PubMed] [Google Scholar]
- [19].Srivatsan SG, Greco NJ, Tor Y, Angew. Chem. Int. Ed 2008, 47, 6661–6665. [DOI] [PMC free article] [PubMed] [Google Scholar]; Angew. Chem 2008, 120, 6763–6767. [Google Scholar]
- [20].Rovira AR, Fin A, Tor Y, J. Am. Chem. Soc 2015, 137, 14602–14605. [DOI] [PMC free article] [PubMed] [Google Scholar]
- [21].Shin D, Sinkeldam RW, Tor Y, J. Am. Chem. Soc 2011, 133, 14912–14915. [DOI] [PMC free article] [PubMed] [Google Scholar]
- [22].Tanaka KSE, Chen X-Y, Ichikawa Y, Tyler PC, Furneaux RH, Schramm VL, Biochemistry 2001, 40, 6845–6851. [DOI] [PubMed] [Google Scholar]
- [23].Correll CC, Munishkin A, Chan YL, Ren Z, Wool IG, Steitz TA, Proc. Natl. Acad. Sci. U. S. A 1998, 95, 13436–13441. [DOI] [PMC free article] [PubMed] [Google Scholar]
- [24].Li Y, Fin A, McCoy L, Tor Y, Angew. Chem. Int. Ed 2017, 56, 1303–1307. [DOI] [PMC free article] [PubMed] [Google Scholar]; Angew. Chem 2017, 129, 1323–1327. [Google Scholar]
- [25].Küpfer PA, Leumann CJ, Nucleic Acids Res. 2007, 35, 58–68. [DOI] [PMC free article] [PubMed] [Google Scholar]
- [26].Ho MC, Sturm MB, Almo SC, Schramm VL, Proc. Natl. Acad. Sci. U. S. A 2009, 106, 20276–20281. [DOI] [PMC free article] [PubMed] [Google Scholar]
- [27].Tan Q-Q, Dong D-X, Yin X-W, Sun J, Ren H-J, Li R-X, J. Biotechnol 2009, 139, 156–162. [DOI] [PubMed] [Google Scholar]
- [28].Kuchlyan J, Martinez-Fernandez L, Mori M, Gavvala K, Ciaco S, Boudier C, Richert L, Didier P, Tor Y, Improta R, Mély Y, J. Am. Chem. Soc 2020, 142, 16999–17014. [DOI] [PMC free article] [PubMed] [Google Scholar]
- [29].Melchior WB, Tollenson WH, Anal. Biochem 2010, 396, 204–211. [DOI] [PubMed] [Google Scholar]
- [30].Tanpure AA, Srivatsan SG, ChemBioChem. 2012, 13, 2392–2399. [DOI] [PubMed] [Google Scholar]
- [31].Tanpure AA, Patheja P, Srivatsan SG, Chem Commun. 2012, 48, 501–503. [DOI] [PubMed] [Google Scholar]
- [32].Esteban-Fernández de Ávila B, Lopez-Ramirez MA, Báez DF, Jodra A, Singh VV, Kaufmann K, Wang J, ACS Sens. 2016, 1, 217–221. [Google Scholar]
- [33].Mei Q, Fredrickson CK, Lian W, Jin S, Fan ZH, Anal. Chem 2006, 78, 7659–7664. [DOI] [PubMed] [Google Scholar]
- [34].Bevilacqua VLH, Nilles JM, Rice JS, Connell TR, Schenning AM, Reilly LM, Durst HD, Anal. Chem 2010, 82, 798–800. [DOI] [PubMed] [Google Scholar]
- [35].Oliveira G, Schneedorf JM, Toxins 2021, 13, 238. [DOI] [PMC free article] [PubMed] [Google Scholar]
Associated Data
This section collects any data citations, data availability statements, or supplementary materials included in this article.


