

Summary
Social isolation, particularly in early life, leads to deleterious physiological and behavioral outcomes. Here, we leverage new high-throughput tools to comprehensively investigate the impact of isolation in the bumblebee, Bombus impatiens, from behavioral, molecular, and neuroanatomical perspectives. We reared newly emerged bumblebees either in complete isolation, small groups, or in their natal colony, and then analyzed their behaviors while alone or paired with another bee. We find that when alone, individuals of each rearing condition show distinct behavioral signatures. When paired with a conspecific, bees reared in small groups or in the natal colony express similar behavioral profiles. Isolated bees, however, showed increased social interactions. To identify the neurobiological correlates of these differences, we quantified brain gene expression and measured the volumes of key brain regions for a subset of individuals from each rearing condition. Overall, we find that isolation increases social interactions and disrupts gene expression and brain development. Limited social experience in small groups is sufficient to preserve typical patterns of brain development and social behavior.
Graphical Abstract

Blurb
Wang et al. probe the effects of early life isolation on the behavior and neurobiology of bumblebees. Isolation increases social contact but alters the type and specificity of social interactions. Isolation also alters brain development and gene expression, but even limited social experience can preserve typical social behaviors and neurobiology.
Results and Discussion
Social animals rely on interactions with conspecifics to survive. Isolation from the social group leads to detrimental impacts on physical health, fitness, and even longevity1–6. The effects of social isolation are even more profound during sensitive developmental periods, such as in early life, when social experiences may strongly influence an individual’s “social competence”, the ability to adapt behavior according to changes in social context7–9. This can lead to poorer developmental or fitness outcomes10. For example, increased aggression across social contexts is a common consequence of social isolation in mice11,12, fish8,13, flies14–16, and crickets17,18.
The early life environment may also impact social competence in the social insects, who live collectively in colonies ranging from a few individuals to millions19. A growing body of research shows that social isolation impacts the behavior and physiology of bees20–22, ants1,2,4,23,24, and wasps25–27. Here, we investigate the impacts of social isolation in the bumblebee, Bombus impatiens, on individual and social behavior, gene expression, and neuroanatomy.
Bumblebees live in social colonies consisting of about 100–200 female workers and a single queen28. Within the colony, individuals display consistent differences in behavior that are stable over time and context. These behavioral repertoires are established in the first 1–2 weeks of adulthood through pairwise and spatial interactions among individuals29–32. During this same period in early adulthood, the bumblebee brain is rapidly developing33. To determine if and how social isolation impacts social behaviors in this species, we experimentally altered the social environments of workers during this early life developmental period, and then assayed individual bee behavior either alone or paired with a social partner.
To alter the early life social experiences of bumblebees, we developed a modular housing chamber to isolate residents from external auditory, visual, and odor cues (STAR Methods, Figure 1A). We collected newly-eclosed callow females, recognizable by their silvery appearance and sluggish behavior in the colony28, and split them amongst 3 different early life treatment conditions: isolation (Iso, n = 96 for behavior, n = 16 for RNAsequencing, n = 20 for imaging), in which a single bee is housed in complete social isolation; group-housed (Grp, n = 113 for behavior, n = 15 for RNAsequencing, n = 24 for imaging), in which four nestmates are co-housed outside the colony; and colony-housed (Col, n = 99 for behavior, n = 9 for RNAsequencing, n = 22 for imaging), in which the individual is immediately returned to her natal colony (Figure 1A). Bees were kept in their treatment condition for 9 consecutive days, thus isolated bees were reared completely devoid of social experiences and group- and colony-housed bees experienced varying amounts of socialization. On post-eclosion day 10, behavioral assays were performed and tissues were collected for downstream analysis. 308 bees were included in the behavioral trial assays, 40 bees in the transcriptome analyses, and 66 bees in the volumetric analyses (see STAR Methods for details). Different sets of individuals were used for each downstream analysis (behavior, brain gene expression, brain morphology), precluding analyses that combined multiple datasets.
Figure 1. Early life rearing condition alters adult behavior in the bumblebee.
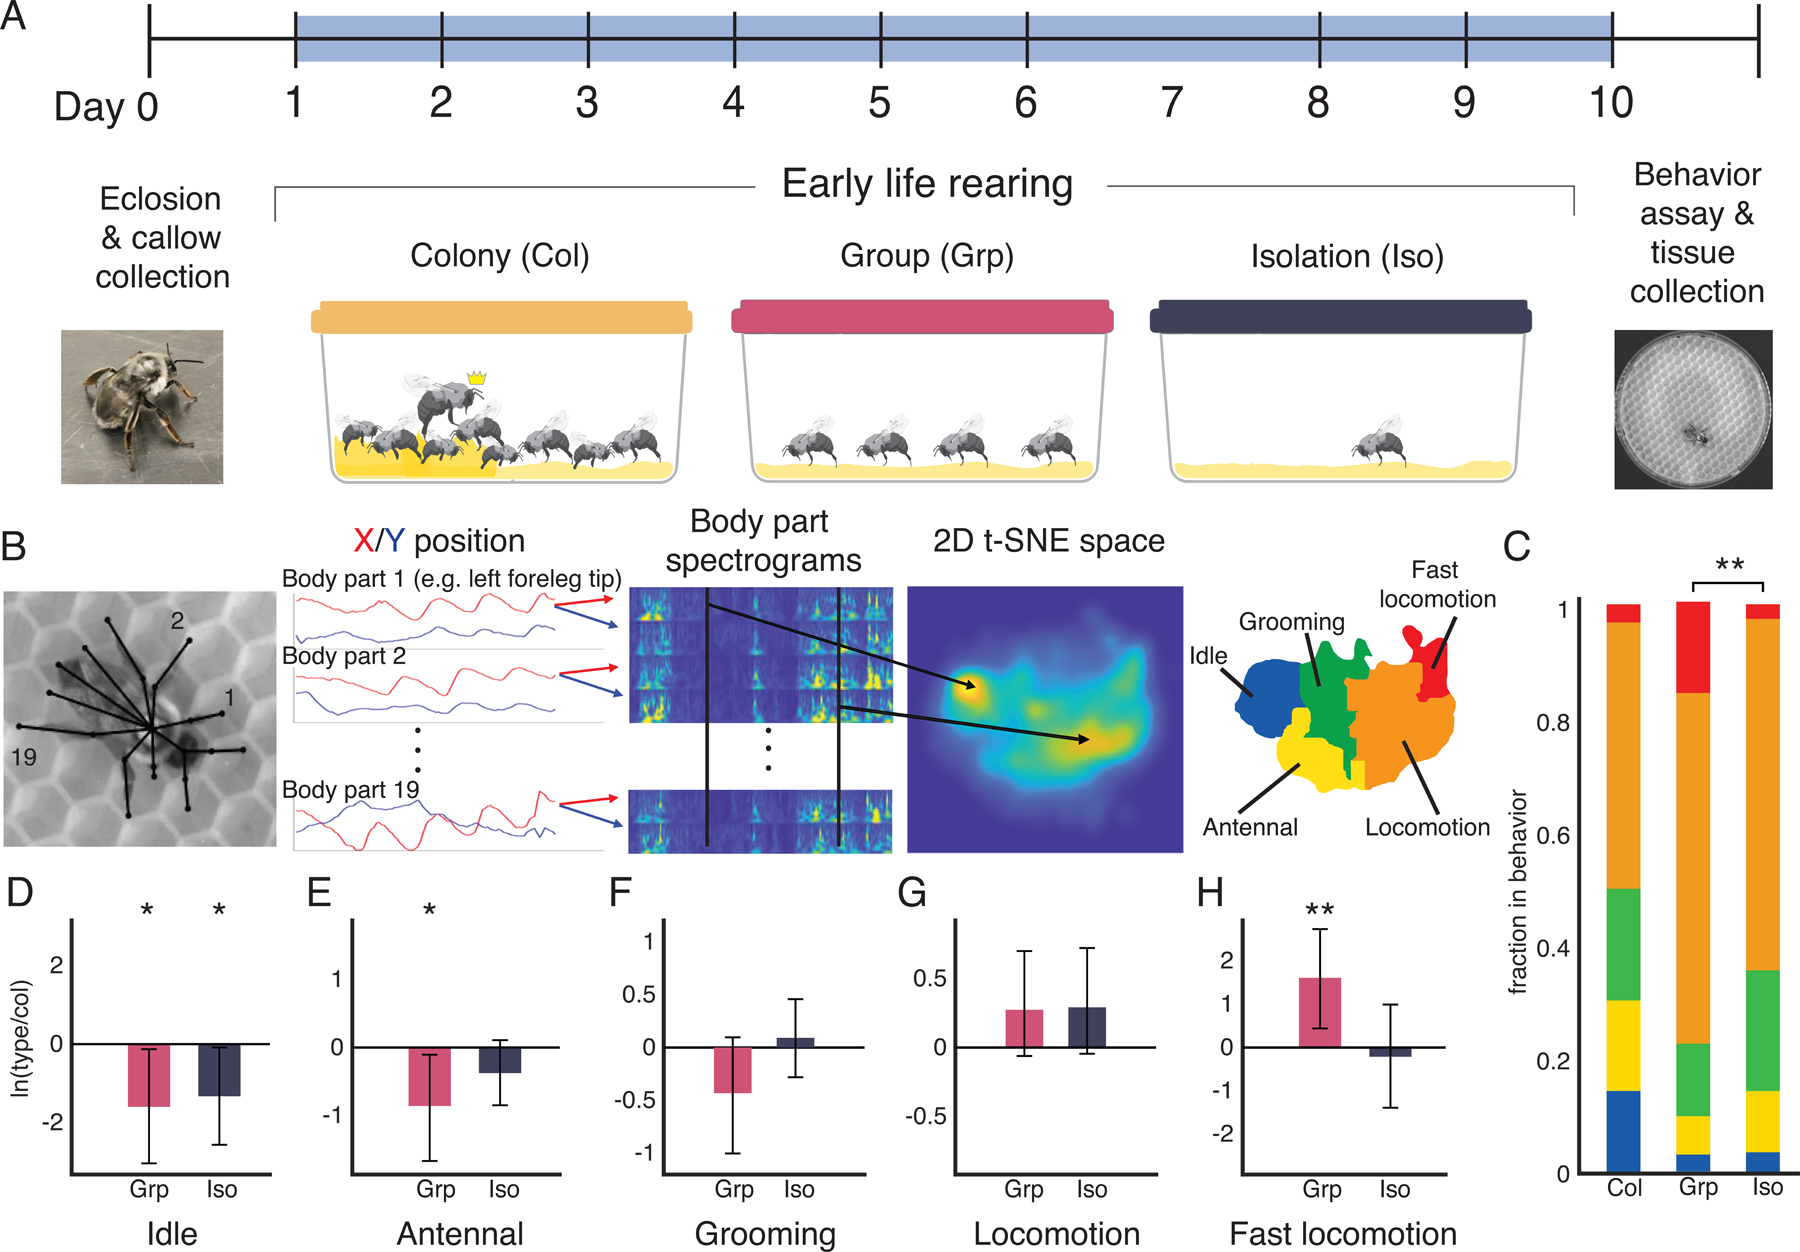
A. Experimental overview. Newly emerged callows, identified by their silver-white pigmentation and slow, sluggish gait, were assigned to one of three treatment conditions: colony (col) in which the individual is returned to her natal colony; group (grp), in which four nestmates are co-housed outside of the colony; and isolation (iso), in which a single bee is housed in complete social isolation. Colony-reared bees had access to the queen (indicated by crown), nestmates, and nest. Yellow substrate indicates artificial beeswax used as substrate in each of the rearing chambers (see STAR Methods). Bees were housed in these treatment conditions for 9 consecutive days. On post-eclosion day 10, bees were collected for behavioral and neurobiological assays. B. Behavioral assay and embedding. Freely-behaving bees were recorded from above for 30 minutes under IR illumination. Bees were assayed in either solo or paired contexts. SLEAP was used to track body parts and bee identity over the duration of the behavioral assay (black overlay, see Video S1 for tracking example). The spectrograms of body part time traces from all assayed bees were embedded together into a two-dimensional space using t-SNE. Regions of high density were clustered using a watershed transform, then grouped together according to their common behavior motifs into a behavior map of 5 discrete behaviors: idle, antennal behaviors, grooming, locomotion, and fast locomotion. For full details, see STAR Methods, Figure S1, and Video S2. C. Time use compositions. Isolated and group-reared bees differ significantly in their time usage compositions (nonparametric multivariate test on ilr transformed fractions, Wilks’ Lambda type statistic. ** indicates p<0.01). No significant differences were found between isolated and colony-reared bees (p > 0.07), or group- and colony-reared bees (p>0.15). N=29 for isolated bees, N=36 for group-reared bees, and N=31 for colony-reared bees. D-H. Compositional analysis of discrete behaviors. There are significant differences across solo bees in the idle, antennal, and fast locomotion behaviors as quantified by the log ratio differences between geometric means of iso or grp bees vs. col bees (error bars are bootstrapped 95% confidence intervals). Differences are considered significant in the bootstrapped 95% confidence intervals do not overlap 0. *p<0.05, **p<0.01.
We captured the behavior of experimental bees by themselves (“solo”) and with another bee (“paired”) by recording their free behavior in a 10 cm petri dish for 30 min under infrared illumination, which bees cannot see34. For paired conditions, we assayed same-treatment pairs (Iso+Iso, Grp+Grp, Col+Col) as well as each possible combination (Iso+Grp, Iso+Col, Grp+Col, and Grp bees from separate groups) (Figure S1-2). To quantify the behavior of the bees, we used the MotionMapper technique35. We first used the SLEAP36 pose tracking software to identify body parts in each frame (Figure 1B, Video S1), and then performed a continuous wavelet transform on the body part position time series. The concatenated spectral densities were then embedded into two dimensions using t-distributed stochastic neighbor embedding (t-SNE), and a probability density function of time spent at each location of the t-SNE space revealed peaks corresponding to commonly repeated body part dynamics (Figure 1B, Figure S1, see STAR Methods for details). We segmented the embedded space via a watershed transform to separate regions of stereotyped limb dynamics. We assigned each region to one of five discrete behavior states based on corresponding video clips: idle (no movement), antennal movement, grooming, locomotion, and a fast locomotion behavior mostly seen in solo trials of group-reared bees (Figure 1, Figure S1, Video S2). This enabled us to define discrete behavior composition profiles for each bee and pinpoint behavioral biases in each treatment group. Colony-reared bees spend more time idle than group-reared or isolated bees, and group-reared bees spend much more time in fast locomotion than colony-reared or isolated bees (Figure 1C).
To quantify differences in the behavioral profiles of each treatment group using compositional data analysis principles37,38, we carried out an isometric log-ratio (ilr) transform on the discrete behavior fractions to express the data in terms of four independent components. We performed a non-parametric multivariate analysis on the ilr components and found a significant difference between the overall behavioral profiles of the solo isolated and group-reared bees (Wilks’ Lambda type statistic, p<0.01, Figure 1C). To examine how specific behaviors differ between the colony- and group-reared or isolated bees we calculated the log-ratio of the geometric means across individuals for each behavior component using colony-reared bees as the control group in the denominator. Compared to colony-reared bees, we find that idle behaviors are suppressed in both group-reared and isolated individuals and that group-reared bees exhibit elevated levels of fast locomotion and suppressed antennal behaviors (Figure 1D-H; see STAR Methods for details). These data are supported by quantification of the bees’ instantaneous speeds over the course of the behavior assay (Figure S1E). These patterns are distinct from those found in ants, where individuals isolated from the colony exhibit increased locomotor activity compared to their colony-housed nestmates3. Overall, our data demonstrate that, in solo contexts, bees from all three treatment groups diverge in behavior in unique ways, demonstrating the impact of early life environments on individual behavior.
To characterize the effect of isolation on social behavior, we next investigated pairwise interactions, which are considered the building blocks of group behavioral dynamics39. We began by quantifying how often paired bees were in close proximity. We divided the distribution of interthorax distances of paired bees by the distribution that would result from random arrangement, allowing us to examine enrichment of specific interthorax distances compared to random chance (Figure 2A). For clarity, we present the results of only the same-treatment pairs, but all pairwise comparisons are presented in the Supplement (Figure S2). To determine whether distance from a social partner impacts a bee’s overall behavioral repertoire, we quantified changes in the behaviors of paired bees depending on their distance from a social partner. We calculated the Jensen-Shannon divergences (a measure of the difference between probability distributions) between limb dynamics (i.e. the average t-SNE embedded spaces of bees) at different interthorax distances in 0.2 cm intervals and the limb dynamics at an interthorax distance of 8 cm apart (representative of dynamics at ‘far’ distances)40 (Figure 2B). We accounted for artifacts produced by tracking errors or confined motion by eliminating data from frames in which the bees touched each other or the edge of the arena. We find that, across all pairing types, behavior changes strongly with distance when the bees are less than 2 cm (roughly two body-lengths) apart but that the bees’ behavior is largely unaffected by the partner at larger distances (Figure 2A). Based on these results, we define bees to be affiliated when their interthorax distance is less than 2 cm and unaffiliated when they are farther apart. This is concordant with previous studies defining social interactions in a similar range32. Our results show that the occupancy of pairs of isolated bumblebees is the most strongly enriched for close interthorax distances (<2 cm) compared to same-treatment pairs of colony- or group-reared bees, as indicated by the non-overlapping standard error regions (Figure 2A). Therefore, unlike socially isolated honey bees20, isolated bumblebees spend the most time affiliated with social partners across all pairings. We also find that pairs of colony-reared bumblebees are significantly more likely to be separated by large interthorax distances compared to the null model, again differing from the previously observed behavior of colony-reared honey bees20.
Figure 2. Isolated bumblebees display altered social interactions.

A. Bees are considered to be affiliated at interthorax distances of 2 cm or less (within the vertical dotted line). Pairs of isolated, group-, and colony-reared bees are enriched within this distance compared to the null (occupancy above horizontal dashed line, which indicates expected level for randomly arranged bees). The standard error of each distance bin, calculated in 1/3 cm increments, is indicated by the shaded regions. See Figure S2 A-I for affiliation analysis for all pairings. B. The difference in overall behavior map calculated at each interthorax distance and then compared to a ‘far’ distance of 8 cm using Jensen-Shannon divergence indicates a difference in behavior that drops off after 2 cm. N=12 pairs of isolated bees (24 bees total), N=15 pairs of group-reared bees, and N=14 pairs of colony-reared bees. C. Isolated bees spend significantly more time in the idle and antennal states, and less time in the locomotion and fast locomotion states when affiliated, as indicated by the affiliative enrichment score (i.e. the log ratio of the geometric means of time spent in each behavior). Positive values in these plots indicate enrichment of the behavior when affiliated compared to unaffiliated while negative values indicate de-enrichment of the behavior when affiliated. Differences are considered significant in the bootstrapped 95% confidence intervals do not overlap 0. *p<0.05, **p<0.01, ***p<0.001, determined by confidence interval overlap with 0. D. Pairs of isolated bees differ from pairs of colony bees if the change in occupancy of the antennal state when affiliated, and differ from both pairs of colony bees and pairs of grouped bees in the change in occupancy of the locomotion and fast locomotion states when affiliated (Kruskal-Wallis test, Wilcoxon rank sum for pairwise comparisons with Bonferroni correction, *p<0.05, **p<0.01, ***p<0.001). Positive and negative values indicate enrichment or depression of the behavior, respectively, when affiliated. E. Antennal (yellow), abdominal (green), and body (red) edges define where antennation occurs. F. Pairs of same-rearing-condition bees engage in more antennae-to-antennae touches per available edge space compared to antennae-to-abdomen or antennae-to-body touches (Kruskal-Wallis test, Wilcoxon rank sum for pairwise comparisons with Bonferroni correction, **p<0.01, ***p<0.001) See Figure S2 J-L for disaggregated antennal touches of same-rearing-conditions pairs. G. Pairs of isolated bees have significantly more variance in the amount of time they spend antennae-to-antennae than group- or colony-reared bees (Fligner-Killeen median test with F approximation, +p<0.05, ++p<0.01).
We next calculated the affiliative enrichment for each discrete behavior component, defined as the log-ratio of the fraction of time spent in each behavior when affiliated vs. unaffiliated. Positive affiliative enrichment indicates a behavior occurs more often during affiliation, and negative affiliative enrichment indicates a behavior occurs less during affiliation. To investigate the effect of affiliation on specific behaviors, we calculated the affiliative enrichment for each behavior using the geometric mean across bee replicates and bootstrapped these means to calculate confidence intervals (N=5000, Figure 2C). We find that isolated bees exhibit significant enrichment or depletion for four out of five behaviors. Isolated bees engage in more idle and antennal behaviors and less locomotion and fast locomotion when affiliated. In contrast, the group- and colony-reared bees only show a significant change (an increase) in grooming between the affiliated and unaffiliated states (Figure 2C).
To compare the effect of affiliation on behavior across different rearing conditions, we calculated the affiliative enrichment for each individual bee in our same-rearing-condition pairings. We find that the median affiliative enrichment differs between isolated and colony-reared bees for three behaviors (antennal, locomotion, and fast locomotion) and between isolated and group-reared bees for fast locomotion, but does not differ between group- and colony-reared bees (Figure 2D). Together these data suggest that, amongst the three rearing conditions, bees raised in isolation spend the most time affiliated with a social partner and demonstrate the greatest changes in behavior when affiliated.
Affiliation and other modes of social cooperation often rely on the ability to discriminate between nestmates and non-nestmates. Bumblebees and other social insects primarily do this with chemical signals they detect via chemosensory receptors on their antennae41,42. The chemical composition of these signals can vary across body parts43,44, so where the antennae make contact may indicate targeting a particular subset of odorants over others. We normalized antennal touches to the antennal, abdominal, and body zones of the partner bee by the fraction of the total available edge of the bee each defined zone occupied (Figure 2E-F). These results show that pairs of same-rearing-condition bees have significantly more antennae-to-antennae touches than antennae-to-abdomen or antennae-to-body (Wilcoxon rank sum test, p<0.001) (Figure 2F). Pairs of group-reared and isolated bees show overall higher levels of antennal touching than colony-reared bees, and qualitatively higher levels of relative antennae-to-antennae touches than other modes (Figure S2J-L). However, pairs of isolated bees have no statistically significant differences in their propensity to engage in antennae-to-antennae, antennae-to-abdomen, or antennae-to-body touches, suggesting a loss of specificity in this mode of social interaction. Focusing on the antennae-to-antennae mode of touching preferred by our control group, we find that same-rearing-condition pairs all spent comparable fractions of time engaging in antennae-to-antennae touching, but that isolated bees showed significantly higher variance in this behavior compared to colony- and group-reared bees (Figure 2G). Our data show that early life social experience modulates propensity to engage in antennal touches, and may affect the specificity of the behavior. Similar observations have been made in ants, where isolation from the natal colony results in increased social interactions (e.g. trophallaxis) and reduced aggression towards non-nestmates1,2,4.
Together, the results from our behavioral assays demonstrate that the early life social environment induces changes in key social behavioral features later in life. Both isolated and group-reared bees showed perturbed behavioral profiles in solo contexts compared to colony-reared bees. However, in paired assays isolated bees have broad and significant changes to their behavior when near a partner bee – they exhibit decreased locomotion and increased idle and antennal behaviors when affiliated. In contrast, the behaviors of both group- and colony-reared bees are largely unaffected by proximity to a social partner. Isolated bees also show a large variance in the amount of time they spend in antennae-to-antennae contact with a partner bee, while group- and colony-reared bees are more uniform. This suggests that, while the extra-hive environment of the group-rearing condition alters the behavior of bees when they are alone, only the isolated bees have perturbed behavior in the presence of a social partner. In contrast, the observed social behaviors of group-reared bees remain intact, suggesting that even reduced group sizes may be sufficient to maintain many aspects of typical social interactions in social insects3,4.
The behavioral differences we identified between isolated and group-reared bees suggests that there may be underlying neurobiological differences between these experimental groups. To better understand the molecular underpinnings of these behavioral changes, we performed whole brain transcriptome sequencing on a subset of treatment bees (isolated, n=16; group, n=15; colony, n=9) using TM3’seq, a tagmentation-based 3’-enriched RNA-sequencing approach45. We first performed an analysis of differentially expressed genes (DEGs) across treatment groups, blocking for natal colony (Figure 3A, see STAR Methods).
Figure 3. Social isolation disrupts bumblebee neurogenomic landscape.

A. Differential gene expression analysis. The expression of 94 genes was significantly different between isolated and colony-reared bees (DESeq2, FDR<0.05). The expression of 27 genes was significantly different between isolated and group-reared bees. Venn diagram shows 6 genes that overlap between these two sets. No genes were differentially expressed between group- and colony-reared bees. See Data S1 for all differentially expressed genes. See Data S2 and Figure S3 for GO term enrichment analysis. B-G. Normalized counts of the 6 overlapping genes differentially expressed between isolated bees versus group- or colony-reared bees. apoLp: apolipophorins, csad: cysteine sulfinic acid decarboxylase; hsp83: heat shock protein 83; 97hsp: 97kDa heat shock protein; ltk: leukocyte tyrosine kinase receptor; srrm2: serine/arginine repetitive matrix protein 2. H. WGCNA-generated eigengene network heatmaps for colony- and group-reared bees. I. Eigengene network heatmaps for isolated bees. See STAR Methods and Figure S4 for details. For full module membership, see Data S3. J. Heatmap showing preservation between the two networks (1-absolute difference of the two eigengene networks). Darker cells indicate stronger preservation. K. Inter- and Intra- module relationships. Barplot showing mean preservation of relationships for each eigengene between colony- and group-reared and isolated bees (inter-module relationships). Numbers indicate mean intra-module correlation within the colony- and group- reared (C+G) and isolated (I) data sets. See Table S1 for details.
In pairwise comparisons, brain transcriptomes of isolated bees showed distinct differences from those of group- and colony-reared bees. We found strong differences in brain gene expression between isolated and colony-reared bees (94 DEGs, FDR < 0.05) and modest differences between isolated and group-housed bees (27 DEGs, FDR < 0.05) (Figure 3A, see Data S1 for full list of genes). Overall, most DEGs showed decreased expression in isolated bees as compared to either of the other two rearing conditions (Data S1). Surprisingly, no DEGs wereidentified between group and colony-reared bees (Figure 3A). A GOterm enrichment analysis demonstrates that social isolation impacts molecular systems important to social communication, including an enrichment of annotated terms relating to the regulation of steroid biosynthetic processes (known to be associated with insect endocrine signaling and pheromone production46) not found in the Colony- or Group-reared bees (Figure S3, Data S2). Overall, our transcriptomic data shows that, much like the changes we observed in behavior, complete social isolation induces significant changes in the expression of key neuromolecular systems important for social living while group-rearing does not significantly alter whole-brain gene expression.
Six genes are common to the set of isolated vs. group-reared DEGs and the set of isolated vs. colony-reared DEGs (Figure 3B-G). Two of these genes participate in the signaling of juvenile hormone (JH): apolipophorins (apoLp, Figure 3B) and heat shock protein 83 (hsp83, Figure 3D). In social insects, JH signaling serves as a crucial regulator of reproductive differentiation and social behavior47–52. ApoLp and hsp83 are among the suite of proteins that orchestrate the transport of JH to its sites of utilization and initiate its downstream effects50,53. In addition, heat shock proteins have previously been identified as key conserved members of the neurogenomic response to social challenge in the honey bee, mouse, and stickleback54. The differential expression of apoLp, hsp83, and 97hsp in our transcriptomic data sets strongly suggests that social isolation disrupts signaling of JH in bumblebees, highlighting the importance of this pathway in regulating social behaviors across insects55.
Whereas differential gene expression considers each gene individually, network analysis provides insight on the global network properties of the transcriptome. To better understand the gene expression differences across treatment groups, we investigated the gene network dynamics using weighted gene co-expression network analysis (WGCNA56). To emphasize network changes induced by isolation, and because there was no evidence for significant differences in gene expression between the colony- and group-reared bees, we combined transcriptomic data from both groups into a single set for this analysis (for disaggregated data, see Figure S4). We constructed global co-expression networks using data from isolated bees and the combined set of group and colony-reared bee data, then identified modules of genes with linked co-expression (Figure S3, STAR Methods).
To establish concordance and divergence in the network organization between isolated and socially-experienced bees, 16 consensus modules were derived from the weighted average of the two correlation matrices from each behavioral background (Figure 3, Figure S3, Data S3, STAR Methods). We then tested the null hypothesis that there are no differences in the correlation matrices amongst all gene modules in the isolated as compared to that of the socially-experienced bees (inter-module connectivity, Figure 3H-K). This analysis reveals dysregulation of isolated bee transcriptomes at the module level, captured in Figure 3J, in which numbers closer to 1 indicate more robustly preserved correlations (high preservation), and numbers closer to 0 indicate poorly preserved correlations (low preservation). Genes in the cyan module, for example, show low preservation in its adjacency relationships to other modules in isolated (I) compared to the colony- and group-reared (C + G) bees (Figure 3J, Data S3). We then examined intra-module connectivity by calculating the mean correlation of all possible combinations of pairwise gene expression values within each module. For the cyan module, this value is 0.32 in colony- and group-reared bees and 0.28 in isolated bees (Figure 3K), indicating a statistically significant decrease in gene expression correlations in isolated bees. Looking across all modules, genes in modules from the isolated bee data set tended to show higher intra-module connectivity than those in the colony- and group-reared data set (Figure 3K, Table S1). Together, our data reveal that social isolation leads to both intra- and inter-module dysregulation of the brain transcriptome (Figure 3H-K).
Given the influence of isolation on brain gene expression, we next interrogated whether social isolation causes broad changes in brain development. These effects are well described in vertebrates57, and growing evidence suggests that isolation can impact insect brains as well4,21,25,26. For example, work in ants has demonstrated that prolonged social isolation in early life can impair the development of key brain regions linked to sensory integration, learning, and memory4. The early developmental period in bumblebees is marked by changes in neuropil volume, which reach an adult state around 9 days after eclosion33. This maturation process is likely influenced by diverse processes such as learning, endogenous hormone signaling, and experience, including social experiences58–60. To determine how the social rearing environment may impact the development of the bumblebee brain, we created an annotated brain template using the full confocal imaging stack of a representative worker bee brain (Figure 4A-B, Video S3). Individual confocal stacks of experimental bees (isolated n=20, group-reared n=24, colony-reared n=22; step size 2.542 μm) were fitted to this template for volumetric analysis, and voxels to neuropil regions of interest were summed. To account for individual variation in brain size, we divided the voxels in neuropils of interest by all measured voxels in the brain sample to derive a volume fraction for each bee (Figure 4C-F).
Figure 4. Social isolation destabilizes development of the bumblebee brain.

A. Confocal slice from the median volume brain used to generate volumetric bumblebee brain atlas. Neuropil label colors correspond to segmented regions in B. For full annotation, see Video S3 and STAR Methods. B. Segmented volumetric brain atlas. Antennal lobes: purple; Central complex: red; Mushroom bodies: blue; Optic lobes: green. C-F. Neuropil volume fractions (raw voxels in area of region/ total voxels, see Figure S5 for details). In all regions, the variance was significantly different between the brains of isolated bees and that of group- and colony-reared bees (Fligner-Killeen test, + indicates p value<0.05).
We find that, while the mean volume fractions of all brain regions were similar across treatment conditions, the variances of the volume fractions were significantly different (Figure 4C-F; Figure S5). For all neuropil regions, inter-individual variance is low amongst colony- and group-reared bees, indicating homogeneity across individuals, but this variance is high in isolated bees (Figure 4C-F; Figure S5). Our results are different from prior studies in social insects, which use manual segmentation methods to measure absolute volumetry4,33,61 (though data from previous studies suggest differences in inter-individual variation exist in these studies as well33,61). The automated methods we report here enable quantification of brain volumes at much finer scale than previous studies and reduces the potential of human bias.
The close coherence between the brains of group- and colony-reared bees, and the increased variation observed in antennae-to-antennae contact and in the brains of isolated bees, strongly implies that the social environment acts as a powerful buffering force on the development of the bumblebee. In the complete absence of social cues, the brain may become vulnerable to decanalization, defined as deviations from an optimized phenotype62–64. In other words, it appears that social isolation destabilizes and stochastically changes the developmental trajectory of the brain, leading to the greater variation in neuropil volumes observed. This increased variation may be mediated by changes in gene expression or gene network relationships and may help to explain the greater variation we observed in antennae-to-antennae contact, a key aspect of social interactions in isolated bees.
Taken together, our results demonstrate that the early life social environment shapes adult behavior in bumblebees, and that these effects are prominent in social contexts. While all three cohorts had different behavioral repertoires in solo assays, isolated bees showed unique behavioral responses induced by social affiliation that neither group- nor colony-reared bees exhibit – they spend more time with social partners and exhibit reduced specificity in behaviors essential for social communication (head-to-head antennation). Isolated bees also demonstrate greater inter-individual variance in antennation behavior and brain physiology.
The behavioral impacts of social isolation we observe in bumblebees may be a signature of reduced social competency similar to those described in vertebrates7–9. Social competence, or the ability of an individual to modulate social behaviors depending on context, relies on behavioral flexibility and information perception7,9. The loss of specificity in antennation (Figure S2), for example, may be an indication of lower social competence in isolated bees. Whether these behavioral changes are due to perturbations in the ability to detect social cues, process the salience of relevant cues, or produce appropriate cues remains unknown. Curiously, lower social competency in vertebrates commonly manifests as inappropriate or increased aggression8,65–67. In our study, isolated individuals did not express behaviors typical of aggression in bumblebees, such as darting, biting, or wing-buzzing68–70, coherent with studies in ants suggesting that isolation leads to decreased aggression2,4. This may point to an important difference in social competency between vertebrates and the social insects.
Bumblebee colonies are known to have high levels of social tolerance, even to non-kin bees71, and agonistic behaviors typically manifest during the competition phase of the colony cycle when workers are much older68,69. It is possible that the behavioral profiles of isolated bees may change over time, either with age or with varying degrees of exposure to social conspecifics. How the isolation-induced behavioral and neurogenomic changes we report here evolve over the course of a bumblebee’s lifespan remains an exciting open question. Our study lays the foundation for future research that directly assesses these potential causes as well as the costs of social isolation.
STAR Methods
RESOURCE AVAILABILITY
Lead contact
Further information and requests for resources and reagents should be directed to and will be fulfilled by the Lead Contact, Sarah Kocher (skocher@princeton.edu).
Materials availability
This study did not generate new unique reagents.
Data and code availability
All transcriptomic data is deposited in the NCBI SRA database under BioProject ID PRJNA787650 and are publicly available as of the date of publication. Accession numbers are listed in the key resources table.
Brain segmentation data and original code is available on github at https://github.com/kocherlab/BumblebeeIsolation. These data are publicly available as of the date of publication, and the DOI is listed in the key resources table.
Any additional information required to reanalyze the data reported in this paper is available from the lead contact upon request.
Key resources table
| REAGENT or RESOURCE | SOURCE | IDENTIFIER |
|---|---|---|
| Biological samples | ||
| Common eastern bumblebee, Bombus impatiens | Koppert Biological Systems, Howell, MI, USA | https://www.koppertus.com/ |
| Chemicals, peptides, and recombinant proteins | ||
| RNAlater Ice | Invitrogen | AM7030 |
| Methyl salicylate | Sigma Aldrich | M2047 |
| Critical commercial assays | ||
| Dynabeads mRNA DIRECT kit | Invitrogen | 61011 |
| Deposited data | ||
| Bombus impatiens genome | Sadd73 | NCBI, BIMP_2.2, GCF_000188095.3 |
| Bombus impatiens brain bulk transcriptomic sequencing | This study | NCBI SRA database PRJNA787650 |
| Bombus impatiens brain segmentation and atlas data | This study | https://github.com/kocherlab/BumblebeeIsolation |
| Code | This study | https://github.com/kocherlab/BumblebeeIsolation |
| Software and algorithms | ||
| SLEAP | Pereira36 | sleap.ai |
| Nikon Elements | Nikon | https://www.microscope.healthcare.nikon.com/products/software/nis-elements |
| ITK-SNAP | Yushkevich83 | itksnap.org |
| MotionMapper | Berman35 | https://github.com/gordonberman/MotionMapper |
| TM3’seq data processing | Pallares45 | https://github.com/Lufpa/TM3Seq-Pipeline |
| Trimmomatic | Bolger72 | http://www.usadellab.org/cms/?page=trimmomatic |
| STAR | Dobin74 | https://github.com/alexdobin/STAR |
| SAMtools | Li75 | http://www.htslib.org/ |
| DESeq2 | Love79 | https://bioconductor.org/packages/release/bioc/html/DESeq2.html |
| Trinotate | Grabherr78 | https://github.com/Trinotate/Trinotate.github.io/blob/master/index.asciidoc |
| topGO | Alexa79 | https://bioconductor.org/packages/release/bioc/html/topGO.html |
| GO-Figure | Reijnders80 | https://gitlab.com/evogenlab/GO-Figure |
| Weighted gene correlation network analysis | Langfelder81 | https://horvath.genetics.ucla.edu/html/CoexpressionNetwork/Rpackages/WGCNA/ |
| Correlation by Individual Level Product | Lea82 | https://github.com/AmandaJLea/differential_correlation |
| elastix | Klein84 | https://elastix.lumc.nl/ |
| Other | ||
| 2.8 mm grinding bead | OPS Diagnostics | GBSS 089–5000-11 |
EXPERIMENTAL MODEL AND SUBJECT DETAILS
Animals
Commercial colonies of common eastern bumblebees (Bombus impatiens, n=7) were purchased from Koppert Biological Systems (Howell, MI, USA) between June-September 2019. Upon arrival, colonies were visually inspected for the presence of a queen. If no queen was found, or if multiple foundresses were present, colonies were excluded from the study. Colonies were maintained in their original packaging under red light in a room with ambient temperature of 23°C.
Callow collection
New callows (n=414) were collected from colonies every morning between 8:30–10:30am. Colonies were chilled at 4°C for 30–45 minutes, at which point the bees were inactive enough to ensure safe removal of callows. Callows were positively identified by their silver-white pigmentation and slow, sluggish gait28 (Figure 1A).
Rearing conditions
Callows were divided into one of 3 rearing conditions, marked accordingly on the dorsal cuticle of the thorax with a paint pen (Sanford Uni-paint, SAN63721), then introduced into their new growth chambers or back into their natal colonies. Total duration of rearing for all bees lasted 9 consecutive days. Isolated bees (Iso) were housed in custom-designed plastic Tritan chambers (7.9 × 5.6 × 3.4 inches) lined with commercial beeswax (UBF10, Betterbee, Greenwich, NY, USA). Each chamber was supplied with HEPA- and carbon-filtered air to eliminate chemical cues and was sound-dampened with anti-vibration padding to remove auditory cues. Each chamber had a feeder (byFormica, B07D5M6F4B) with 40% honey water mixture, which was replaced every other day. Group-reared bees (Grp) were housed in identically-designed chambers with 3 other age-matched nestmates. Each chamber had 2 honey-water feeders, which were replaced every other day. Colony-reared bees (Col) were returned to their natal colonies after marking and left alone for the duration of the 9 day rearing period. Group- and colony-housed individuals were marked on their dorsal thoraces to enable later visual identification. On the 10th day, colony-reared bees were retrieved for subsequent analyses by chilling their natal colonies at 4°C for 30–45 min.
METHOD DETAILS
Behavioral assays
On the 10th day post-eclosion, between 09:00–16:30, experimental bees were removed from their respective rearing chambers and paired with an animal of either the same developmental background (Iso x Iso, n=24; Grp x Grp, n=30; Col x Col, n=28), a different developmental background (Iso x Grp, n=14; Iso x Col, n=29; Grp x Col, n=11; Grp A x Grp B, n=22), or by themselves (Iso, n=29; Grp, n=37; Col, n=31) in an open Petri dish arena (VWR, 25384–324) lined with commercial beeswax (UBF10, Betterbee, Greenwich, NY, USA). Bees were allowed to interact and move freely within the dish for 30 minutes. Recording started within one minute of introduction to the open arena. Video was captured from above with a Flir Blackfly camera (BFS-U3–32S4M-C) (100 fps, 2048 × 1536 × 1 frame size) on a custom-built Linux computer running LoopBio Motif software. Illumination was provided by 2 infrared panels on the left and right sides of the camera. Each bee was assayed only once. A subset of these bees were collected for subsequent experiments, including RNAsequencing and imaging (see below). A portion of the recordings were recorded at 60 fps. In subsequent analyses, we upsampled the body-part tracks to a rate of 100Hz via interpolation. Since our wavelet analysis (described below) uses a maximum frequency of 10Hz, this interpolation should have no meaningful effect.
Body part tracking
SLEAP was used to estimate the pose of the bees and track movement throughout the entire behavioral trial36. Twenty-one body parts were labeled to form a skeleton for pose estimation: head, thorax, abdomen, distal tips of antennae (left antenna 1, right antenna 1), antennal pedicels (left antenna 2, right antenna 2), distal tips of the first wing pair (left wing, right wing), the femur-tibia joint of each leg, and the tarsus of each leg (Figure 1B). We labeled 966 frames from both solo and paired trials from a representative sample of 18 behavioral recordings for a total of 1604 instances. In paired trials, both bees were always visible, and were often overlapping or partially occluded. Occluded body parts were not labeled. To infer bee tracks across frames, top-down and centroid networks were trained within the sleap.ai framework (TD, ResNet50). Training and inferencing were conducted on a local workstation equipped with an Intel Core i7–5960X CPU, 128 GB DDR4 RAM, NVMe solid state drives and a single NVIDIA Quadro P2000 GPU, or on Princeton University’s High-Performance Computing cluster with nodes equipped with NVIDIA P100 GPUs. Tracks were proofread using a custom Kalman filter script, followed by visual inspection. Manual adjustments were made to correct any instances in which tracks were swapped between bees. See Video S1 for a tracking example.
Tissue collection for RNAseq
Bumblebees were flash frozen on dry ice and stored at −80°C until dissection. To collect the central brain, frozen bees were decapitated with dissecting scissors. With the entire head submerged in RNAlater Ice (Invitrogen, AM7030) over a bed of dry ice/ethanol, large sections of the dorsal and ventral head cuticle and mandibles were chipped away to expose neural tissues. The chipped heads were transferred to a 10x volume of RNAlater-ICE solution, submerged, and allowed to incubate at 4°C for 16 hours before subdissection of the central brain over wet ice. Fat bodies, compound eyes, and ocelli were removed from the head mass. Brains were placed into individual 1.5 ml Eppendorf tubes with a 2.8 mm bead (OPS Diagnostics, GBSS 089–5000- 11) and homogenized for 10 minutes at maximum speed on a Qiagen TissueLyserII.
RNA extraction and TM3’-seq
We extracted RNA from whole brain homogenates using the Dynabeads mRNA DIRECT kit (Invitrogen, 61011) according to manufacturer’s protocol with homemade low-salt buffer (LSB, 20mM Tris-HCl[pH 7.5], 150 mM NaCl, 1mM EDTA) and Lysis/Binding Buffer (LBB, 100mM Tris-HCl[pH 7.5], 500 mM LiCL, 10mM EDTA[pH 8], 1% LiDS, 5mM DTT). RNA quality and concentration were checked on a Tapestation in the Princeton Genomics Core before proceeding with library preparation. Samples with RNA integrity scores below 8.8 were excluded from study. We prepared TM3’-seq libraries according to published protocols45 using i5 and i7 primers and Tn5 generously provided by the Ayroles lab (LSI, Princeton University). Libraries of 43 bees were sequenced on an Illumina NovaSeq instrument (single-end, S1 100nt lane), generating ~450 million reads. Samples were demultiplexed by the Princeton Genomics Core and samples with low read counts (<1 million reads, n=3) were excluded from study. A total of 16 isolated, 15 group-reared, and 9 colony-reared bees were included for transcriptomic analyses.
Brain tissue preparation for confocal imaging
To measure neuropil volumes of bumblebees, we created a brain atlas based on confocal image stacks of the bee brain’s natural autofluorescence. Bees were anesthetized with CO2 and decerebrated. Mandibles were removed, then heads were placed in fresh 4% paraformaldehyde (PFA) at 4°C overnight, rocking. A top-down photograph of the bee head was taken, and head width was measured in Fiji. The brains were subdissected in cold PBS and fixed in PFA at 4°C overnight. The next day, brains were washed in fresh phosphate-buffered saline (PBS) 3 × 10 min, transferred to a glass scintillation vial, and post-fixed in 2% glutaraldehyde at 4°C for 48 hrs. After post-fixation, brains were washed 3 × 10 min in PBS, submerged in formamide bleach (76% PBS, 20% 30% H2O2, 1% 10% Triton-X100, 3% formamide) for 75 min at room temperature, and washed again 3 × 10 min in PBS. Brains were then dehydrated in ethanol: 1 × 10 min washes of 30%, 50%, 70%, 90%, and 95% EtOH, then 3 × 10 min washes of 100% EtOH. Samples were stored in 100% EtOH until clearing and imaging. Brains were cleared in methyl salicylate (Sigma Aldrich, M2047) for 30 min at room temperature, then mounted in fresh methyl salicylate on a glass slide for confocal imaging.
Confocal imaging and brain atlas construction
All imaging was performed in the Princeton Confocal Imaging Facility on a Nikon A1 laser confocal microscope and a PC machine running the Nikon Elements Software package. Samples were scanned in the 488 nm laser line. Images were optically sectioned at 2.542 μm until the entire brain was imaged in series at 10x magnification. Large image grab was used to image the entire field of view in 4 quadrants, then stitch quadrants together to create a single 1895 × 1895 image. The following regions of the reference worker brain was manually segmented based on visible boundaries visualized with autofluorescence using a Wacom drawing tablet and the segmentation/3D reconstruction software ITK-SNAP: the central complex (including protocerebral bridge and nodules), antennal lobes, mushroom body and mushroom body lobes, and optic lobes were manually segmented. This reference brain was used as the template for downstream brain registration.
QUANTIFICATION AND STATISTICAL ANALYSIS
Behavior/body posture embedding
To quantify the behavior of the bees, we used the MotionMapper technique35. We egocentrized body part traces generated by SLEAP to the thorax body coordinate and thorax-head axis of each bee. In order to have an instantaneous representation of postural dynamics, we performed a continuous wavelet transform on the body part position time series on 25 exponentially spaced frequencies between 0.5Hz and 10Hz, which we empirically determined to be the relevant range for these data. The resulting concatenated spectral densities thus contained information on the power in each of these 25 frequencies for the x and y coordinates of each body part for the length of every trial, so that the postural dynamics of each bee could be described by a 975 element vector for every frame of the video. The coordinates for the thorax and the y coordinate of the head were not used in the wavelet analysis since they were set to 0 when the coordinate system of each bee was egocentrized.
In order to define discrete behaviors, we created a low-dimensional representation of these vectors to highlight features of interest. We used t-distributed stochastic neighbor embedding (t-SNE) to embed the concatenated spectral density vectors into a two-dimensional space. t-SNE has the useful property that local similarities will be preserved, such that spectral density vectors that are similar to each other will map onto nearby points in this space, while more global similarities are less important. In order to ensure that we are sampling across all relevant dynamics - that is, that we include even rarely seen dynamics in the spatial embedding - we importance sample across our dataset by first generating a t-SNE embedding of all timepoints for each individual. We then segment this embedding using a watershed transform into 100 different regions, and select points evenly across those regions to contribute to the master t-SNE embedding containing sample points from every trial. Once the master embedding is generated from these samples, we re-embed the non-sample points into the resulting space using the Kullback-Leibler divergence as a distance function. We display the final 2-dimensional ‘space’ as the probability density of the embedding.
We segmented the embedded space of all trials by performing a watershed transform on a less smoothed (sigma=0.5) probability density, with values below a reasonable threshold of probability being ignored, resulting in 38 regions centered around peaks of similar spectral density vectors. We tested several different smoothings and thresholds and chose the one that created a reasonable separation of peaks without over splitting the data. We generated video samples corresponding to each region of various lengths reflecting the varying dwell times of the trajectory of an individual bee’s t-SNE coordinate in each of the regions. By visually inspecting these videos we found these 38 regions, with the exception of region 24, correspond to 5 major stereotyped behavior modalities: idle (no movement), antennal movement, grooming, locomotion, and a fast locomotion behavior mostly seen in solo trials of group-reared bees (Video S2). We divide locomotion and fast locomotion into distinct behaviors based on the spatial separation of fast locomotion in the t-SNE embedding (Figure S1A), the strong prevalence of fast locomotion in solo group trials and its rarity elsewhere (Figure S1B-D), and the observably higher average speed of movement in video clips drawn from the fast locomotion region (Video S2). Region 24 contained almost the entire t-SNE trajectory of bee #12, and appeared to be the result of idiopathic tracking errors. Bee #12 and region 24 are omitted from the rest of this analysis.
Transcriptomic Data Preprocessing
We followed the recommended pipeline for TM3’seq data processing45 (see also https://github.com/Lufpa/TM3Seq-Pipeline). Reads were trimmed with custom trimmers using Trimmomatic72. Reads were aligned to the reference Bombus impatiens genome73 (BIMP_2.2, GCF_000188095.3) using STAR74. Small reads and duplicated reads were filtered out with SAMtools74. Mapped reads were counted using featureCounts76. Aggregate data preprocessing results were visualized in MultiQC v1.8.
Differential gene expression analysis
Analysis of differential genes was performed using the DESeq2 package77 in RStudio version 1.2.5001 running R version 3.6.1. The standard DESeq2 workflow was applied to the unique (deduplicated) aligned raw reads, and an additive model was built with source colony and treatment as factors. For pairwise testing of differential expression, colony-reared bees were set as the control and the false discovery rate (FDR) was set at 0.05.
GOTerm Enrichment
Gene Ontology terms were assigned to genes using Trinotate78. Gene set enrichment analysis was performed using the topGO package in R79. Only Biological Process terms were considered, and a Fisher’s exact test was used to perform the enrichment test using the “elim ‘‘ algorithm in topGO. FDR was set at 0.05. We created semantic similarity scatterplots using the GO-Figure package80. Cutoff for similarity between GO terms was set at 0.5 (default).
Weighted gene correlation network analysis
Co-expression analysis of brain RNAsequencing data from all bees was implemented with the WGCNA package in R56. Consensus correlation matrices were constructed and converted to adjacency matrices that retained information about the sign of the correlation81. Adjacency matrices were raised to a soft power threshold of 10. This was empirically determined based on a measure of R2 scale-free topology model fit that maximized and plateaued over 0.8. The soft power thresholded adjacency matrices were converted into a topological overlap matrix (TOM) and a topological dissimilarity matrix (1-TOM). We then performed agglomerative hierarchical clustering using the average linking method on the TOM dissimilarity matrix. Gene modules were defined from the resulting clustering tree, and branches were cut using the hybrid dynamic tree cutting function: the module detection sensitivity (deepSplit) was set to 2 (default), minimum module size 30 (default), and the cut height for module merging set to 0.25 (modules whose eigengenes were correlated above 0.75 were merged). This yielded 16 consensus modules (Figure 3, Figure S3), each assigned a color label. For each gene module, a summary measure (module eigengene) was computed as the first principal component of the module expression profiles. Genes that could not be clustered into any module were assigned to module M0 and not used for any downstream analysis. Correlation matrices for module eigenes were then calculated separately for each data set (i.e. we considered RNAsequencing data from colony- and group- reared bees as the first data set, and isolated bees as the second data set) for comparison.
We also constructed set-specific modules in order to relate network relationships unique to each data set to the global relationships in the consensus modules. Network construction and module detection was performed as described above. We related set-specific modules to consensus modules by calculating the overlap of each pair of modules and using Fisher’s exact test to assign a p-value to each of the pairwise overlaps (Figure S3).
To calculate intramodule connectivity, we used the Correlation by Individual Level Product (CILP) pipeline82 to calculate the Spearman correlation of every possible pairwise gene combination within each module. Then, for each module, we performed paired t-tests with Bonferroni correction to determine if changes between the correlations within the C+G set and within the I set were statistically significant (Table S1).
Confocal imaging and brain atlas construction
All imaging was performed in the Princeton Confocal Imaging Facility on a Nikon A1 laser confocal microscope and a PC machine running the Nikon Elements Software package. Samples were scanned in the 488 nm laser line. Images were optically sectioned at 2.542 μm until the entire brain was imaged in series at 10x magnification. Large image grab was used to image the entire field of view in 4 quadrants, then stitch quadrants together to create a single 1895 × 1895 image. The following regions of the reference worker brain was manually segmented based on visible boundaries visualized with autofluorescence using a Wacom drawing tablet and the segmentation/3D reconstruction software ITK-SNAP83: the central complex (including protocerebral bridge and nodules), antennal lobes, mushroom body and mushroom body lobes, and optic lobes were manually segmented. This reference brain was used as the template for downstream brain registration.
Measuring brain volumes
The elastix package84 was used to register confocal images of experimental brains to the template brain. The Jacobian determinants were calculated using transformix, and after transformation, voxels corresponding to each neuropil region were summed. Voxel data was plotted in RStudio using the ggplot2 package. The Fligner-Killeen test of homogeneity of variances was used across samples (p-value<0.05).
Supplementary Material
Data S1. Table of Differentially Expressed Genes, Related to Figure 3.
A. Genes differentially expressed between isolated and colony-reared bees. B. Genes differentially expressed between isolated and group-reared bees. C. Top 50 genes between group- and colony-reared bees.
Data S2. Table of GO Term Enrichment lists, Related to Figure 3.
A. GO enrichment for genes differentially expressed between isolated and colony-reared bees that are enriched in isolated bees. B. GO enrichment for genes differentially expressed between isolated and colony-reared bees that are enriched in colony-reared bees. C. GO enrichment for genes differentially expressed between isolated and group-reared bees that are enriched in group-reared bees. D. GO enrichment for genes differentially expressed between isolated and group-reared bees that are enriched in isolated bees.
Data S3. Table of WGCNA Module Membership, Related to Figure 3.
A. Loci assigned to black module. B. Loci assigned to purple module. C. Loci assigned to blue module. D. Loci assigned to brown module. E. Loci assigned to cyan module. F. Loci assigned to green module. G. Loci assigned to greenyellow module. H. Loci assigned to lightcyan module. I. Loci assigned to magenta module. J. Loci assigned to midnight blue module. K. Loci assigned to pink module. L. Loci assigned to yellow module. M. Loci assigned to tan module. N. Loci assigned to turquoise module. O. Loci assigned to red module. P. Loci assigned to salmon module.
Video S1. SLEAP-tracked pair of bees, Related to Figure 1 and STAR Methods.
Video S2. Discrete behavior map examples, Related to Figure 1 and STAR Methods.
Video S3. Worker Bee Brain Reference Template, Related to Figure 4.
Highlights.
Isolation increases social contact but decreases specificity of interactions in bees
Isolated bees show signatures of a dysregulated brain transcriptome
Brain developmental trajectories are destabilized and stochastic in isolated bees
Limited social contact is enough to preserve typical social behavior and neurobiology
Acknowledgements
We are thankful to Andrew Webb and Nathaniel Tabris for analytical assistance; Thomas Pisano, Sam Wang, and Gary Laevsky for imaging assistance; Elena Filippova and the Ayroles Lab for reagents; the McBride lab for use of equipment; John Stowers (Loopbio) for technical assistance; and Ian Traniello, Beryl Jones, Sama Ahmed, Dee Ruttenberg, and James Crall for improving the manuscript. J.W.S. acknowledges funding from NIH R01 NS10489. This work was supported by NIH U19 NS104648, NIH 1DP2GM137424–01, the Princeton Catalysis Initiative, and the Lewis-Sigler Institute for Integrative Genomics. This work was also supported in part by the National Science Foundation, through the Center for the Physics of Biological Function (PHY-1734030).
Footnotes
Publisher's Disclaimer: This is a PDF file of an unedited manuscript that has been accepted for publication. As a service to our customers we are providing this early version of the manuscript. The manuscript will undergo copyediting, typesetting, and review of the resulting proof before it is published in its final form. Please note that during the production process errors may be discovered which could affect the content, and all legal disclaimers that apply to the journal pertain.
Declaration of Interests
The authors declare no competing interests.
References
- 1.Boulay R, Soroker V, Godzkinska EJ, Hefetz A, and Lenoir A (2000). Octopamine reverses social deprivation effects. The Journal of Experimental Biology, 513–520. [DOI] [PubMed] [Google Scholar]
- 2.Boulay R, and Lenoir A (2001). Social isolation of mature workers affects nestmate recognition in the ant Camponotus fellah. Behavioural Processes 55, 67–73. [DOI] [PubMed] [Google Scholar]
- 3.Koto A, Mersch D, Hollis B, and Keller L (2015). Social isolation causes mortality by disrupting energy homeostasis in ants. Behav Ecol Sociobiol 69, 583–591. [Google Scholar]
- 4.Seid MA, and Junge E (2016). Social isolation and brain development in the ant Camponotus floridanus. Sci Nat 103, 42. [DOI] [PubMed] [Google Scholar]
- 5.Gross WB, and Colmano G (1969). The Effect of Social Isolation on Resistance to Some Infectious Diseases. Poult Sci 48, 514–520. [DOI] [PubMed] [Google Scholar]
- 6.Li W, Wang Z, Syed S, Lyu C, Lincoln S, O’Neil J, Nguyen AD, Feng I, and Young MW (2021). Chronic social isolation signals starvation and reduces sleep in Drosophila. Nature 597, 239–244. [DOI] [PMC free article] [PubMed] [Google Scholar]
- 7.Taborsky B, and Oliveira R (2012). Social competence: an evolutionary approach. Trends in Ecology & Evolution 27, 679–388. [DOI] [PubMed] [Google Scholar]
- 8.Taborsky B, Arnold C, Junker J, and Tschopp A (2012). The early social environment affects social competence in a cooperative breeder. Animal Behaviour 83, 1067–1074. [DOI] [PMC free article] [PubMed] [Google Scholar]
- 9.Hofmann HA, Beery AK, Blumstein DT, Couzin ID, Earley RL, Hayes LD, Hurd PL, Lacey EA, Phelps SM, Solomon NG, et al. (2014). An evolutionary framework for studying mechanisms of social behavior. Trends in Ecology & Evolution 29, 581–589. [DOI] [PubMed] [Google Scholar]
- 10.Bailey NW, and Moore AJ (2018). Evolutionary Consequences of Social Isolation. Trends in Ecology & Evolution 33, 595–607. [DOI] [PubMed] [Google Scholar]
- 11.Matsumoto K, Pinna G, Puia G, Guidotti A, and Costa E (2005). Social isolation stress-induced aggression in mice: A model to study the pharmacology of neurosteroidogenesis. Stress 8, 85–93. [DOI] [PubMed] [Google Scholar]
- 12.Agís-Balboa RC, Pinna G, Pibiri F, Kadriu B, Costa E, and Guidotti A (2007). Down-regulation of neurosteroid biosynthesis in corticolimbic circuits mediates social isolation-induced behavior in mice. PNAS 104, 18736–18741. [DOI] [PMC free article] [PubMed] [Google Scholar]
- 13.Gómez‐Laplaza LM, and Morgan E (2000). Laboratory studies of the effects of short‐term isolation on aggressive behaviour in fish. Marine and Freshwater Behaviour and Physiology 33, 63–102. [Google Scholar]
- 14.Agrawal P, Kao D, Chung P, and Looger LL (2020). The neuropeptide Drosulfakinin regulates social isolation-induced aggression in Drosophila. Journal of Experimental Biology 129, 549–563. [DOI] [PMC free article] [PubMed] [Google Scholar]
- 15.Johnson O, Becnel J, and Nichols CD (2009). Serotonin 5-HT2 and 5-HT1A-like receptors differentially modulate aggressive behaviors in Drosophila melanogaster. Neuroscience 158, 1292–1300. [DOI] [PMC free article] [PubMed] [Google Scholar]
- 16.Zhou C, Rao Y, and Rao Y (2008). A subset of octopaminergic neurons are important for Drosophila aggression. Nat Neurosci 11, 1059–1067. [DOI] [PubMed] [Google Scholar]
- 17.Adamo SA, and Hoy RR (1995). Agonistic behaviour in male and female field crickets, Gryllus bimaculatus, and how behavioural context influences its expression. Animal Behaviour 49, 1491–1501. [Google Scholar]
- 18.Kuriwada T (2016). Social isolation increases male aggression toward females in the field cricket Gryllus bimaculatus. Population Ecology 58, 147–153. [Google Scholar]
- 19.Wilson Edward O. (1971). The Insect Societies (Belknap Press; ). [Google Scholar]
- 20.Hewlett SE, Wareham DM, and Barron AB (2018). Honey bee ( Apis mellifera ) sociability and nestmate affiliation are dependent on the social environment experienced post-eclosion. J Exp Biol 221, jeb173054. [DOI] [PubMed] [Google Scholar]
- 21.Maleszka J, Barron AB, Helliwell PG, and Maleszka R (2009). Effect of age, behaviour and social environment on honey bee brain plasticity. J Comp Physiol A 195, 733–740. [DOI] [PubMed] [Google Scholar]
- 22.Breed MD, Silverman JM, and Bell WJ (1978). Agonistic behavior, social interactions, and behavioral specialization in a primitively eusocial bee. Ins. Soc 25, 351–364. [Google Scholar]
- 23.Boulay R, Quagebeur M, Godzinska EJ, and Lenoir A (1999). Social isolation in ants: Evidence of its impact on survivorship and behavior in Camponotus fellah. Sociobiology 33, 111–124. [Google Scholar]
- 24.Manfredini F, Martinez‐Ruiz C, Wurm Y, Shoemaker DW, and Brown MJF (2021). Social isolation and group size are associated with divergent gene expression in the brain of ant queens. Genes, Brain and Behavior, e12758. [DOI] [PMC free article] [PubMed] [Google Scholar]
- 25.Jernigan CM, Zaba NC, and Sheehan MJ (2021). Age and social experience induced plasticity across brain regions of the paper wasp Polistes fuscatus. Biol. Lett 17, rsbl.2021.0073, 20210073. [DOI] [PMC free article] [PubMed] [Google Scholar]
- 26.Tibbetts EA, Desjardins E, Kou N, and Wellman L (2019). Social isolation prevents the development of individual face recognition in paper wasps. Animal Behaviour 152, 71–77. [Google Scholar]
- 27.Uy FM, Jernigan CM, Zaba NC, Mehrotra E, Miller SE, & Sheehan MJ (2021). Dynamic neurogenomic responses to social interactions and dominance outcomes in female paper wasps. PLoS genetics, 17(9), e1009474. [DOI] [PMC free article] [PubMed] [Google Scholar]
- 28.Goulson D (2010). Bumblebees: Behaviour, Ecology, and Conservation (OUP Oxford; ). [Google Scholar]
- 29.Jandt JM, and Dornhaus A (2009). Spatial organization and division of labour in the bumblebee Bombus impatiens. Animal Behaviour 77, 641–651. [Google Scholar]
- 30.Jandt JM, and Dornhaus A (2011). Competition and cooperation: bumblebee spatial organization and division of labor may affect worker reproduction late in life. Behav Ecol Sociobiol 65, 2341–2349. [Google Scholar]
- 31.Jandt JM, Huang E, and Dornhaus A (2009). Weak specialization of workers inside a bumble bee (Bombus impatiens) nest. Behav Ecol Sociobiol 63, 1829–1836. [Google Scholar]
- 32.Crall JD, Switzer CM, Oppenheimer RL, Ford Versypt AN, Dey B, Brown A, Eyster M, Guérin C, Pierce NE, Combes SA, et al. (2018). Neonicotinoid exposure disrupts bumblebee nest behavior, social networks, and thermoregulation. Science 362, 683–686. [DOI] [PubMed] [Google Scholar]
- 33.Jones BM, Leonard AS, Papaj DR, and Gronenberg W (2013). Plasticity of the Worker Bumblebee Brain in Relation to Age and Rearing Environment. BBE 82, 250–261. [DOI] [PMC free article] [PubMed] [Google Scholar]
- 34.Skorupski P, and Chittka L (2010). Photoreceptor Spectral Sensitivity in the Bumblebee, Bombus impatiens (Hymenoptera: Apidae). PLoS ONE 5, e12049. [DOI] [PMC free article] [PubMed] [Google Scholar]
- 35.Berman GJ, Choi DM, Bialek W, and Shaevitz JW (2014). Mapping the stereotyped behaviour of freely moving fruit flies. J. R. Soc. Interface 11, 20140672. [DOI] [PMC free article] [PubMed] [Google Scholar]
- 36.Pereira TD, Tabris N, Matsliah A, et al. (2022). SLEAP: A deep-learning system for multi-animal pose tracking. Nature Methods, 1–10. [DOI] [PMC free article] [PubMed] [Google Scholar]
- 37.Martín-Fernández J-A, Daunis-i-Estadella J, and Mateu-Figueras G (2015). On the interpretation of differences between groups for compositional data. Statistics and Operations Research Transactions 39, 231–252. [Google Scholar]
- 38.Verpeut JL, Bergeler S, Kislin M, Townes FW, Klibaite U, Dhanerawala ZM, Hoag A, Jung C, Lee J, Pisano TJ, et al. (2021). Cerebellar contributions to a brainwide network for flexible behavior. bioRxiv [DOI] [PMC free article] [PubMed] [Google Scholar]
- 39.Jiang L, Cheng Y, Gao S, Zhong Y, Ma C, Wang T, and Zhu Y (2020). Emergence of social cluster by collective pairwise encounters in Drosophila. eLife 9, e51921. [DOI] [PMC free article] [PubMed] [Google Scholar]
- 40.Klibaite U, Berman GJ, Cande J, Stern DL, and Shaevitz JW (2017). An unsupervised method for quantifying the behavior of paired animals. Phys. Biol 14, 015006. [DOI] [PMC free article] [PubMed] [Google Scholar]
- 41.Derstine NT, Villar G, Orlova M, Hefetz A, Millar J, and Amsalem E (2021). Dufour’s gland analysis reveals caste and physiology specific signals in Bombus impatiens. Sci Rep 11, 2821. [DOI] [PMC free article] [PubMed] [Google Scholar]
- 42.Ayasse M, and Jarau S (2014). Chemical Ecology of Bumble Bees. Annual Review of Entomology 59, 299–319. [DOI] [PubMed] [Google Scholar]
- 43.Wang Q, Goodger JQD, Woodrow IE, and Elgar MA (2016). Location-specific cuticular hydrocarbon signals in a social insect. Proceedings of the Royal Society B: Biological Sciences 283, 20160310. [DOI] [PMC free article] [PubMed] [Google Scholar]
- 44.Wang Q, Goodger JQD, Woodrow IE, Chang L, and Elgar MA (2019). Task-Specific Recognition Signals Are Located on the Legs in a Social Insect. Frontiers in Ecology and Evolution 7, 227. [Google Scholar]
- 45.Pallares LF, Picard S, and Ayroles JF (2019). TM3’seq: A Tagmentation-Mediated 3’ Sequencing Approach for Improving Scalability of RNAseq Experiments G3, g3.400821.2019. [DOI] [PMC free article] [PubMed] [Google Scholar]
- 46.Chiang YN, Tan KJ, Chung H, Lavrynenko O, Shevchenko A, & Yew JY (2016). Steroid hormone signaling is essential for pheromone production and oenocyte survival. PLoS genetics, 12(6), e1006126. [DOI] [PMC free article] [PubMed] [Google Scholar]
- 47.Jaycox ER, Skowronek W, and Guynn G (1974). Behavioral Changes in Worker Honey Bees (Apis mellifera) Induced by Injections of a Juvenile Hormone Mimic1. Annals of the Entomological Society of America 67, 529–534. [Google Scholar]
- 48.Robinson GE (1987). Regulation of honey bee age polyethism by juvenile hormone. Behav Ecol Sociobiol 20, 329–338. [Google Scholar]
- 49.Pandey A, Motro U, and Bloch G (2020). Juvenile hormone interacts with multiple factors to modulate aggression and dominance in groups of orphan bumble bee (Bombus terrestris) workers. Hormones and Behavior 117, 104602. [DOI] [PubMed] [Google Scholar]
- 50.Jindra M, Bellés X, and Shinoda T (2015). Molecular basis of juvenile hormone signaling. Current Opinion in Insect Science 11, 39–46. [DOI] [PubMed] [Google Scholar]
- 51.Jindra M, Palli SR, and Riddiford LM (2013). The Juvenile Hormone Signaling Pathway in Insect Development. Annual Review of Entomology 58, 181–204. [DOI] [PubMed] [Google Scholar]
- 52.Shpigler H, Amsalem E, Huang ZY, Cohen M, Siegel AJ, Hefetz A, and Bloch G (2014). Gonadotropic and Physiological Functions of Juvenile Hormone in Bumblebee (Bombus terrestris) Workers. PLoS ONE 9, e100650. [DOI] [PMC free article] [PubMed] [Google Scholar]
- 53.He Q, Wen D, Jia Q, Cui C, Wang J, Palli SR, and Li S (2014). Heat Shock Protein 83 (Hsp83) Facilitates Methoprene-tolerant (Met) Nuclear Import to Modulate Juvenile Hormone Signaling. Journal of Biological Chemistry 289, 27874–27885. [DOI] [PMC free article] [PubMed] [Google Scholar]
- 54.Saul MC, Blatti C, Yang W, Bukhari SA, Shpigler HY, Troy JM, Seward CH, Sloofman L, Chandrasekaran S, Bell AM, et al. (2019). Cross-species systems analysis of evolutionary toolkits of neurogenomic response to social challenge. Genes, Brain and Behavior 18, e12502. [DOI] [PMC free article] [PubMed] [Google Scholar]
- 55.Jones BM, Rubin BER, Dudchenko O, Kapheim KM, Wyman ES, Hilaire BG St., Liu W, Parsons LR, Jackson SR, Goodwin K, et al. (2021). Convergent selection on juvenile hormone signaling is associated with the evolution of eusociality in bees. bioRxiv [Google Scholar]
- 56.Langfelder P, and Horvath S (2008). WGCNA: an R package for weighted correlation network analysis. BMC Bioinformatics 9, 559. [DOI] [PMC free article] [PubMed] [Google Scholar]
- 57.Lapiz MDS, Fulford A, Muchimapura S, Mason R, Parker T, & Marsden CA (2003). Influence of postweaning social isolation in the rat on brain development, conditioned behavior, and neurotransmission. Neuroscience and behavioral physiology, 33(1), 13–29. [DOI] [PubMed] [Google Scholar]
- 58.Shpigler H, Tamarkin M, Gruber Y, Poleg M, Siegel AJ, and Bloch G (2013). Social influences on body size and developmental time in the bumblebee Bombus terrestris. Behav Ecol Sociobiol 67, 1601–1612. [Google Scholar]
- 59.Sibbald ED, and Plowright CMS (2014). Social interactions and their connection to aggression and ovarian development in orphaned worker bumblebees (Bombus impatiens). Behavioural Processes 103, 150–155. [DOI] [PubMed] [Google Scholar]
- 60.Smith DB, Arce AN, Ramos Rodrigues A, Bischoff PH, Burris D, Ahmed F, and Gill RJ (2020). Insecticide exposure during brood or early-adult development reduces brain growth and impairs adult learning in bumblebees. Proceedings of the Royal Society B: Biological Sciences 287, 20192442. [DOI] [PMC free article] [PubMed] [Google Scholar]
- 61.Pahlke S, Seid MA, Jaumann S, and Smith A (2020). The Loss of Sociality Is Accompanied by Reduced Neural Investment in Mushroom Body Volume in the Sweat Bee Augochlora Pura (Hymenoptera: Halictidae). Annals of the Entomological Society of America, saaa019. [DOI] [PMC free article] [PubMed] [Google Scholar]
- 62.Waddington CH (1942). Canalization of Development and the Inheritance of Acquired Characters. Nature 150, 563–565. [DOI] [PubMed] [Google Scholar]
- 63.Siegal ML, and Bergman A (2002). Waddington’s canalization revisited: Developmental stability and evolution. Proceedings of the National Academy of Sciences 99, 10528–10532. [DOI] [PMC free article] [PubMed] [Google Scholar]
- 64.McGrath JJ, Hannan AJ, and Gibson G (2011). Decanalization, brain development and risk of schizophrenia. Translational Psychiatry 1, e14. [DOI] [PMC free article] [PubMed] [Google Scholar]
- 65.Arnold C, and Taborsky B (2010). Social experience in early ontogeny has lasting effects on social skills in cooperatively breeding cichlids. Animal Behaviour 79, 621–630. [Google Scholar]
- 66.Branchi I, D’Andrea I, Gracci F, Santucci D, and Alleva E (2009). Birth spacing in the mouse communal nest shapes adult emotional and social behavior. Physiol Behav 96, 532–539. [DOI] [PubMed] [Google Scholar]
- 67.Musi B, de Acetis L, and Alleva E (1993). Influence of litter gender composition on subsequent maternal behaviour and maternal aggression in female house mice. Ethology 95, 43–53. [Google Scholar]
- 68.Duchateau MJ (1989). Agonistic behaviours in colonies of the bumblebeeBombus terrestris. J. Ethol 7, 141–151. [Google Scholar]
- 69.Free JB (1955). The behaviour of egg-laying workers of bumblebee colonies. The British Journal of Animal Behaviour 3, 147–153. [Google Scholar]
- 70.Amsalem E, and Hefetz A (2010). The appeasement effect of sterility signaling in dominance contests among Bombus terrestris workers. Behavioral Ecology and Sociobiology 64, 1685–1694. [Google Scholar]
- 71.Blacher P, Yagound B, Lecoutey E, Devienne P, Chameron S, and Châline N (2013). Drifting behaviour as an alternative reproductive strategy for social insect workers. Proceedings of the Royal Society B: Biological Sciences 280, 20131888. [DOI] [PMC free article] [PubMed] [Google Scholar]
- 72.Bolger AM, Lohse M, and Usadel B (2014). Trimmomatic: a flexible trimmer for Illumina sequence data. Bioinformatics 30, 2114–2120. [DOI] [PMC free article] [PubMed] [Google Scholar]
- 73.Sadd BM, Barribeau SM, Bloch G, De Graaf DC, Dearden P, Elsik CG, ... & Worley KC (2015). The genomes of two key bumblebee species with primitive eusocial organization. Genome biology, 16(1), 1–32. [DOI] [PMC free article] [PubMed] [Google Scholar]
- 74.Dobin A, Davis CA, Schlesinger F, Drenkow J, Zaleski C, Jha S, Batut P, Chaisson M, and Gingeras TR (2013). STAR: ultrafast universal RNA-seq aligner. Bioinformatics 29, 15–21. [DOI] [PMC free article] [PubMed] [Google Scholar]
- 75.Li H, Handsaker B, Wysoker A, Fennell T, Ruan J, Homer N, Marth G, Abecasis G, Durbin R, and 1000 Genome Project Data Processing Subgroup (2009). The Sequence Alignment/Map format and SAMtools. Bioinformatics 25, 2078–2079. [DOI] [PMC free article] [PubMed] [Google Scholar]
- 76.Liao Y, Smyth GK, and Shi W (2014). featureCounts: an efficient general purpose program for assigning sequence reads to genomic features. Bioinformatics 30, 923–930. [DOI] [PubMed] [Google Scholar]
- 77.Love MI, Huber W, and Anders S (2014). Moderated estimation of fold change and dispersion for RNA-seq data with DESeq2. Genome Biology 15, 550. [DOI] [PMC free article] [PubMed] [Google Scholar]
- 78.Grabherr MG, Haas BJ, Yassour M, Levin JZ, Thompson DA, Amit I, Adiconis X, Fan L, Raychowdhury R, Zeng Q, et al. (2011). Full-length transcriptome assembly from RNA-Seq data without a reference genome. Nat Biotechnol 29, 644–652. [DOI] [PMC free article] [PubMed] [Google Scholar]
- 79.Alexa A, and Rahnenfuhrer J Gene set enrichment analysis with topGO 26. [Google Scholar]
- 80.Reijnders MJ, & Waterhouse RM (2020). Summary Visualisations of Gene Ontology Terms with GO-Figure!. bioRxiv [DOI] [PMC free article] [PubMed] [Google Scholar]
- 81.Langfelder P, and Horvath S (2007). Eigengene networks for studying the relationships between co-expression modules. BMC Systems Biology 1, 54. [DOI] [PMC free article] [PubMed] [Google Scholar]
- 82.Lea A, Subramaniam M, Ko A, Lehtimäki T, Raitoharju E, Kähönen M, Seppälä I, Mononen N, Raitakari OT, Ala-Korpela M, et al. (2019). Genetic and environmental perturbations lead to regulatory decoherence. eLife 8, e40538. [DOI] [PMC free article] [PubMed] [Google Scholar]
- 83.Yushkevich PA, Piven J, Hazlett HC, Smith RG, Ho S, Gee JC, & Gerig G (2006). User-guided 3D active contour segmentation of anatomical structures: significantly improved efficiency and reliability. Neuroimage 31(3), 1116–1128. [DOI] [PubMed] [Google Scholar]
- 84.Klein S, Staring M, Murphy K, Viergever MA, and Pluim J (2010). elastix: A Toolbox for Intensity-Based Medical Image Registration. IEEE Trans. Med. Imaging 29, 196–205. [DOI] [PubMed] [Google Scholar]
Associated Data
This section collects any data citations, data availability statements, or supplementary materials included in this article.
Supplementary Materials
Data S1. Table of Differentially Expressed Genes, Related to Figure 3.
A. Genes differentially expressed between isolated and colony-reared bees. B. Genes differentially expressed between isolated and group-reared bees. C. Top 50 genes between group- and colony-reared bees.
Data S2. Table of GO Term Enrichment lists, Related to Figure 3.
A. GO enrichment for genes differentially expressed between isolated and colony-reared bees that are enriched in isolated bees. B. GO enrichment for genes differentially expressed between isolated and colony-reared bees that are enriched in colony-reared bees. C. GO enrichment for genes differentially expressed between isolated and group-reared bees that are enriched in group-reared bees. D. GO enrichment for genes differentially expressed between isolated and group-reared bees that are enriched in isolated bees.
Data S3. Table of WGCNA Module Membership, Related to Figure 3.
A. Loci assigned to black module. B. Loci assigned to purple module. C. Loci assigned to blue module. D. Loci assigned to brown module. E. Loci assigned to cyan module. F. Loci assigned to green module. G. Loci assigned to greenyellow module. H. Loci assigned to lightcyan module. I. Loci assigned to magenta module. J. Loci assigned to midnight blue module. K. Loci assigned to pink module. L. Loci assigned to yellow module. M. Loci assigned to tan module. N. Loci assigned to turquoise module. O. Loci assigned to red module. P. Loci assigned to salmon module.
Video S1. SLEAP-tracked pair of bees, Related to Figure 1 and STAR Methods.
Video S2. Discrete behavior map examples, Related to Figure 1 and STAR Methods.
Video S3. Worker Bee Brain Reference Template, Related to Figure 4.
Data Availability Statement
All transcriptomic data is deposited in the NCBI SRA database under BioProject ID PRJNA787650 and are publicly available as of the date of publication. Accession numbers are listed in the key resources table.
Brain segmentation data and original code is available on github at https://github.com/kocherlab/BumblebeeIsolation. These data are publicly available as of the date of publication, and the DOI is listed in the key resources table.
Any additional information required to reanalyze the data reported in this paper is available from the lead contact upon request.
Key resources table
| REAGENT or RESOURCE | SOURCE | IDENTIFIER |
|---|---|---|
| Biological samples | ||
| Common eastern bumblebee, Bombus impatiens | Koppert Biological Systems, Howell, MI, USA | https://www.koppertus.com/ |
| Chemicals, peptides, and recombinant proteins | ||
| RNAlater Ice | Invitrogen | AM7030 |
| Methyl salicylate | Sigma Aldrich | M2047 |
| Critical commercial assays | ||
| Dynabeads mRNA DIRECT kit | Invitrogen | 61011 |
| Deposited data | ||
| Bombus impatiens genome | Sadd73 | NCBI, BIMP_2.2, GCF_000188095.3 |
| Bombus impatiens brain bulk transcriptomic sequencing | This study | NCBI SRA database PRJNA787650 |
| Bombus impatiens brain segmentation and atlas data | This study | https://github.com/kocherlab/BumblebeeIsolation |
| Code | This study | https://github.com/kocherlab/BumblebeeIsolation |
| Software and algorithms | ||
| SLEAP | Pereira36 | sleap.ai |
| Nikon Elements | Nikon | https://www.microscope.healthcare.nikon.com/products/software/nis-elements |
| ITK-SNAP | Yushkevich83 | itksnap.org |
| MotionMapper | Berman35 | https://github.com/gordonberman/MotionMapper |
| TM3’seq data processing | Pallares45 | https://github.com/Lufpa/TM3Seq-Pipeline |
| Trimmomatic | Bolger72 | http://www.usadellab.org/cms/?page=trimmomatic |
| STAR | Dobin74 | https://github.com/alexdobin/STAR |
| SAMtools | Li75 | http://www.htslib.org/ |
| DESeq2 | Love79 | https://bioconductor.org/packages/release/bioc/html/DESeq2.html |
| Trinotate | Grabherr78 | https://github.com/Trinotate/Trinotate.github.io/blob/master/index.asciidoc |
| topGO | Alexa79 | https://bioconductor.org/packages/release/bioc/html/topGO.html |
| GO-Figure | Reijnders80 | https://gitlab.com/evogenlab/GO-Figure |
| Weighted gene correlation network analysis | Langfelder81 | https://horvath.genetics.ucla.edu/html/CoexpressionNetwork/Rpackages/WGCNA/ |
| Correlation by Individual Level Product | Lea82 | https://github.com/AmandaJLea/differential_correlation |
| elastix | Klein84 | https://elastix.lumc.nl/ |
| Other | ||
| 2.8 mm grinding bead | OPS Diagnostics | GBSS 089–5000-11 |