Abstract
Epidemiological studies demonstrate an association between breast cancer (BC) and systemic dysregulation of glucose metabolism. However, how BC influences glucose homeostasis remains unknown. We show that BC-derived extracellular vesicles (EVs) suppress pancreatic insulin secretion to impair glucose homeostasis. EV-encapsulated miR-122 targets PKM in β-cells to suppress glycolysis and ATP-dependent insulin exocytosis. Mice receiving high-miR-122 EVs or bearing BC tumours exhibit suppressed insulin secretion, enhanced endogenous glucose production, impaired glucose tolerance, and fasting hyperglycaemia. These effects contribute to tumour growth and are abolished by inhibiting EV secretion or miR-122, restoring PKM in β-cells, or insulin supplementation. Compared to non-cancer controls, BC patients have higher levels of circulating EV-encapsulated miR-122 and fasting glucose concentrations but lower fasting insulin; miR-122 levels are positively associated with glucose and negatively associated with insulin. Therefore, EV-mediated impairment of whole-body glycaemic control may contribute to tumour progression and incidence of type 2 diabetes in some BC patients.
Keywords: Extracellular vesicles, Breast cancer, Insulin secretion, Cancer-host crosstalk, Glycaemic control, Diabetes, PKM
Introduction
Breast cancer (BC) is the most commonly diagnosed cancer and the second leading cause of cancer mortality in women worldwide1. Obesity and type-2 diabetes (T2D) are both associated with a higher BC incidence and worse cancer-related outcomes2–5. Meta-analyses show that women with diabetes (primarily T2D) have a 20–27% increased risk of BC6–8, with no identified bias for tumour subtypes4. Higher levels of fasting glucose and glycated haemoglobin are significantly associated with premenopausal BC9. Hyperglycaemia is associated with elevated mortality risk in BC patients with or without diabetes10. Insulin resistance (IR) has also been associated with BC incidence and poor survival11–14. However, the reported associations of circulating insulin with BC are inconsistent. While some studies suggest hyperinsulinemia is a risk factor for BC and may partake in BC’s association with obesity15–19, others find lack of an association13, 20, 21. In sharp contrast, studies of women who are premenopausal or of younger age (≤50 years) indicate inverse associations of fasting insulin/c-peptide levels with BC incidence22, 23.
On the other hand, if and how BC can influence whole-body glucose/insulin metabolism remain less understood. Population-based studies show that diabetes risk begins to increase two years after BC diagnosis, and by ten years post-diagnosis is ~20% higher in BC survivors compared to age-matched women without BC24–26. Among BRCA1/2 carriers, diagnosis of BC is associated with a 2-fold increase in the risk of diabetes, which is exacerbated by a high body mass index (BMI; >25.0 kg/m2)27. Patients with diabetes and a history of BC have more comorbidities than cancer-free individuals28. We hypothesize that BC cells may negatively affect glycaemic control through secreted factors such as extracellular vesicles (EVs).
EVs (including exosomes of endocytic origin and microvesicles shed from cell surface) mediate the crosstalk between cancer and normal cells through local and long-range transfer of functional cargo including RNA, DNA, proteins, and lipids29, 30. Cancer-cell-secreted EVs contribute to tumour growth, immunomodulation, and establishment of pre-metastatic niches30, 31. Many of these effects are mediated by EV-encapsulated miRNAs32–34. Circulating miRNAs and other EV cargo molecules have emerged as potential biomarkers for cancer35, 36. Here, we investigate the direct effect of tumour-derived EVs on the endocrine function of pancreas and its impact on whole-body metabolism.
Results
EV from BC impair insulin signalling and glucose homeostasis
Female NOD/SCID/IL2Rγ-null (NSG) mice were treated with EVs derived from MDA-MB-231 BC cells or MCF-10A noncancer cells through semi-weekly intravenous (i.v.) injections for 5 weeks. We previously report that miR-122–5p (miR-122) is highly secreted by BC cells and predicts tumour progression and metastasis in early-stage BC patients33, 36, 37. Therefore, here we also examined high-miR-122 EVs from engineered MCF-10A/miR-122 cells33. No significant differences in food intake or body weight were observed between different groups (Extended Data Fig. 1a,b). We first compared the transcriptomes of liver, a central organ in systemic energy metabolism. Mice receiving MDA-MB-231 or MCF-10A/miR-122 EVs exhibited altered gene expression related to insulin signalling and its downstream pathways including FOXO-mediated transcription and glycogen metabolism (Fig. 1a; Extended Data Fig. 1c,d). Liver from these two groups had lower levels of phosphorylated Insulin Receptor β, AKT, FOXO1, P70S6K, and eIF4G (Fig. 1b), lower levels of glycogen (Fig. 1c,d) and triglycerides (Extended Data Fig. 1e), higher expression of Igfbp1, Pck1, G6pc, and Ppargc1a (Fig. 1e), and enhanced glycaemic excursion in response to a pyruvate tolerance test (PTT) (Fig. 1f). These results together indicate suppression of insulin signalling and anabolic synthesis along with an induction of endogenous glucose production.
Figure 1: BC-derived EVs suppress insulin signalling in liver and enhance hepatic glucose production.
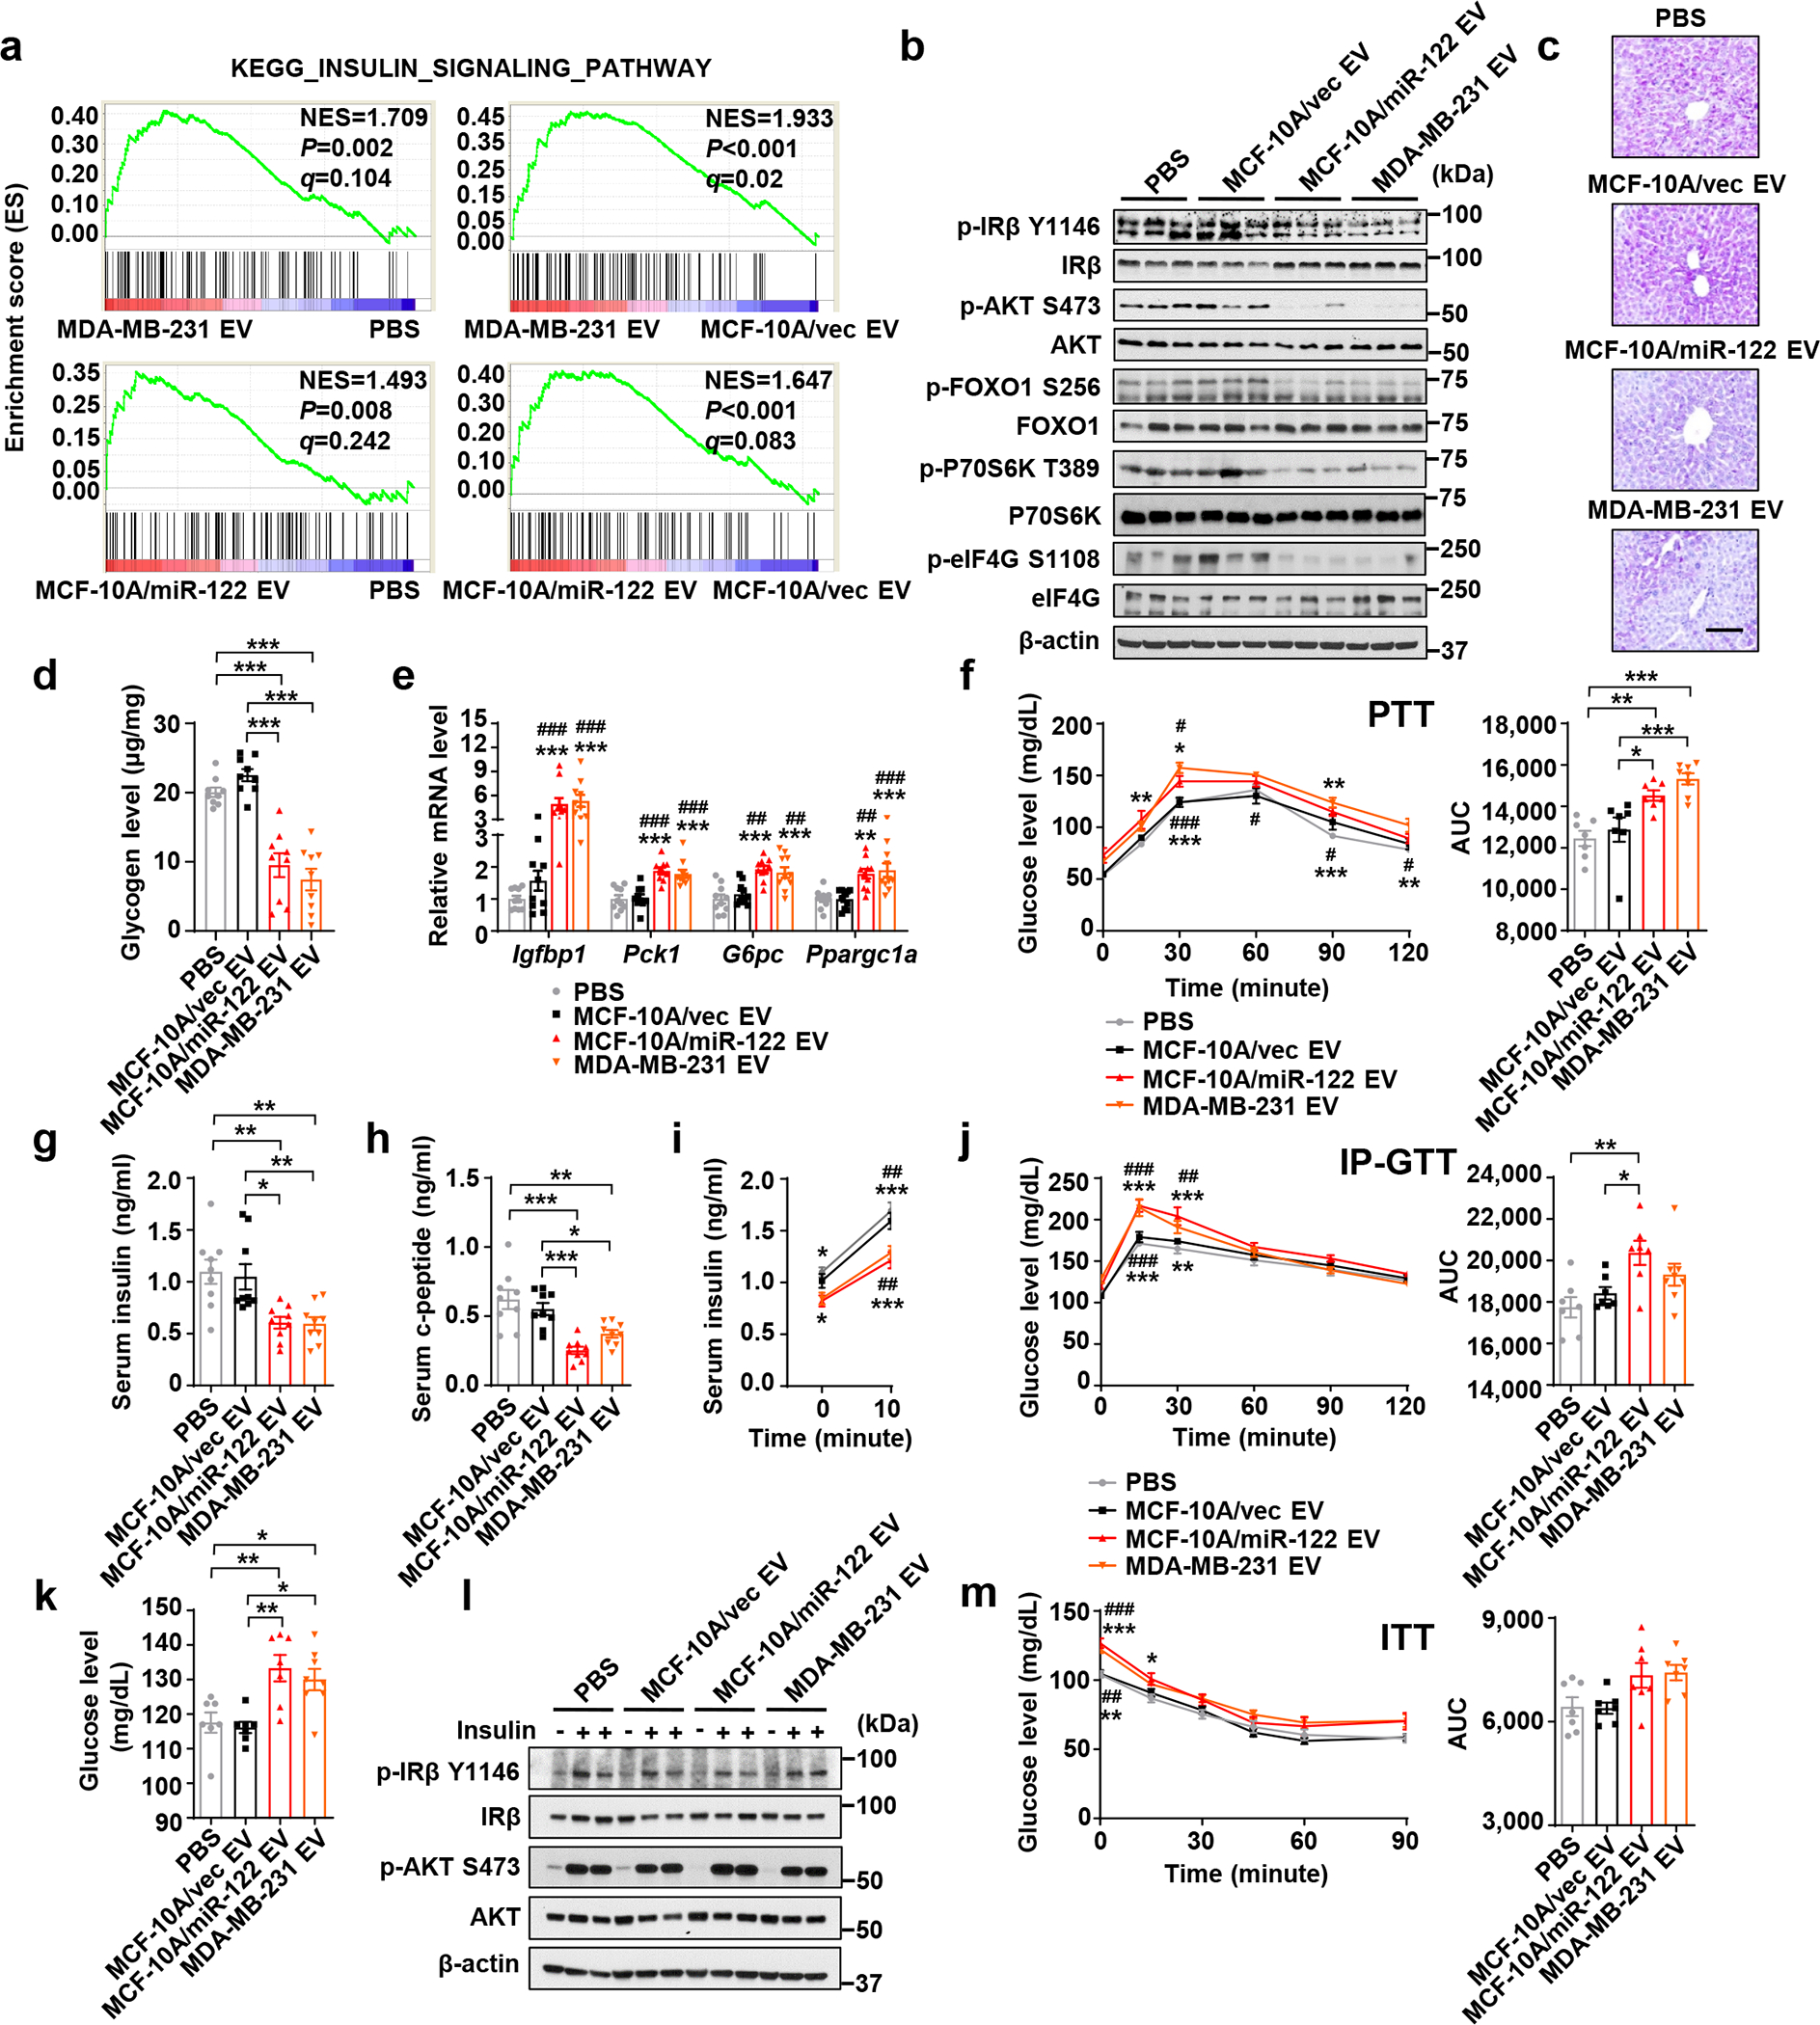
a, Liver tissues were collected from mice after 5 weeks of EV/PBS treatment and analysed by RNA-seq and GSEA (n=6 mice per group). b, Immunoblots using the liver lysates from these mice. c,d, Liver glycogen levels determined by PAS staining (c; Bar=100 μm; representative images are shown) and phenol-sulfuric acid method (d; n=9 mice per group). e, RT-qPCR showing relative mRNA levels (normalized to Cyclophilin B mRNA) in the liver (n=10 mice per group). f, PTT showing hepatic gluconeogenesis (left) and the corresponding area under curve (AUC) analysis (right) (n=8 mice for MDA-MB-231 EV group and n=7 mice for other groups). g,h, Fasting insulin (g) and c-peptide (h) levels in the sera (n=9 mice per group). i, Basal (fasting) and glucose-stimulated insulin levels (n=8 mice for MDA-MB-231 EV group and n=7 mice for other groups). j, Intraperitoneal glucose tolerance test (IP-GTT) (left) with the AUC analysis (right) (n=8 mice for MDA-MB-231 EV group and n=7 mice for other groups). k, Fasting blood glucose levels (n=8 mice for MDA-MB-231 EV group and n=7 mice for other groups). l, Immunoblots of indicated proteins in liver tissues collected 15 min after i.p. injection of 2 U/kg insulin or saline (control). m, Insulin tolerance test (ITT) showing no significant differences in hepatic insulin responsiveness among different groups (n=7 mice per group). In bar and line graphs, values are shown as mean ± SEM. One-way ANOVA followed by Tukey’s multiple comparison test was used for d,e,g,h,k and for the AUC panels of f,j,m. Two-way ANOVA followed by Tukey’s multiple comparison test was used for f,i,j,m. *P<0.05, **P<0.01, ***P<0.001 compared to PBS or as indicated; #P<0.05, ##P<0.01, ###P<0.001 compared to MCF-10A/vec EV. In f,i,j,m, signs above curves indicate MCF-10A/miR-122 EV vs. PBS or MCF-10A/vec EV, and those underneath the curves indicate MDA-MB-231 EV vs. PBS or MCF-10A/vec EV. Numerical source data, statistics and unprocessed blots are available online.
The suppressed insulin signalling in liver was likely due to decreased insulin secretion as indicated by lower blood levels of insulin and c-peptide (Fig. 1g,h), whereas the glucagon levels were unaffected (Extended Data Fig. 1f). This was accompanied by impaired glucose-stimulated insulin secretion (GSIS) (Fig. 1i) and impaired clearance of intraperitoneally (i.p.) injected glucose in a glucose tolerance test (GTT) (Fig. 1j), as well as an increase in fasting glucose levels (Fig. 1k). Injection of exogenous insulin prior to tissue collection abolished EV-induced changes in liver (Fig. 1l). We did not observe evidence for hepatic IR in an insulin tolerance test (ITT) (Fig. 1m). Levels of glucagon-like peptide 1 (GLP-1) and ghrelin also showed no changes (Extended Data Fig. 1g,h). Overall, results from the EV injection model suggest BC-derived EVs impair insulin secretion, which systemically impairs glucose homeostasis.
EV miR-122 targets PKM to suppress β-cell insulin secretion
Transcriptome profiling of EV-treated primary human pancreatic islets showed that MDA-MB-231 EVs, compared to MCF-10A EVs and PBS, affected genes related to suppression of glycolysis (Fig. 2a). This could potentially suppress glucose-triggered insulin secretion, which involves glycolysis-induced rise in ATP/ADP ratio, closure of ATP-sensitive K+ channels, membrane depolarization, Ca2+ influx and exocytosis of insulin granules38. miR-122 suppresses glycolysis in lung fibroblasts and astrocytes by targeting pyruvate kinase M (PKM)33. Here we also observed that high-miR-122 EVs from MCF-10A/miR-122 fully recapitulated the effects of BC-derived EVs on insulin and glucose homeostasis (Fig. 1). In human islets, EVs from MDA-MB-231 and MCF-10A/miR-122 both downregulated PKM2, the major pyruvate kinase isoform expressed in islets39, whereas PKM1 expressed at a much lower level showed similar regulation and the PKL isozyme was undetectable (Fig. 2b).
Figure 2: miR-122 in BC-derived EVs suppresses insulin secretion.
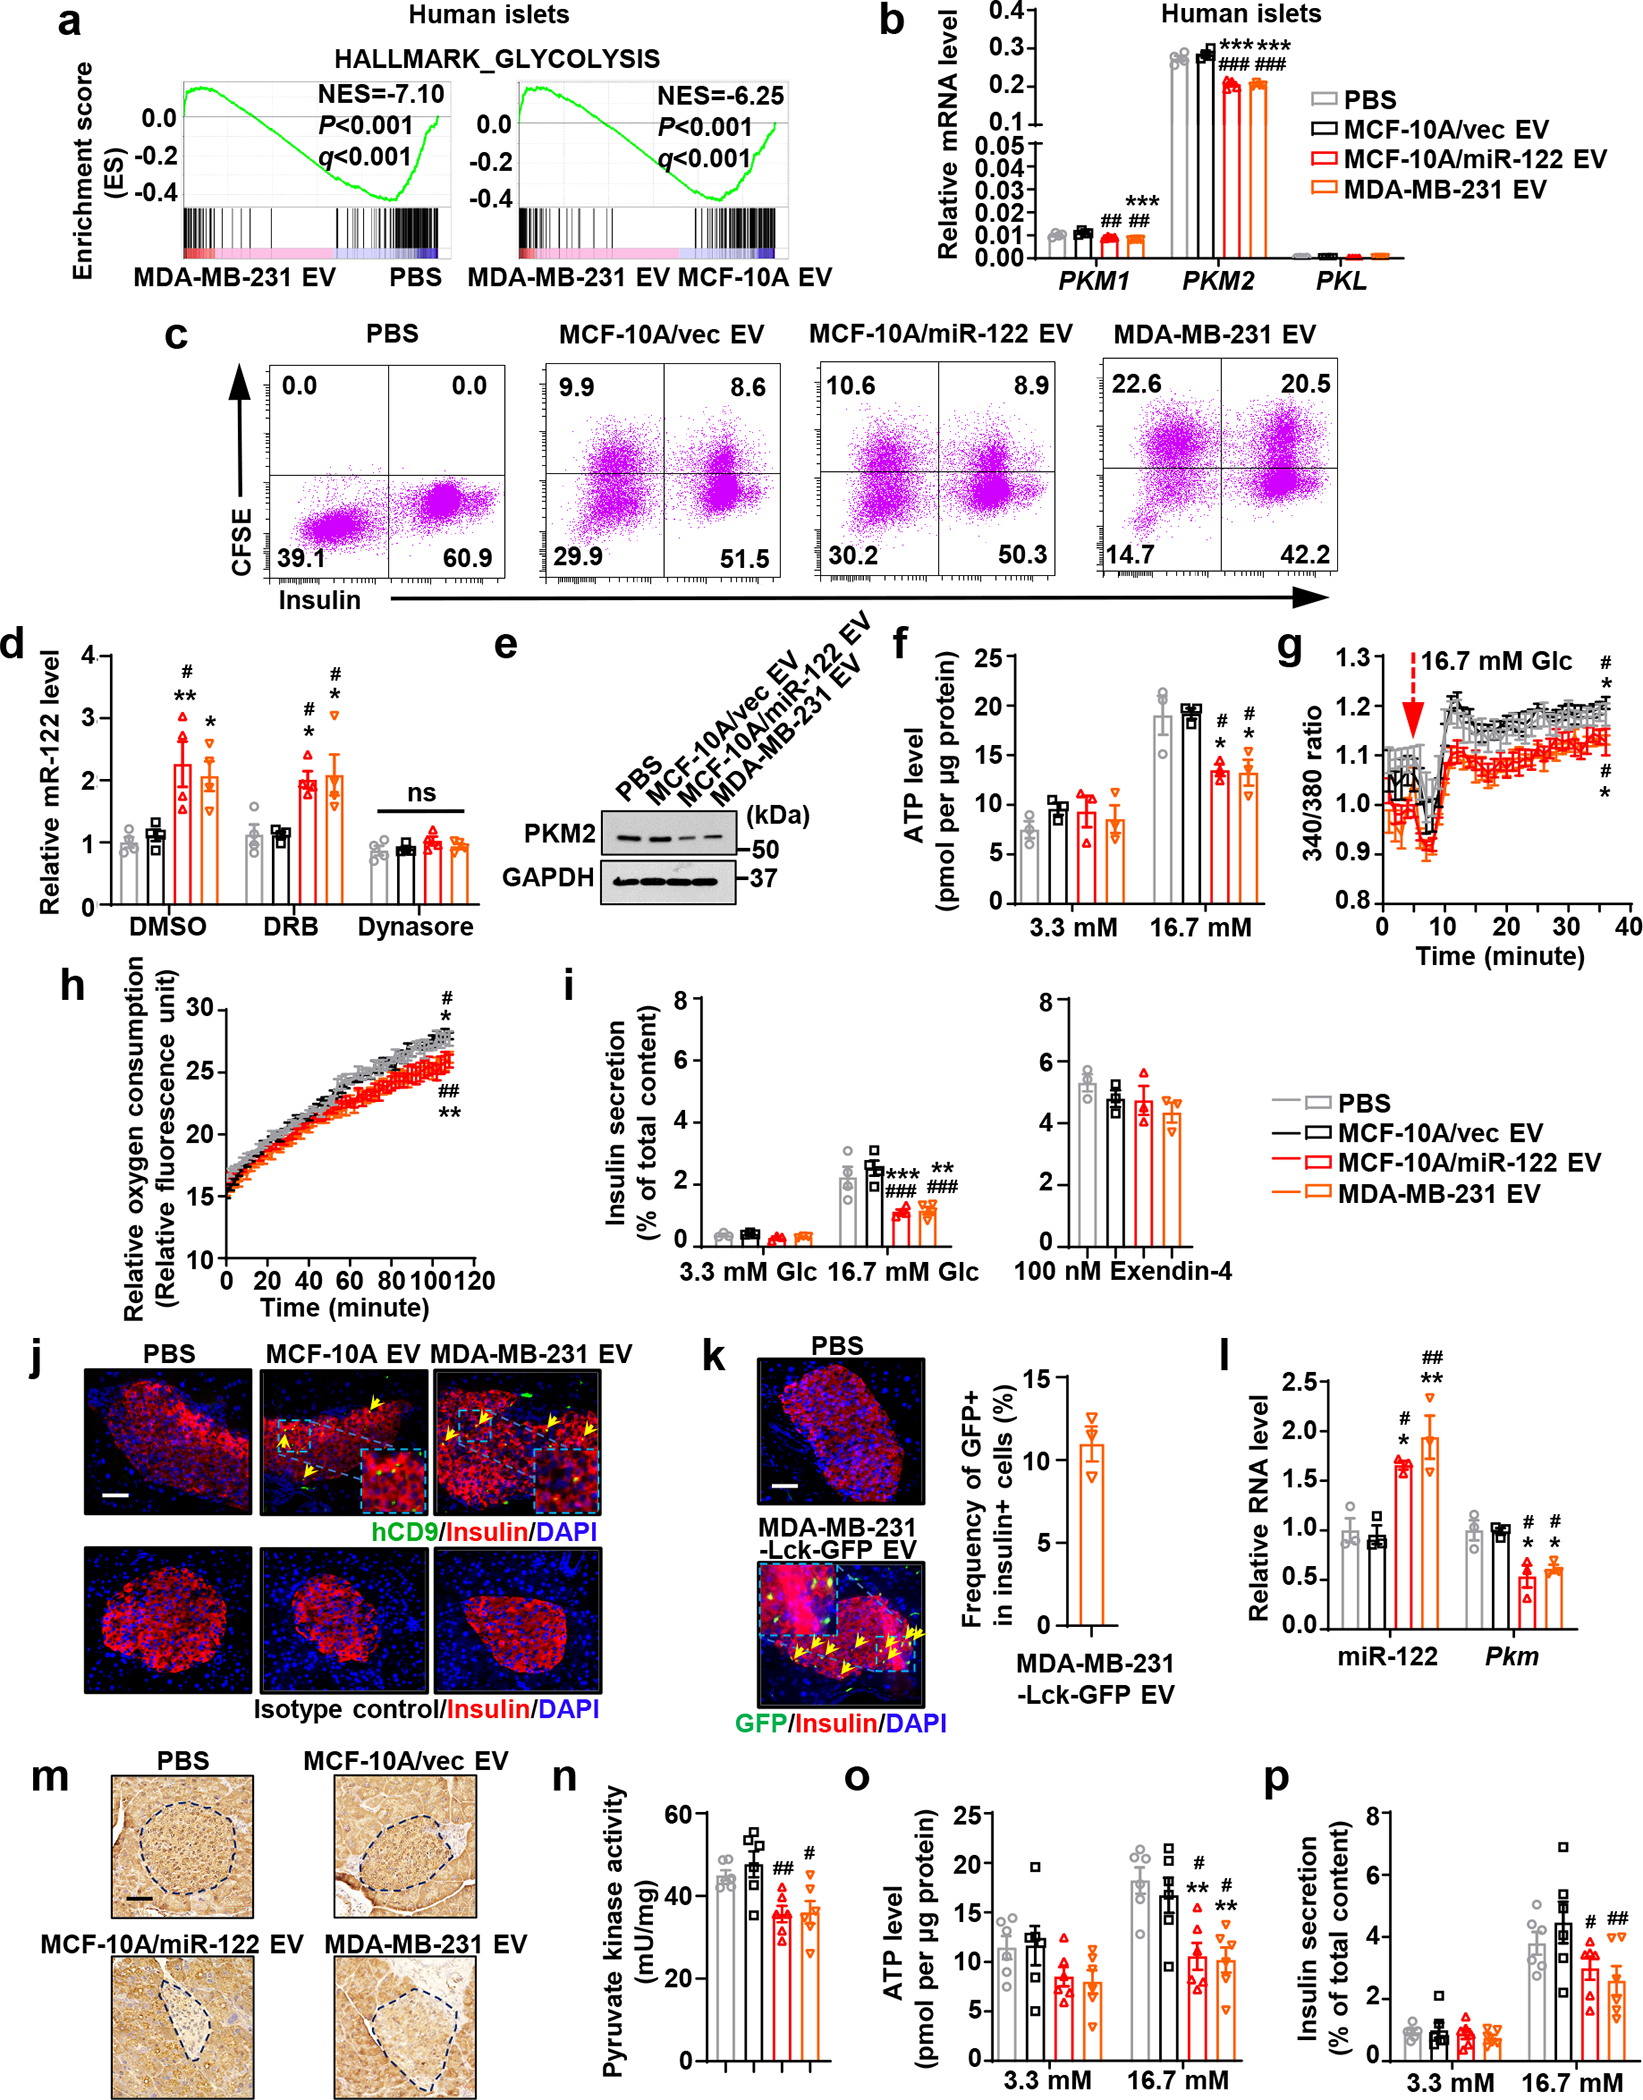
a, RNA-seq and GSEA of human islets treated as indicated (n=2 per treatment). b, Relative mRNA levels in human islets (n=4 replicates). c, Uptake of CFSE-labelled EVs by primary mouse islets assessed by flow cytometry with intracellular insulin staining of islet cells. d-i, Primary mouse islets were treated with EV/PBS for 48 hours prior to the following experiments: (d) relative miR-122 levels with indicated inhibitor treatment (n=4 replicates); (e) immunoblots; (f) normalized ATP levels (n=3 replicates); (g) intracellular Ca2+ levels (islet cells maintained at 3.3 mM glucose were switched to 16.7 mM glucose at minute 5; n=4 replicates); (h) relative oxygen consumption rates (under 16.7 mM glucose added at minute 0; n=4 replicates); (i) insulin secretion under 3.3 mM (n=3 replicates) or 16.7 mM glucose (n=4 replicates) (left) or 16.7 mM glucose + 100 nM Exendin-4 (n=3 replicates; right). j, Immunofluorescence indicating EV uptake (human-specific CD9) by β-cells (insulin+) in islets from mice in Figure 1. Bar=50 μm. k, Immunofluorescence indicating uptake of MDA-MB-231-Lck-GFP EVs by β-cells (insulin+) in mice after 3 times of EV/PBS injections. Bar=50 μm. Plot (right) shows the frequency of GFP+ among insulin+ cells (n=3 mice). l-p, Ex vivo assessments of islets isolated from mice that had received 6 semi-weekly EV/PBS injections: (l) relative RNA levels (n=3 mice per group); (m) immunohistochemistry (IHC) of PKM in pancreas sections. Representative images are shown. Bar=50 μm; (n) pyruvate kinase activity; (o) ATP levels; and (p) insulin secretion (n=6 mice per group for n-p). In bar and line graphs, values are shown as mean ± SEM. One-way ANOVA followed by Tukey’s multiple comparison test was used for b,d,l,n and the middle and right panels of i. Two-way ANOVA followed by Tukey’s multiple comparison test was used for g and h (repeated measures), f,o,p, and left panel of i. *P<0.05, **P<0.01, ***P<0.001 compared to PBS; #P<0.05, ##P<0.01, ###P<0.001 compared to MCF-10A/vec EV. ns: not significant. In g,h, signs above or underneath the curves denote the same comparisons as in Figure 1f. Numerical source data, statistics and unprocessed blots are available online.
miR-122 was co-enriched with EV marker proteins in density fractions known to contain exosomes and showed resistance to RNase treatment (Extended Data Fig. 2a–d). Higher levels of circulating EV miR-122 were detected in mice receiving MCF-10A/miR-122 EVs compared to those receiving MCF-10A/vec EVs (Extended Data Fig. 2e). MIN6 cells and primary mouse islet cells both showed efficient uptake of CFSE-labelled EVs (Extended Data Fig. 3a; Fig. 2c). EV uptake was detected in both insulin+ β-cells and insulin- cells in pancreatic islets, suggesting other cell types may also be affected. Upon treatment with high-miR-122 EVs, miR-122 levels in the islets were increased, which was dependent on EV uptake but not endogenous miRNA transcription (Fig. 2d). In both MIN6 and primary islets, high-miR-122 EVs reduced PKM expression (Extended Data Fig. 3b; Fig. 2e), which was accompanied by decreases in pyruvate kinase activity (Extended Data Fig. 3c), intracellular ATP levels (Extended Data Fig. 3d; Fig. 2f), cytosolic free Ca2+ concentration (Extended Data Fig. 3e; Fig. 2g), oxygen consumption rate (Fig. 2h), and insulin secretion under low- and high-glucose conditions (Extended Data Fig. 3f; Fig. 2i). In contrast, insulin secretion stimulated by a non-glycolytic substrate, monomethyl succinate (MMS), was not affected (Extended Data Fig. 3f). No significant effect of EVs was observed when islets were glucose-stimulated in the presence of Exendin-440, indicating the amplifying steps of insulin secretion are not affected (Fig. 2i). Exogenous expression of a PKM2 construct lacking 3’UTR abolished the effect of high-miR-122 EVs and restored insulin secretion (Extended Data Fig. 3b,d,e,f). Conversely, knockdown of PKM2 decreased intracellular ATP levels and suppressed insulin secretion (Extended Data Fig. 3g–i).
By detecting human-specific CD9, we confirmed circulating human-derived EVs can be taken up by pancreatic β-cells in vivo (Fig. 2j). Upon injection of EVs from MDA-MB-231 cells expressing a membrane-targeted Lck-GFP41, we detected GFP signals in >10% β-cells in pancreatic islets, indicating uptake of GFP-labelled EVs from circulation (Fig. 2k). Injection of high-miR-122 EVs led to higher miR-122 levels in islets (Fig. 2l), lower expression of PKM (Fig. 2l,m), and lower pyruvate kinase activity (Fig. 2n). These were accompanied by suppressed ATP levels and impaired insulin secretion upon high glucose stimulation in isolated islets (Fig. 2o,p). Collectively, our in vitro and in vivo results suggest BC-derived EV miR-122 is sufficient to suppress glycolysis and insulin granule exocytosis in β-cells.
Tumours require EV and miR-122 to suppress insulin secretion
For xenograft tumour models we generated MDA-MB-231 cells with stable knockdown of Rab27a, which showed significantly reduced EV secretion (Extended Data Fig. 4a,b). To determine the role of miR-122, we knocked out hsa-mir-122 gene (Extended Data Fig. 4c,d). The resulting MDA-MB-231/miR-122 KO cells showed unchanged PKM2 expression (Extended Data Fig. 4a), which may be explained by the low intracellular level of miR-122 in cancer cells33. Little effect on in vitro cell proliferation was observed with Rab27a KD or miR-122 KO cells (Extended Data Fig. 4e,f). Small RNA sequencing revealed that Rab27a KD altered the levels of some miRNAs in cells and EVs, which may be related to inhibited EV secretion, with miR-122 increasing intracellularly and decreasing in the EVs (Extended Data Fig. 4g,h). miR-122 KO also altered the intracellular or EV levels of some other miRNAs (Extended Data Fig. 4i,j), possibly due to factors secondary to loss of miR-122.
Mice bearing MDA-MB-231 mammary tumours, compared to tumour-free mice, showed higher circulating EV miR-122 (Fig. 3a) as well as higher miR-122 and lower PKM in pancreatic islets (Fig. 3b,c). These mice had lower fasting insulin and c-peptide levels in blood (Fig. 3d,e) and exhibited impaired GSIS (Fig. 3f) and poor glucose tolerance (Fig. 3g), whereas body weight and levels of glucagon and ghrelin were unchanged (Extended Data Fig. 5a–c). Repressed insulin signalling was seen in liver (Fig. 3h), accompanied by glycogen depletion (Fig. 3i), increased gene expression related to gluconeogenesis (Fig. 3j), and enhanced glucose production from pyruvate (Fig. 3k). The gonadal white adipose tissue (gWAT) content was also decreased, along with increased expression of lipolysis genes (Lipe, Atgl and Pnpla3) but not lipogenesis genes (Acc1 and Fasn) (Extended Data Fig. 5d,e). In gastrocnemius muscle, repressed insulin signalling was evidenced by lower levels of phosphorylated AKT and reduced uptake of a glucose analogue (Extended Data Fig. 5f,g). Consistent with these results, the tumour-bearing mice showed elevated fasting blood glucose (Fig. 3l). All these effects were abolished in mice bearing Rab27a KD or miR-122 KO tumours (Fig. 3a–l). Tumours with Rab27a KD or miR-122 KO also showed reduced growth (Fig. 3m) and reduced tumour cell proliferation (Fig. 3n; indicated by Ki67 staining) compared to control MDA-MB-231 tumours. As these gene modifications did not affect cell proliferation in vitro (Extended Data Fig. 4e,f), the results are consistent with our proposed mechanism through EV-mediated adaptations of the host environment. In mice bearing Rab27a KD tumours, i.v. injections with EVs from wild-type (WT) MDA-MB-231 cells rescued the insulin-regulating effect (Fig. 3o–q) and promoted tumour growth (Fig. 3r).
Figure 3: Tumours require EV secretion and miR-122 to alter insulin secretion and glucose homeostasis.
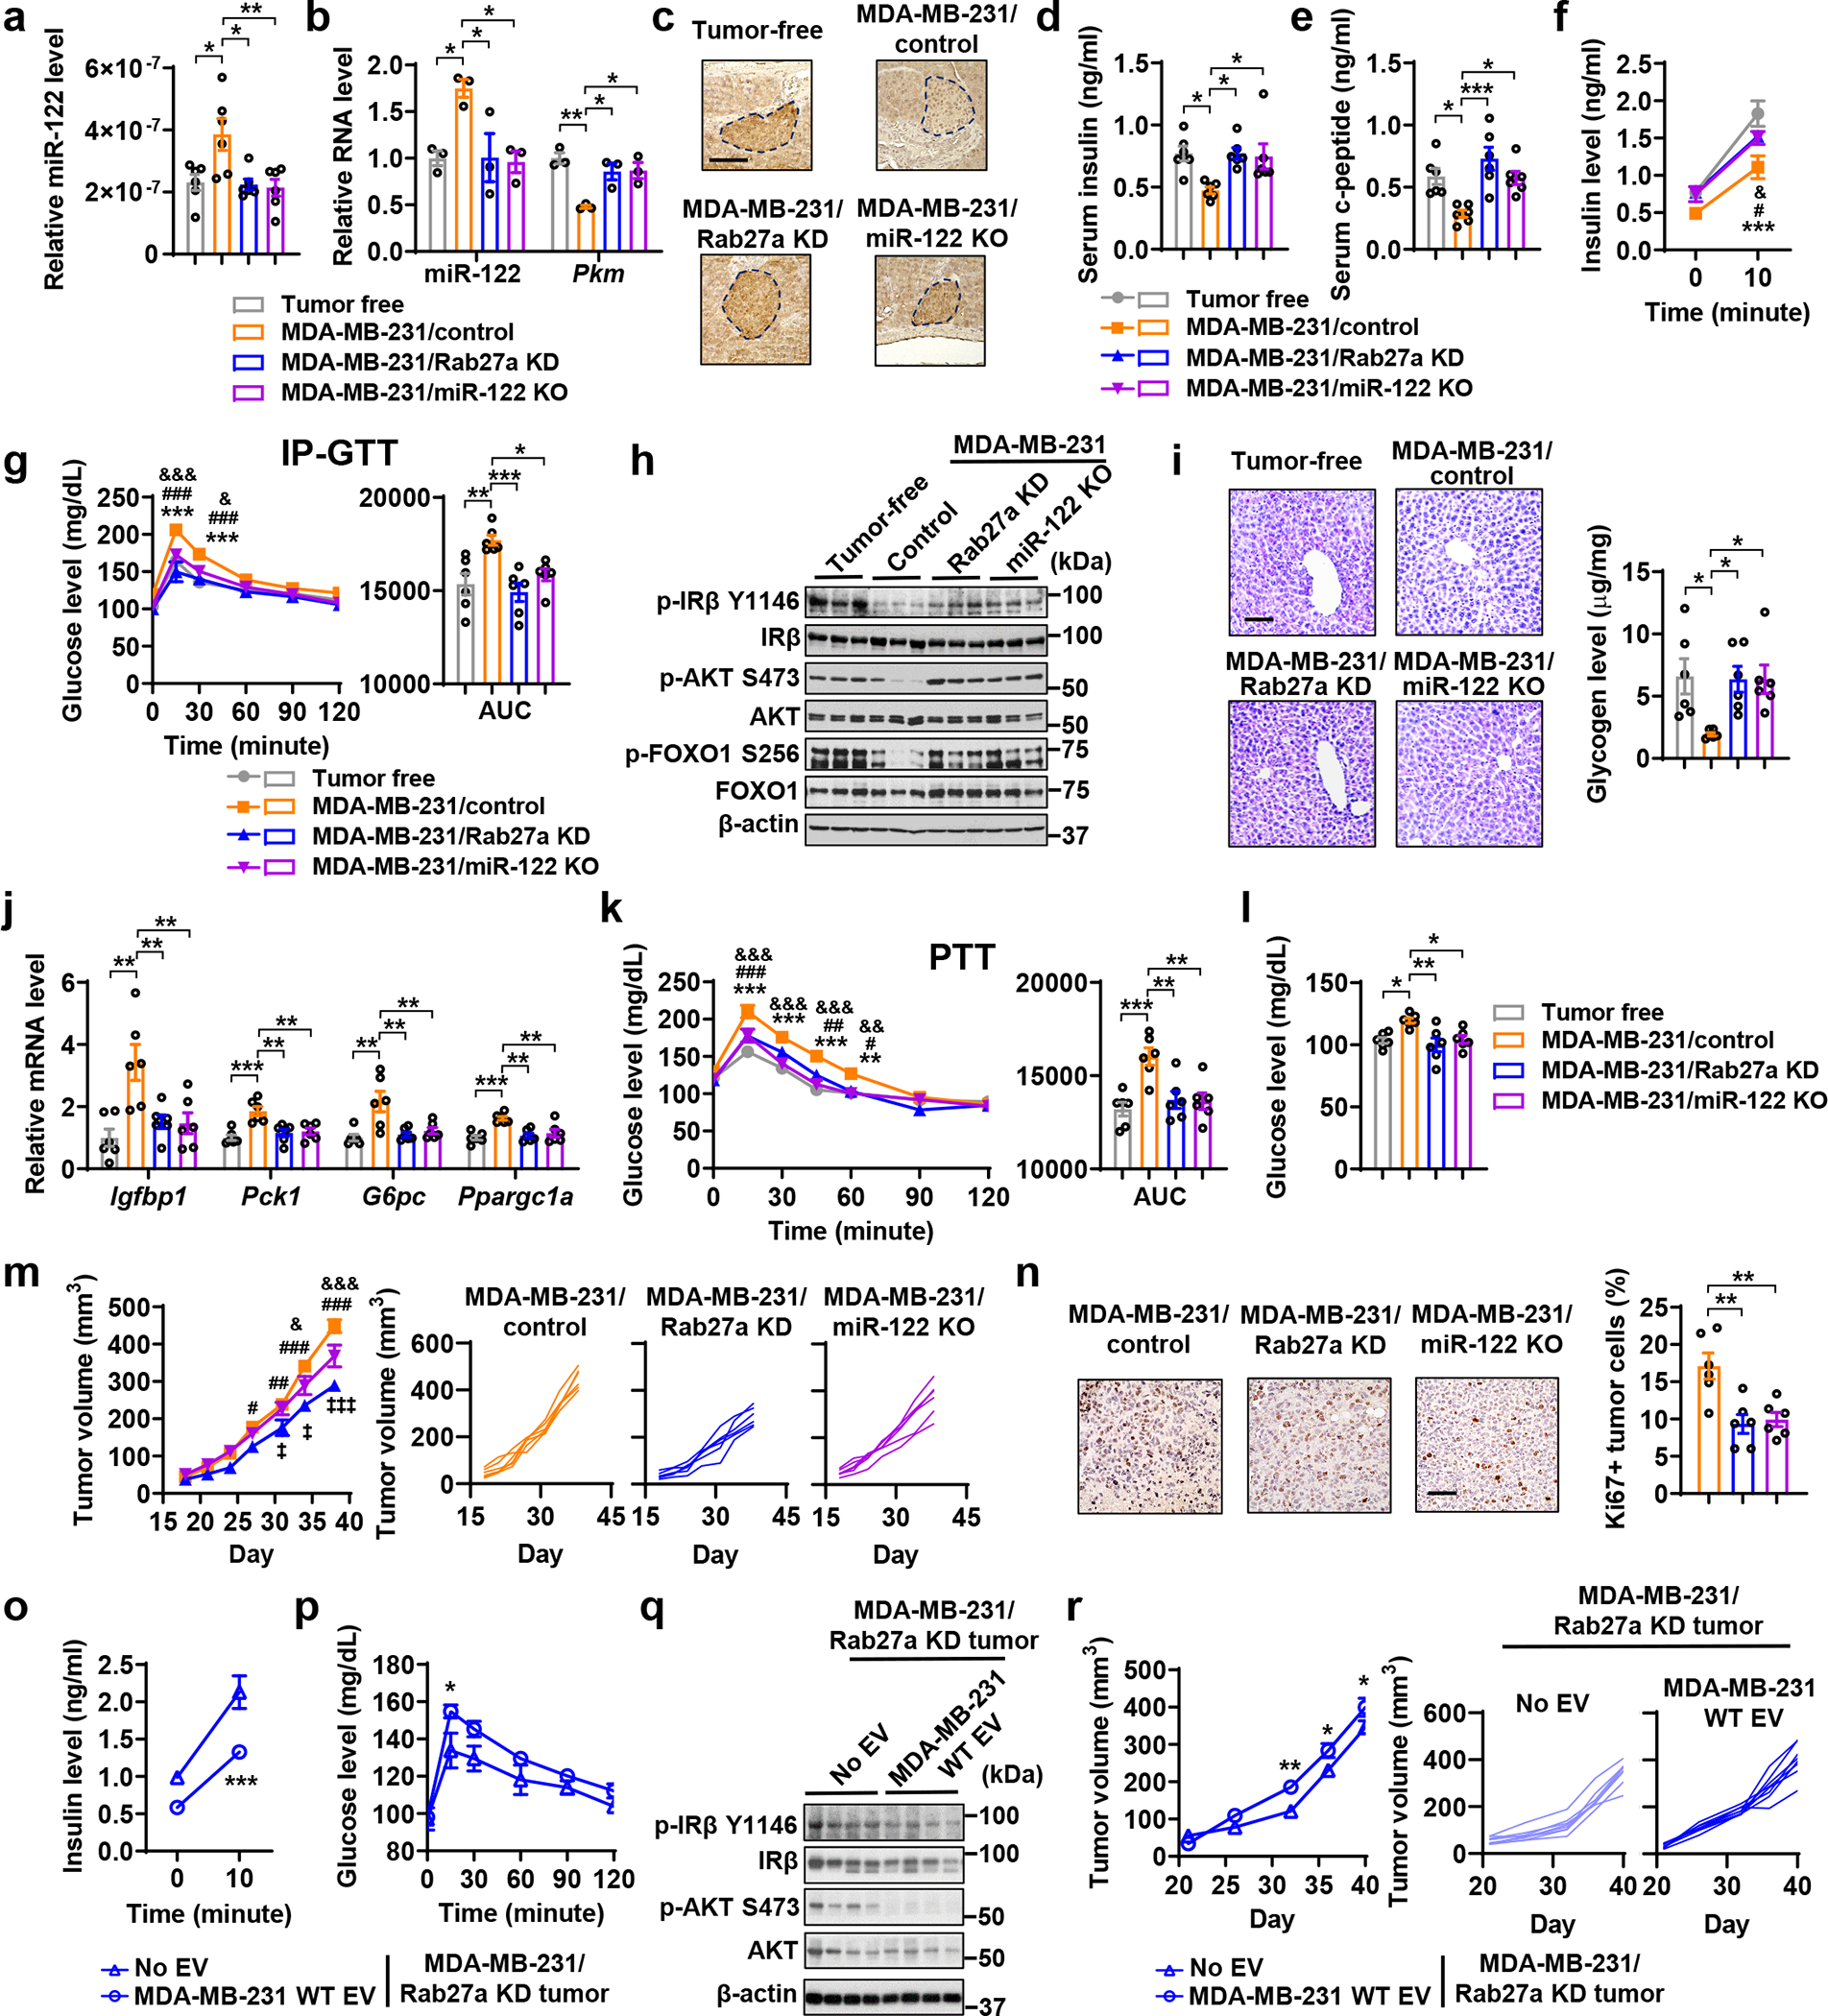
a-n, Indicated MDA-MB-231-derived cells were injected into mammary fat pad to form tumours. Tumour-bearing and age-matched tumour-free mice were sacrificed for tissues collection before tests of insulin and glucose metabolism performed on day 30–35. a, Relative miR-122 levels (normalized to spike-in control) in purified serum EVs. b, RNA levels of miR-122 and Pkm in islets isolated from indicated groups (n=3 mice per group). c, IHC of PKM in pancreas sections. Bar=100 μm. d,e, Fasting insulin and c-peptide levels. f, Basal (fasting) and glucose-stimulated insulin levels. g, IP-GTT with AUC analysis. h, Immunoblots showing protein levels in the liver. i, Liver glycogen levels determined by PAS staining (left) and phenol-sulfuric acid method (right). Bar=100 μm. j, Relative mRNA levels in the liver. k, PTT with AUC analysis. l, Fasting blood glucose levels. (n=6 mice per group for a,d-g,i-l). m, Tumour volume measurements (left; n=7 mice per group) and individual tumour growth (right). n, Representative IHC of Ki67 (left) and percentage of Ki67+ tumour cells (right; n=6 mice per group). Bar=100 μm. o-r, MDA-MB-231/Rab27a KD cells were injected to form mammary tumours. Starting from day 3, mice were semi-weekly injected with indicated EVs or PBS for 5 weeks. o, Basal and glucose-stimulated insulin levels (n=8 mice per group). p, IP-GTT (n=6 mice per group). q, Immunoblots showing indicated proteins in the liver. r, Tumour volume measurements (left; n=8 mice per group) and individual tumour growth (right). For bar and line graphs, values are shown as mean ± SEM. One-way ANOVA followed by Tukey’s multiple comparison test was used for a,b,d,e,i,j,l,n, and AUC in g and k. Two-way ANOVA was used for f,g,k,m with Tukey’s multiple comparison test, and for o,p,r with Bonferroni’s multiple comparison test. *P<0.05, **P<0.01, ***P<0.001 for MDA-MB-231/control vs. tumour-free or as indicated; #P<0.05, ##P<0.01, ###P<0.001 for MDA-MB-231/control vs. MDA-MB-231/Rab27a KD; &P<0.05, &&P<0.01, &&&P<0.001 for MDA-MB-231/control vs. MDA-MB-231/miR-122 KO. ‡P<0.05, ‡‡‡P<0.001 for MDA-MB-231/Rab27a KD vs. MDA-MB-231/miR-122 KO. Numerical source data, statistics and unprocessed blots are available online.
We next used a patient-derived xenograft (PDX) model42, 43 to generate EVs (Fig. 4a) for islet treatment and establish xenograft tumours in mice. We also generated isogenic lines with Rab27a KD, miR-122 KO, or miR-122 overexpression (OE) (Fig. 4b–d). Human islets treated with EVs from PDX tumour cells showed reduced PKM2 expression (Fig. 4e) and pyruvate kinase activity (Fig. 4f) along with suppressed high-glucose-stimulated insulin secretion (Fig. 4g). Mice bearing PDX tumours also showed suppression of PKM in pancreatic islets (Fig. 4h,i) and impaired insulin secretion and signalling (Fig. 4j–n). These in vitro and in vivo effects were abolished with EVs from miR-122 KO PDX cells and with Rab27a KD or miR-122 KO PDX tumours (Fig. 4e–n). Compared to WT PDX tumours, the Rab27a KD and miR-122 KO PDX tumours showed reduced growth (Fig. 4o). miR-122 OE did not further enhance the effects observed with the WT PDX model, possibly suggesting those effects have already reached a saturation point.
Figure 4: A patient-derived xenograft model also exhibits impairments of insulin secretion and glucose homeostasis.
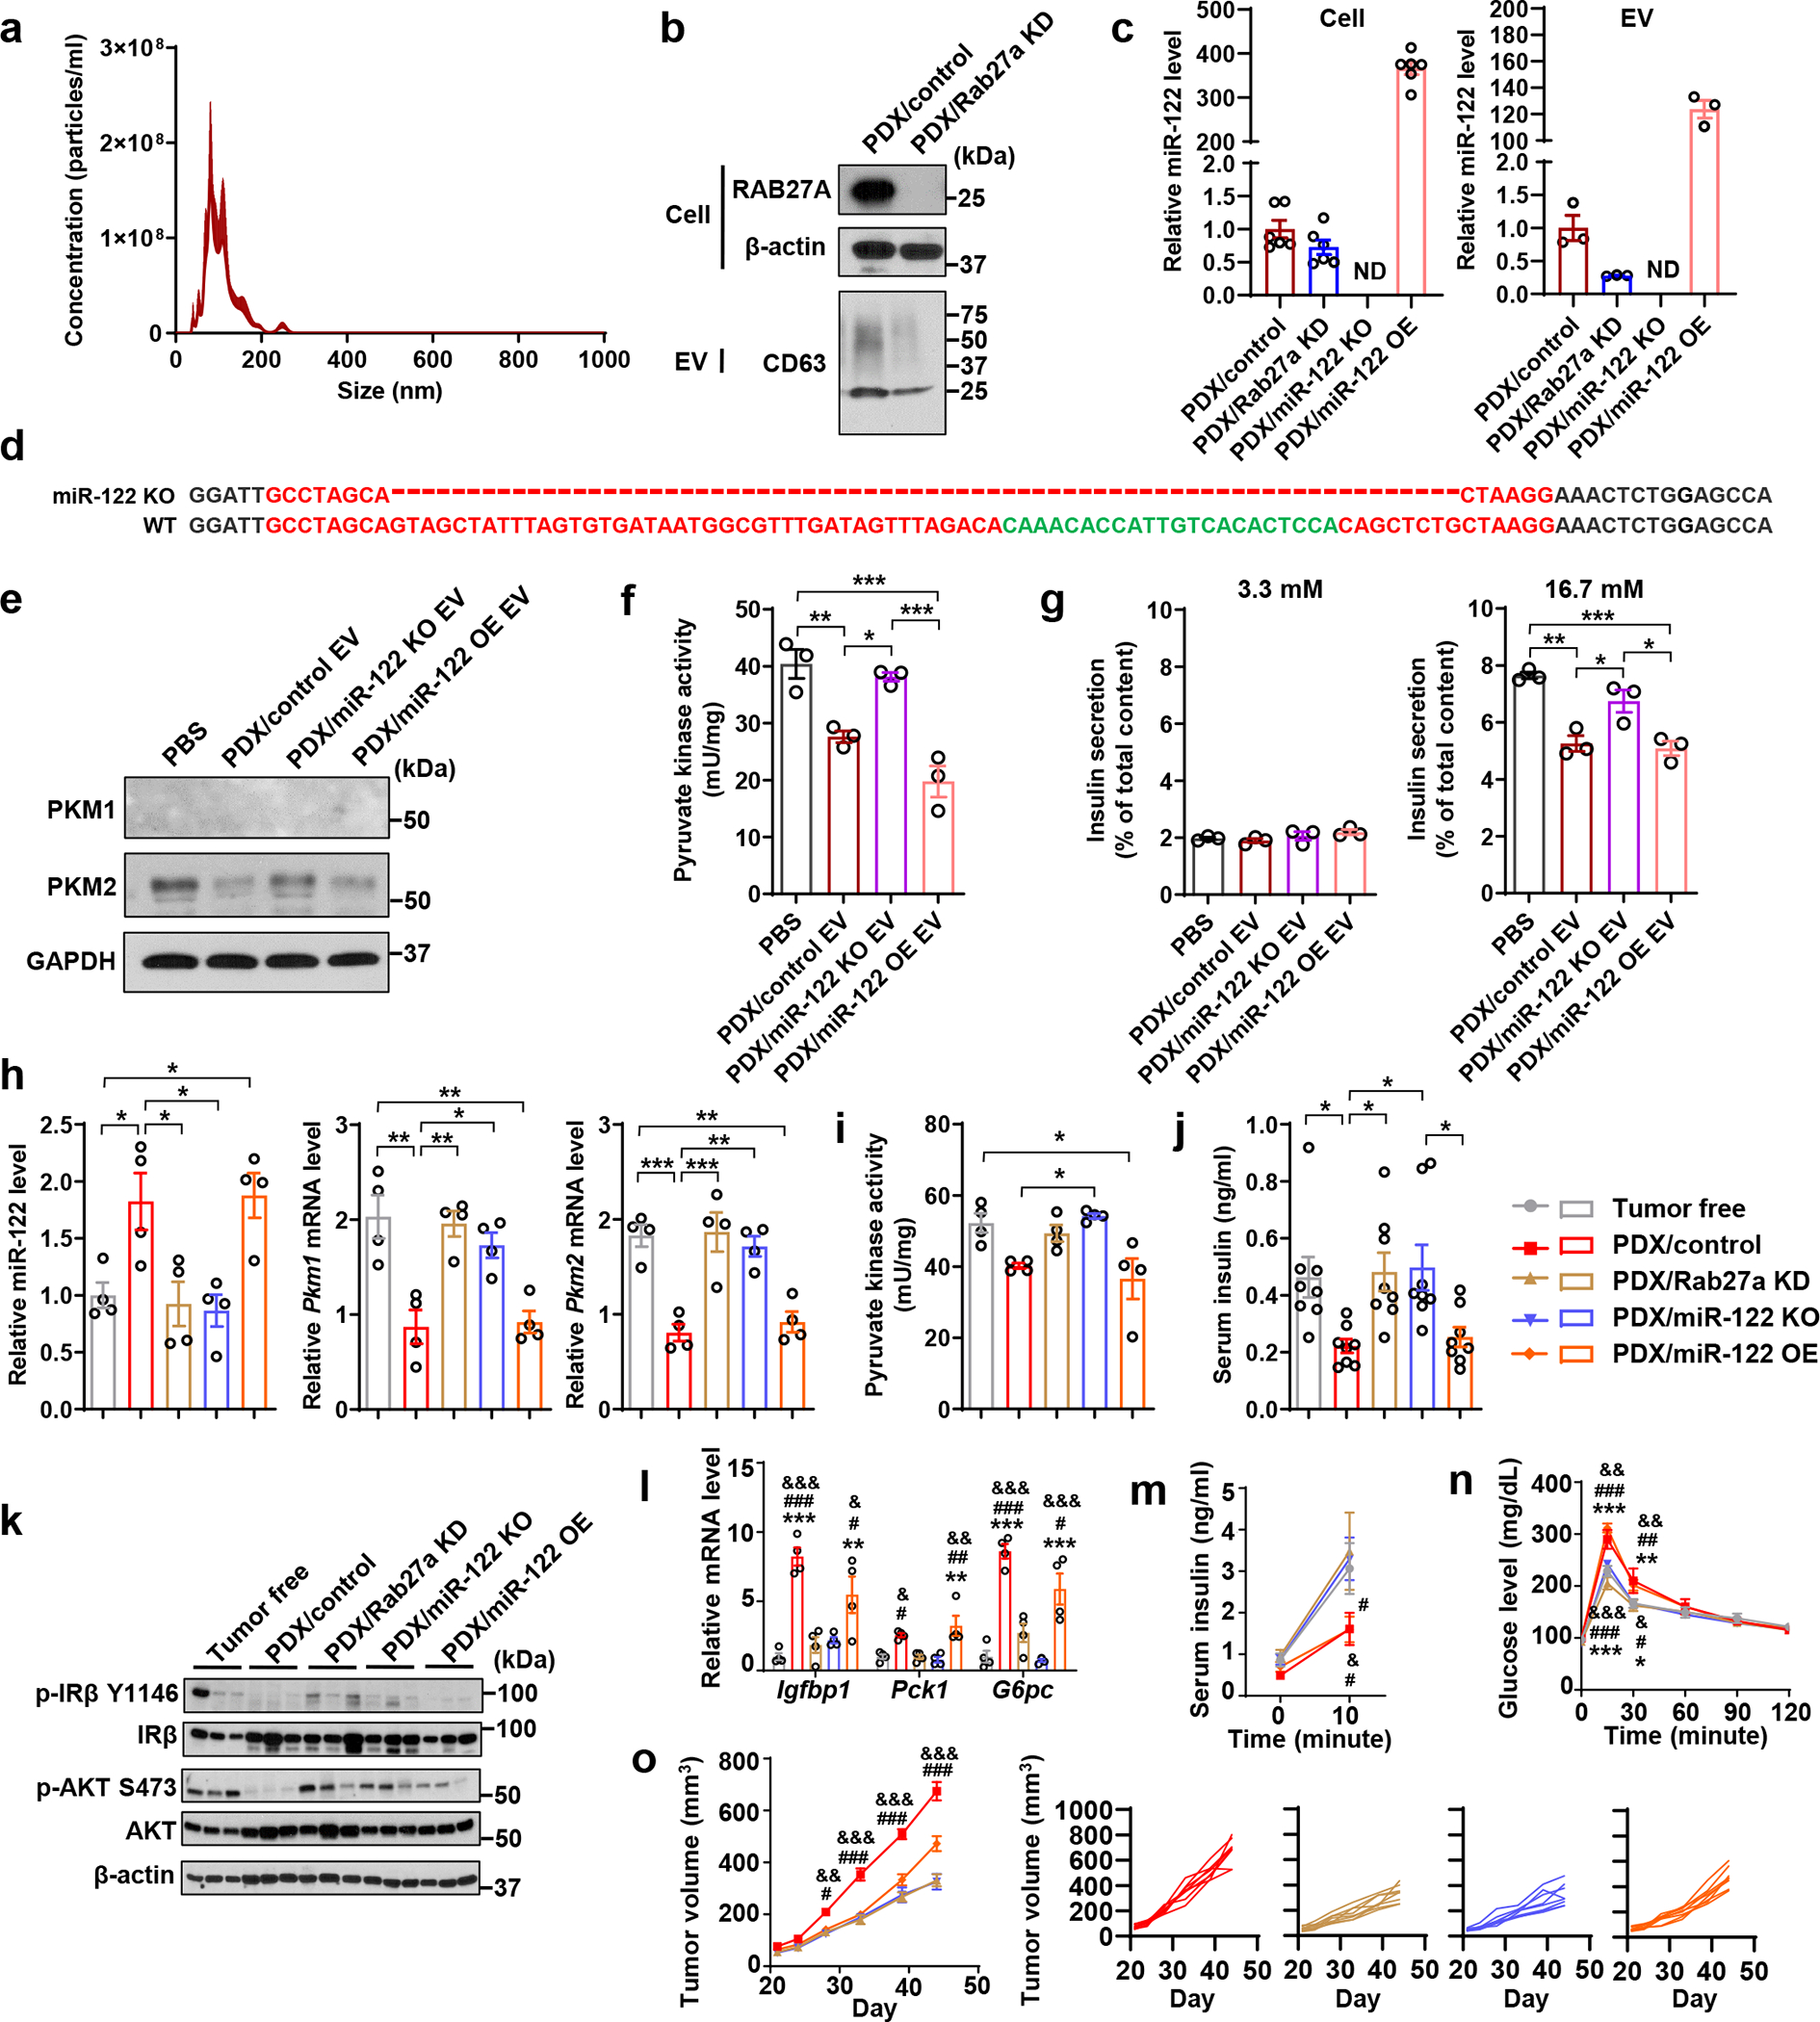
a, NTA of PDX-derived EVs (n=3 replicates). b, Immunoblots showing protein levels in indicated PDX-derived cells and EVs. EVs secreted from equal number of cells were loaded. c, Relative miR-122 levels in indicated cells and EVs (n=6 replicates for cells; n=3 replicates for EVs). d, Sanger sequencing showing genetic knockout of hsa-mir-122 gene in PDX/miR-122 KO cells. Dashes indicate the deleted region. e, Immunoblots showing protein levels in human islets treated with PBS or PDX-derived EVs for 48 hours. f, Pyruvate kinase activity in EV/PBS-treated human islets (n=3 replicates). g, Insulin secretion by human islets (n=3 replicates) under low (left) or high glucose (right). h, Relative miR-122 (left) and Pkm1/2 mRNA levels (right) in mouse islets isolated from indicated groups (n=4 mice per group). i, Pyruvate kinase activity in mouse islets isolated from indicated groups (n=4 mice per group). j, Fasting insulin levels (n=8 mice per group). k, Immunoblots showing protein levels in the liver from indicated groups. l, mRNA levels in the liver (n=4 mice per group). m, Basal and glucose-stimulated insulin levels (n=8 mice per group). n, IP-GTT with AUC analysis (n=8 mice per group). o, Tumour volume measurements (left; n=8 mice per group) and individual tumour growth curve (right). For bar and line graphs, values are shown as mean ± SEM. One-way ANOVA followed by Tukey’s multiple comparison test was used for f-l. Two-way ANOVA followed by Tukey’s multiple comparison test was used for m-o. *P<0.05, **P<0.01, ***P<0.001 for indicated group vs. tumour-free, or as indicated; #P<0.05, ##P<0.01, ###P<0.001 for indicated group vs. PDX/Rab27a KD; &P<0.05, &&P<0.01, &&&P<0.001 for indicated group vs. PDX/miR-122 KO. In m-o, signs above the curves indicate PDX/control group vs. indicated groups and signs underneath the curves indicate PDX/miR-122 OE group vs. indicated groups. Numerical source data, statistics and unprocessed blots are available online.
miR-122 mediates BC-associated insulin dysregulation
The miR-122 KO tumour model lacks actions of both intracellular and EV miR-122. To define the role of EV-associated miR-122, we administered EVs from WT or miR-122 KO MDA-MB-231 cells to mice bearing MDA-MB-231/miR-122 KO tumours. Compared to miR-122-deficient EVs, WT EVs led to higher miR-122 and lower PKM1/2 expression and activity in islets (Fig. 5a–c), impaired insulin secretion and signalling (Fig. 5d–f), and higher blood glucose (Fig. 5g), resembling the systemic effects of WT MDA-MB-231 tumours. Growth of the miR-122 KO tumours was also enhanced by WT EVs (Fig. 5h).
Figure 5: miR-122 acts as a main effector in BC-associated dysregulation of insulin and glucose homeostasis.
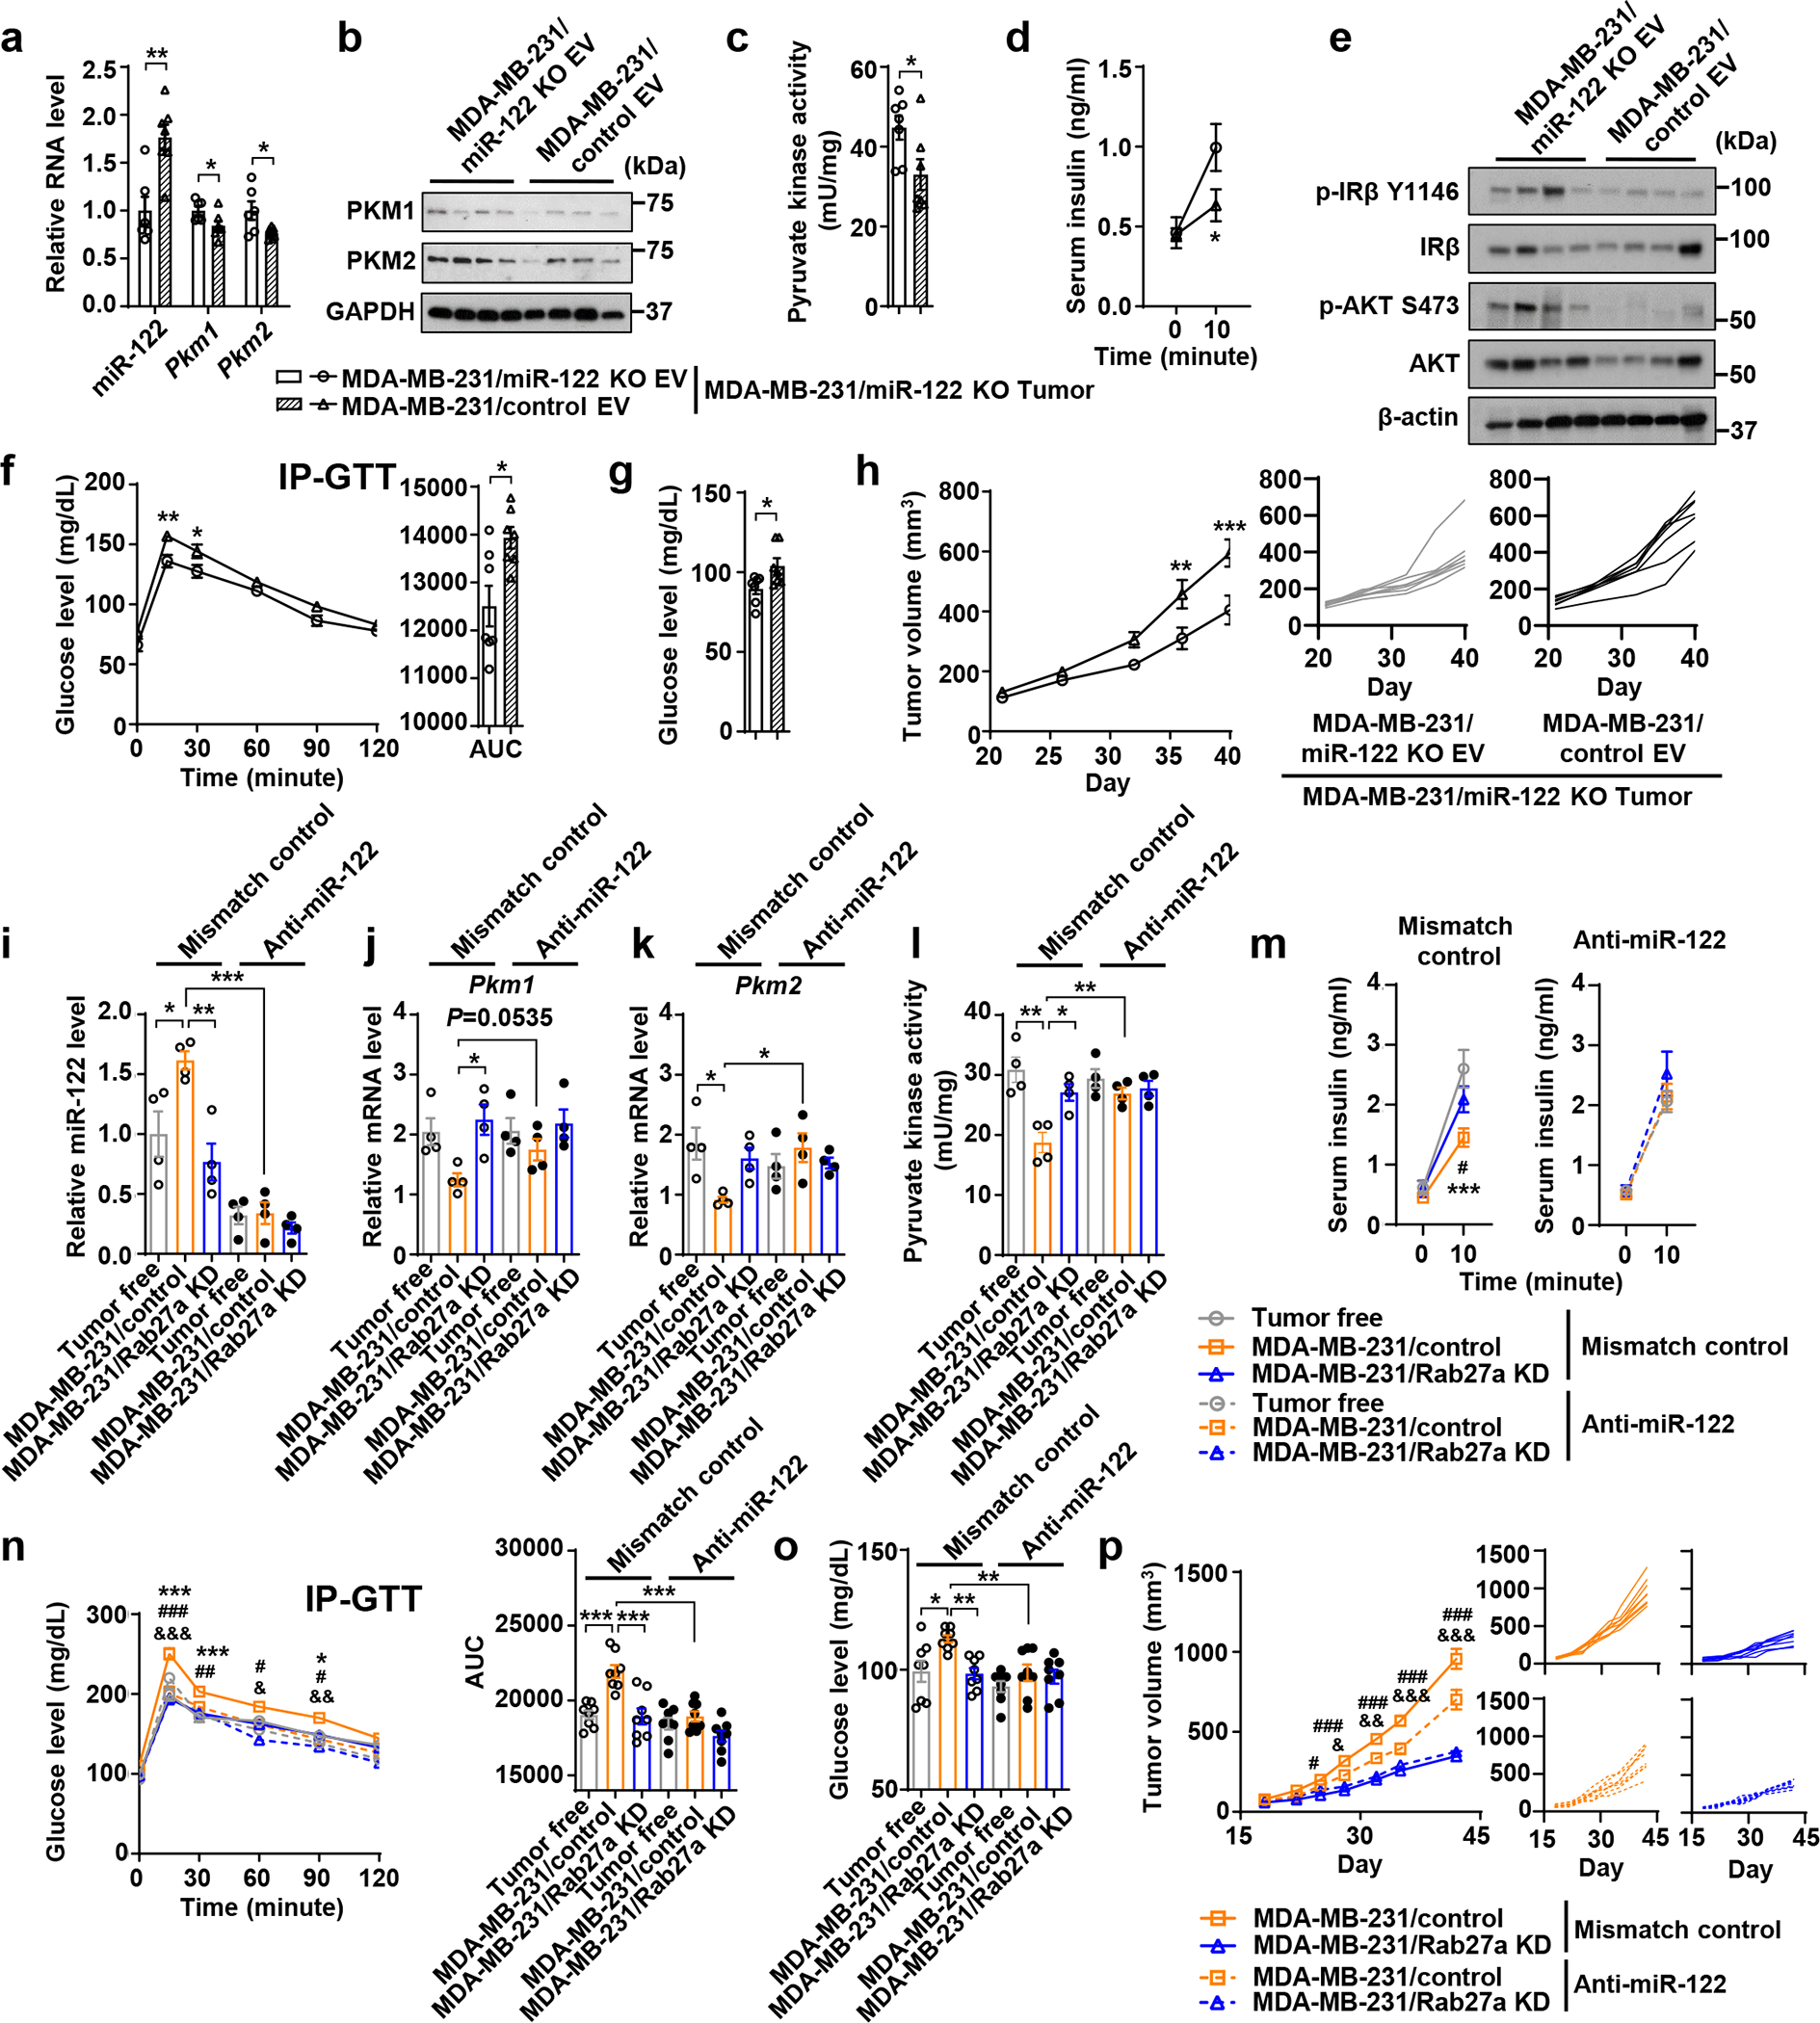
a-h, Mice were grafted with MDA-MB-231/miR-122 KO tumours followed by 10 semi-weekly EV injections prior to the following experiments. a, Relative RNA levels in islets (n=7 mice for MDA-MB-231/control EV group and n=6 for MDA-MB-231/miR-122 KO EV group). b, Immunoblots showing protein levels in islets. c, Pyruvate kinase activity in islets (n=7 mice per group). d, Basal and glucose-stimulated insulin levels (n=7 mice for MDA-MB-231/control EV group and n=6 for MDA-MB-231/miR-122 KO EV group). e, Immunoblots showing protein levels in liver. f, IP-GTT with AUC analysis (n=8 mice per group). g, Fasting blood glucose levels (n=7 mice per group). h, Tumour volumes (left; n=8 mice per group) and individual tumour growth curve (right). i-p, miR-122 ONI (anti-miR-122) or mismatch control were injected into tumour-free or tumour-bearing mice after tumour cell injection, for a total of ~6 weeks. i-k (n=4 mice per group): RNA levels of miR-122 (i), Pkm1 (j), and Pkm2 (k) in islets. l, Pyruvate kinase activity in islets (n=4 mice per group). m, Basal and glucose-stimulated insulin levels. n, IP-GTT with AUC analysis. o, Fasting blood glucose levels. p, Tumours volumes (left) and individual tumour growth curve (right) (n=8 mice per group for m-p). For all bar and line graphs, values are shown as mean ± SEM. Unpaired two-tailed t-test was used for a,c,g and AUC panel of f. Two-way ANOVA followed by Bonferroni’s multiple comparison test was used for d,f,h. For i-l, o and AUC panel of n, one-way ANOVA followed by Tukey’s multiple comparison test was used among groups receiving the same antisense or control treatment and unpaired t-test was used for comparing MDA-MB-231/control groups with mismatch control or anti-miR-122. For m,n,p, two-way ANOVA followed by Tukey’s multiple comparison test was used. *P<0.05, **P<0.01, ***P<0.001 for MDA-MB-231/control vs. tumour-free both receiving mismatch control or as indicated; #P<0.05, ##P<0.01, ###P<0.001 for MDA-MB-231/control vs. MDA-MB-231/Rab27a KD both receiving mismatch control; &P<0.05, &&P<0.01, &&&P<0.001 for MDA-MB-231/control receiving anti-miR-122 vs. mismatch control. Numerical source data, statistics and unprocessed blots are available online.
We further examined the effect of an oligonucleotide inhibitor (ONI) of miR-122 (miR-122 ONI). Compared to the mismatch control, miR-122 ONI decreased miR-122 levels in pancreatic islets in both tumour-free and tumour-bearing mice, making them nondifferent from each other (Fig. 5i). Importantly, miR-122 ONI completely abolished the effects of MDA-MB-231 tumours on islet PKM expression, insulin secretion, and glucose homeostasis, reversing the corresponding parameters to normal levels in tumour-free mice, without affecting these aspects in tumour-free mice and mice bearing MDA-MB-231/Rab27a KD tumours (Fig. 5j–o). Consistently, miR-122 ONI suppressed the growth of WT but not Rab27a KD tumours (Fig. 5p), suggesting miR-122 influences tumour growth mainly through tumour EV secretion and host adaptation.
Exogenous PKM2 abolishes EV’s effect on insulin secretion
Using adeno-associated virus 8 (AAV8) expressing PKM2 (lacking 3’UTR) or EGFP (as control) under the control of INS promoter, we restored PKM2 expression in β-cells. Viruses were injected through the bile duct, which has been shown to effectively transduce pancreatic β-cells44. EGFP signals indeed confirmed expression of the INS-promoter-driven proteins in islets but not liver (Fig. 6a). At 5 weeks after tumour cell implantation, tumour-bearing mice with β-cell-specific restoration of PKM2 showed near normal PKM level in islets (Fig. 6b). With body weight unchanged (Fig. 6c), these mice showed corrected GSIS (Fig. 6d), glucose tolerance (Fig. 6e), insulin signalling (Fig. 6f) and gluconeogenesis-related gene expression in liver (Fig. 6g), and decreased fasting glucose (Fig. 6h). Mice with restored PKM2 expression in β-cells also showed suppressed tumour growth and reduced tumour cell proliferation (Fig. 6i,j).
Figure 6: Restoration of PKM2 expression in β-cells abolishes the effects of BC tumours on insulin and glucose metabolism.
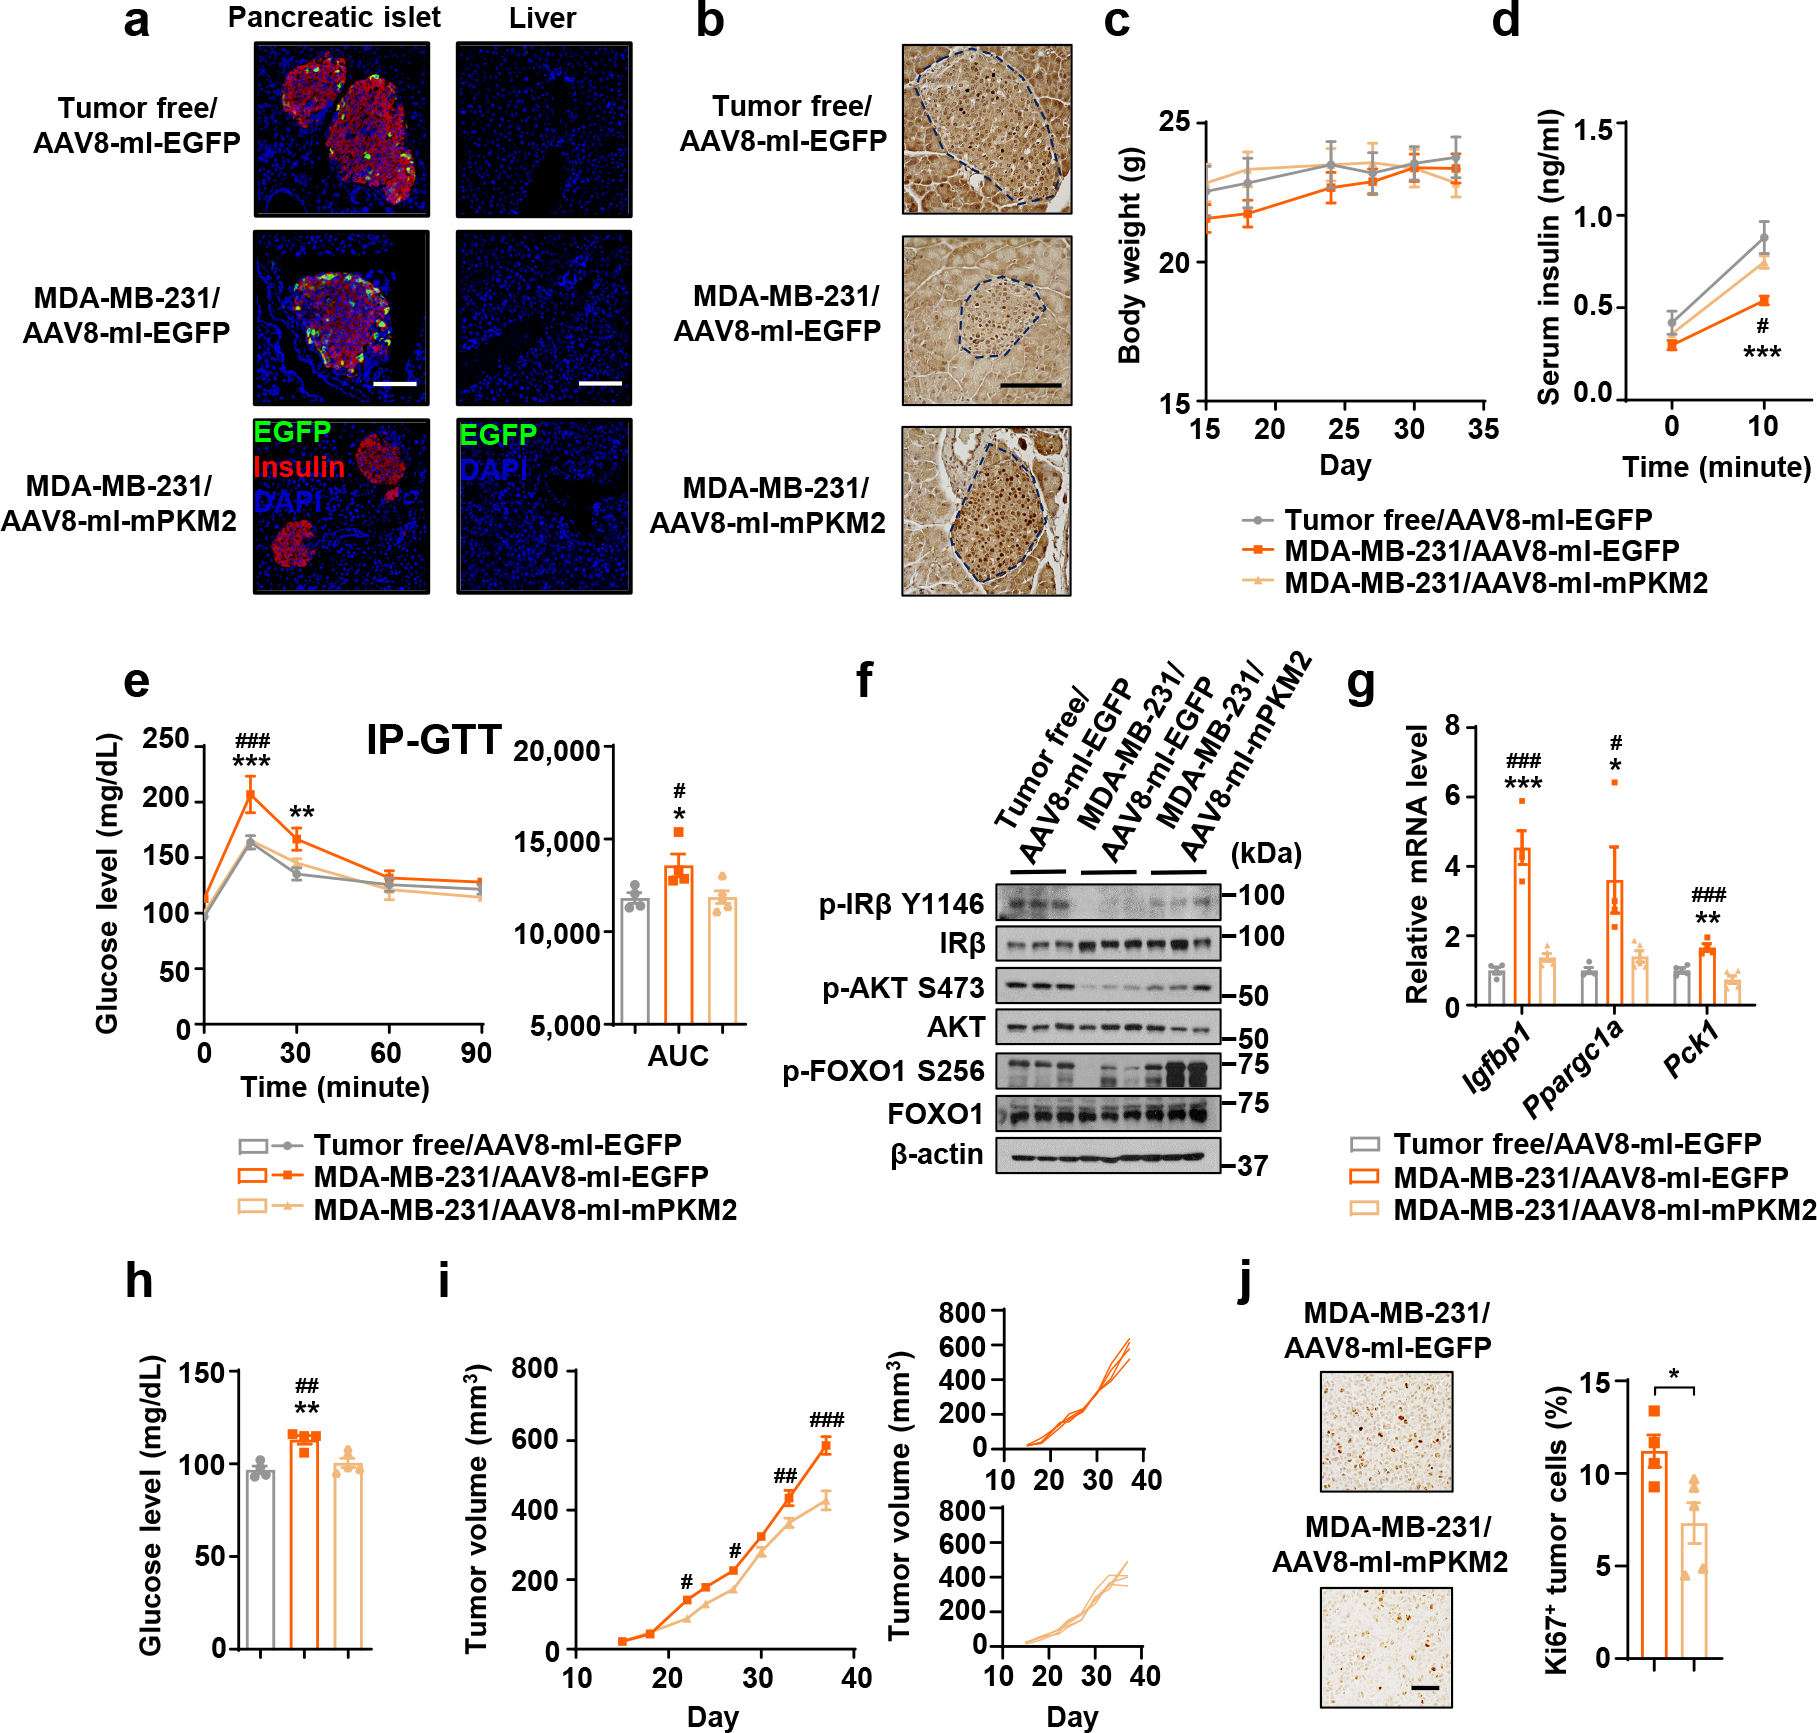
Indicated AAV were injected through the bile duct prior to mammary fat pad injection of MDA-MB-231 cells. Tumour-bearing and age-matched tumour-free mice were sacrificed for tissue collection before all tests of insulin and glucose metabolism were performed on day 30–35. a, Immunofluorescence of pancreas sections (left) showing AAV-delivered EGFP expression (green) in β-cells (insulin+; red). Liver sections (right) were stained with EGFP antibody to show lack of a leakage from bile duct injection. Bar=100 μm. b, Representative IHC of PKM in pancreas sections. Islets are indicated by dashed lines. Bar=100 μm. c, Body weight over time. d, Basal and glucose-stimulated insulin levels. e, IP-GTT with AUC analysis. f, Immunoblots showing protein levels in the liver. g, Relative RNA levels in the liver. h, Fasting blood glucose. i, Tumour volumes (left) and individual tumour growth curve (right). j, Representative IHC of Ki67 (left) and percentage of Ki67+ tumour cells (right). Bar=100 μm. For all bar and line graphs, values are shown as mean ± SEM. n=5 mice for MDA-MB-231/AAV8-mI-mPKM2 group and n=4 mice for other groups. Two-way ANOVA followed by Tukey’s multiple comparison test was used for c-e. Two-way ANOVA followed by Bonferroni’s multiple comparison test was used for i. One-way ANOVA followed by Tukey’s multiple comparison test was used for g,h and AUC analysis of e. Unpaired two-tailed t-test was used for j. *P<0.05, **P<0.01, ***P<0.001 for MDA-MB-231/AAV8-mI-EGFP vs. tumour-free/AAV8-mI-EGFP or as indicated; #P<0.05, ##P<0.01, ###P<0.001 for MDA-MB-231/AAV8-mI-EGFP vs. MDA-MB-231/AAV8-mI-mPKM2. Numerical source data, statistics and unprocessed blots are available online.
Tumour growth is regulated by insulin and glucose levels
To determine the direct effects of altered glucose and insulin levels on tumour growth, we first cultured BC cells under various glucose concentrations to match the blood glucose levels detected in mouse models. Glucose in this concentration range stimulated cancer cell proliferation and migration in a dose-dependent manner but did not affect normal cells (Extended Data Fig. 6a,b). Cancer cell proliferation did not differentially respond to the two physiological concentrations of insulin (5 and 7.5 mU/L), and was only increased by a supraphysiological level of insulin (500 mU/L) (Extended Data Fig. 6c).
For in vivo evidence, we performed insulin supplementation using insulin-releasing pellets45. With body weight unaffected, insulin supplementation blunted the differences between tumour-free and tumour-bearing mice in basal and glucose-stimulated insulin levels, insulin signalling in liver, and glucose tolerance (Fig. 7a–d). Consistently, the blood glucose levels were lowered by insulin supplementation and no longer differed between groups (Fig. 7e). Mice bearing MDA-MB-231/control but not MDA-MB-231/Rab27a KD tumours showed suppressed tumour growth when implanted with insulin pellets (Fig. 7f), indicating that in this model, tumour growth was suppressed by a physiological concentration of insulin through reinforced glycaemic control.
Figure 7: Supplementing insulin or lowering glucose levels intervenes BC tumour growth.
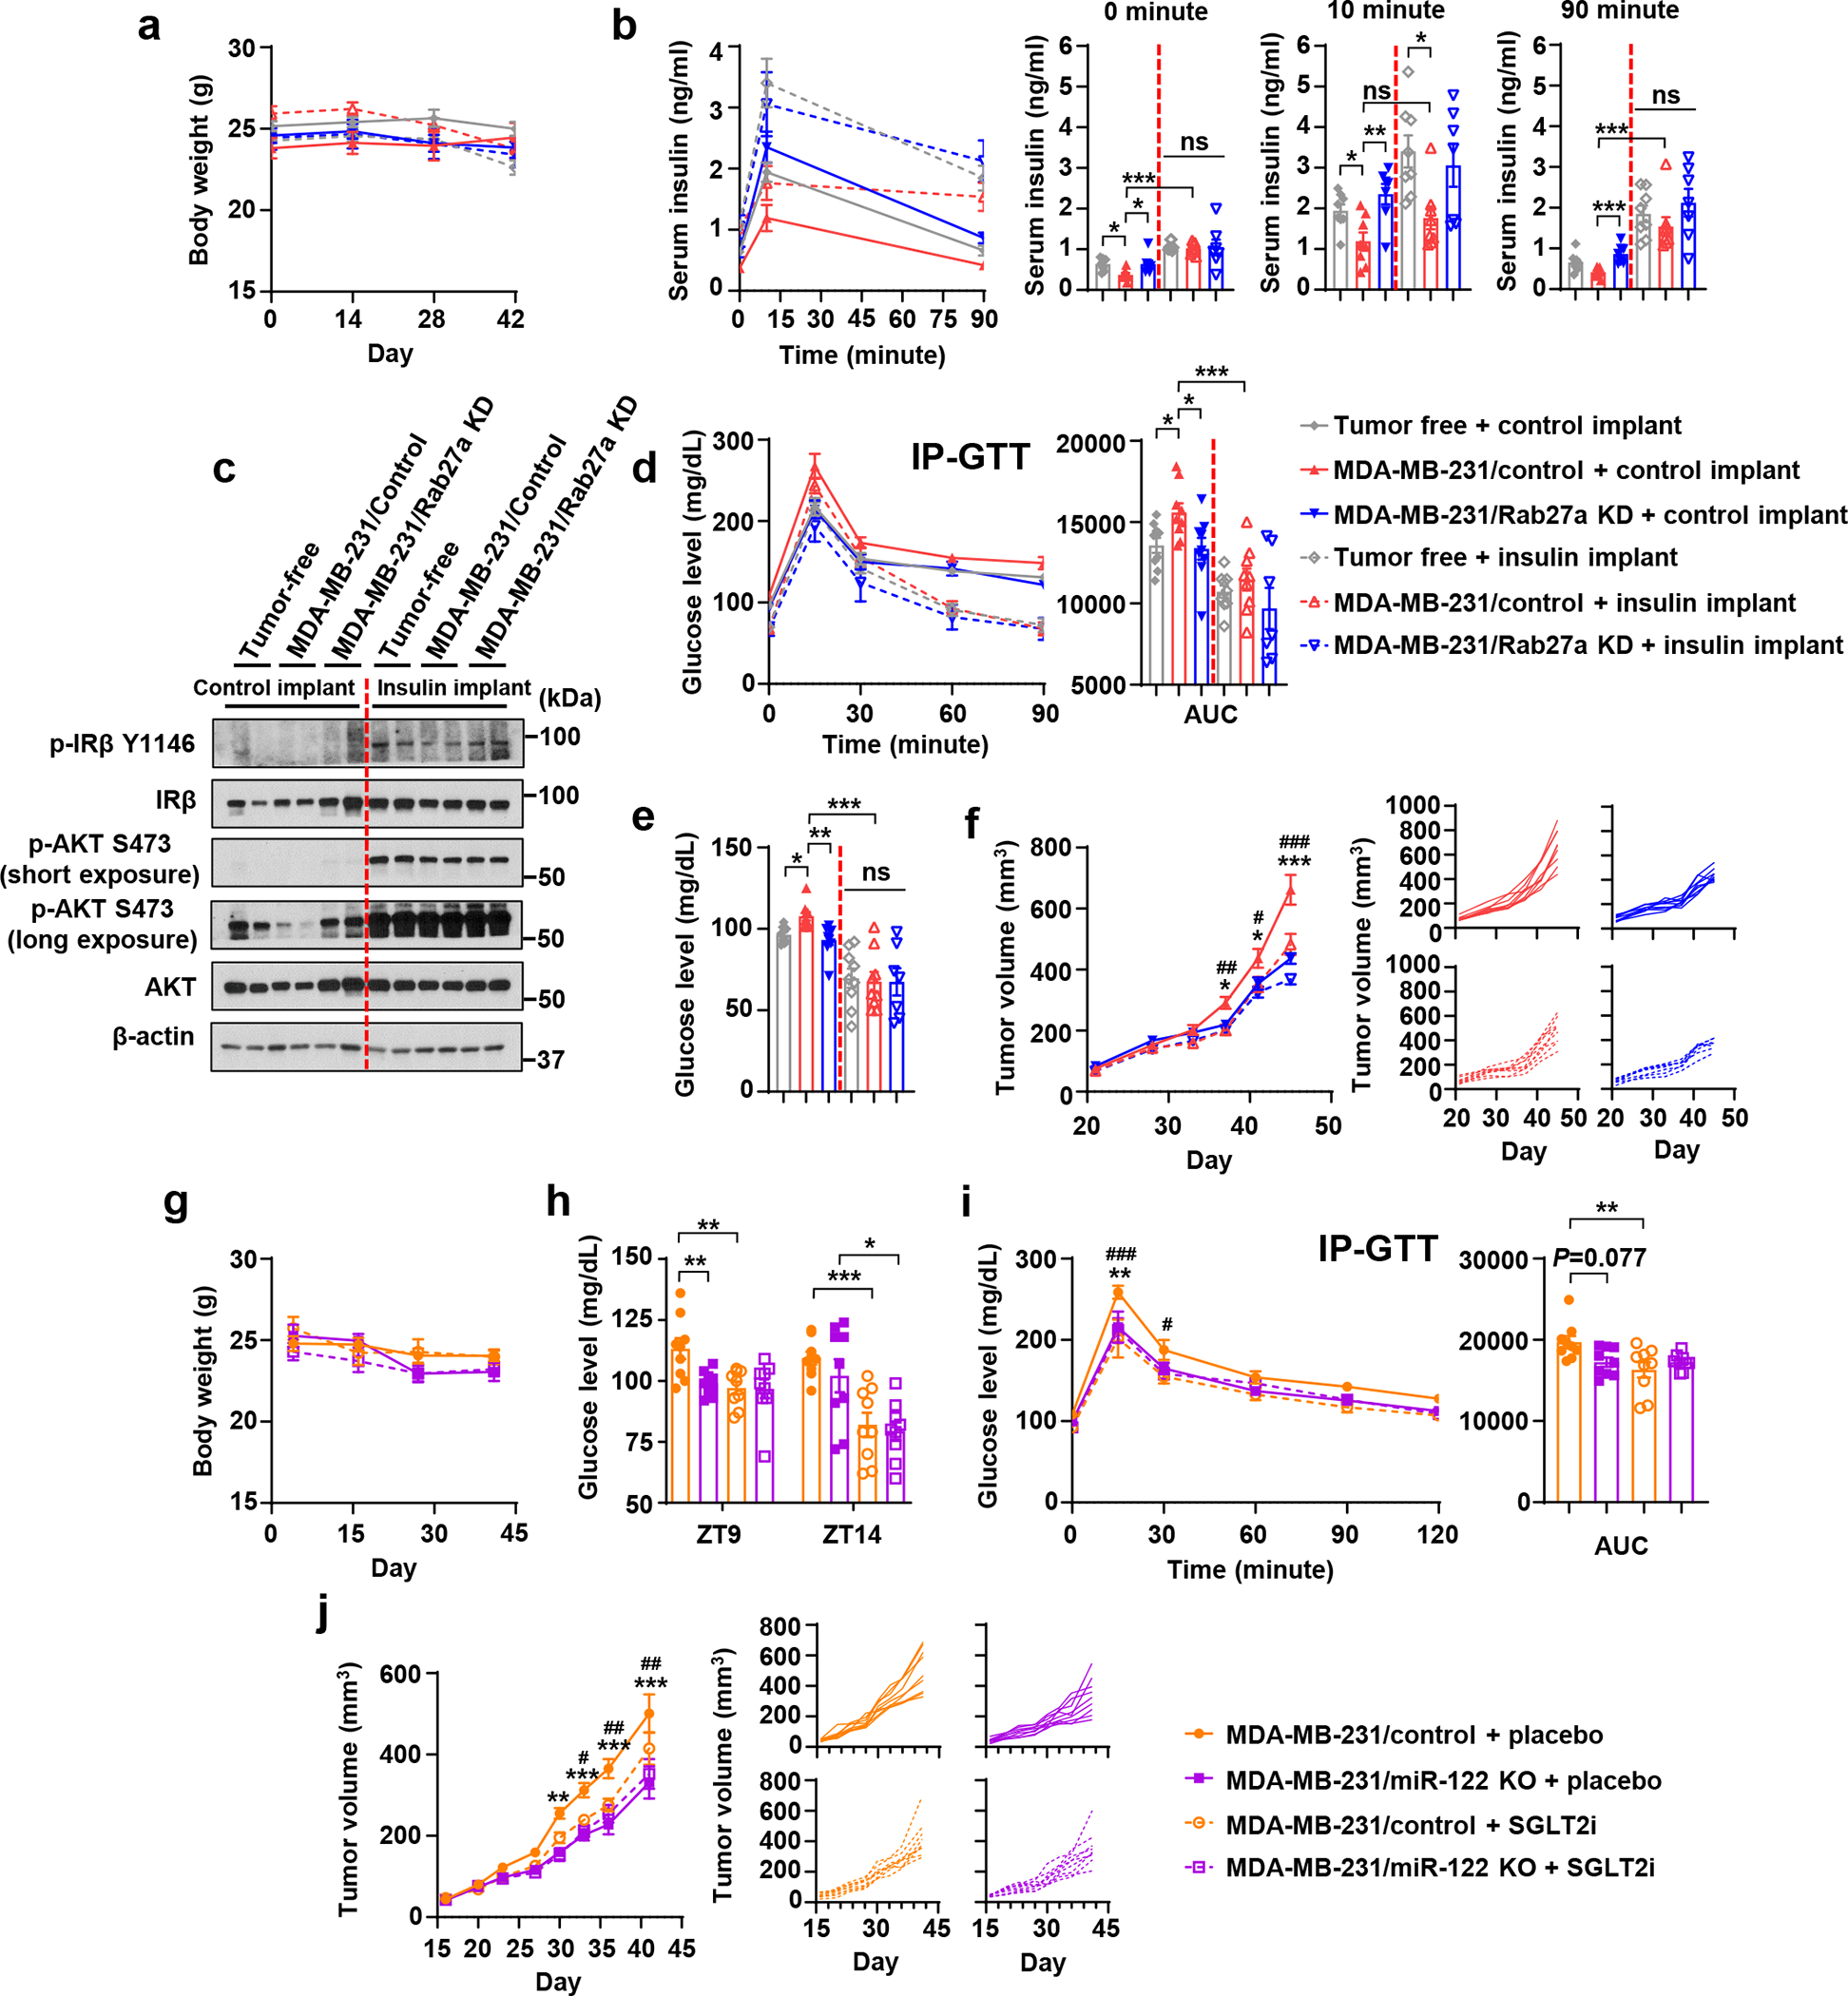
a-f, Insulin-releasing or control pellets were implanted in tumour-bearing and tumour-free mice. Live animal assays were conducted in week 6 post tumour cell injection, and tissues were collected at the end of week 6. a, Body weight over time (n=7 mice for MDA-MB-231/Rab27a KD group with insulin implant and n=9 mice per group for others. b, Basal (fasting, at 0 minute) and glucose-stimulated insulin levels (at 10 or 90 minutes; n=7 for MDA-MB-231/Rab27a KD groups with insulin or control implants and n=8 mice per group for others). c, Immunoblots of liver tissues. d, IP-GTT with AUC analysis. e, Fasting blood glucose levels. f, Tumour volumes (left) and individual tumour growth curves (right). For a, d-f, n=7 mice for MDA-MB-231/Rab27a KD group with insulin implant and n=9 mice per group for others.
g-j, SGLT2i or placebo was orally given to tumour-bearing mice. Live animal assays were conducted in week 6 and tissues were collected at the end of week 6. g, Body weight over time. h, Blood glucose levels at ZT9 and ZT14 (1 hour before or 4 hours after drug administration). i, IP-GTT with AUC analysis. j, Tumour volumes (left) and individual tumour growth curves (right). For g-j, n=9 mice per group.
For bar and line graphs, values are shown as mean ± SEM. Two-way ANOVA followed by Tukey’s multiple comparison test was used for a,d,f,g,i,j. One-way ANOVA followed by Tukey’s multiple comparison test was used among groups with the same implants in b,e and AUC analysis of d and i. Unpaired two-tailed t-test was used for MDA-MB-231/control with control vs. insulin implants in b,d,e, as well as for h. For a-f, *P<0.05, **P<0.01, ***P<0.001 for MDA-MB-231/control vs. MDA-MB-231/Rab27a KD with control implants or as indicated; #P<0.05, ##P<0.01, ###P<0.001 for MDA-MB-231/control with control vs. insulin implants. ns: not significant. For g-j, *P<0.05, **P<0.01, ***P<0.001 for MDA-MB-231/control + placebo vs. MDA-MB-231/miR-122 KO + placebo or as indicated; #P<0.05, ##P<0.01, ###P<0.001 for MDA-MB-231/control + placebo vs. MDA-MB-231/control + SGLT2i. Numerical source data, statistics and unprocessed blots are available online.
We next determined if lowering blood glucose affects tumour growth by using a sodium-glucose co-transporter inhibitor (SGLT2i)46. While body weights remained unchanged during the treatment period (Fig. 7g), the blood glucose levels were lowered at various time points by SGLT2i (Fig. 7h). SGLT2i also alleviated the impaired glucose tolerance in tumour-bearing mice (Fig. 7i) and suppressed the growth of MDA-MB-231/control tumours but not the MDA-MB-231/miR-122 KO tumours (Fig. 7j). To evaluate the potential effects of altered blood glucose levels on pancreatic islets, we assessed PDX1 expression and apoptosis in β-cells as well as the overall islet area (Extended Data Fig. 7a–c) and did not detect any differences.
EV miR-122 is associated with glucose and insulin in blood
To obtain clinical evidence of the association between EV-associated miR-122 and glucose/insulin dysregulation, we analysed fasting serum samples from 26 female BC patients who had never been diagnosed with diabetes and had a BMI <35 kg/m2, together with a group of 30 non-cancer control females that had never been diagnosed with cancer or diabetes and were initially selected to match the age and BMI of BC patients. Sera from the BC group showed higher levels of fasting glucose and lower levels of c-peptide although the difference in insulin levels was not significant (Fig. 8a–c), which may be due to the short in vivo half-life of insulin as a result of elimination by liver. Because circulating miR-122 has been associated with hyperglycaemia and IR in non-cancer humans47, 48, we included an additional group of 20 non-cancer control females that were selected to match the high glucose (HG) levels in BC patients (Fig. 8a). The HG control group also exhibited higher insulin/c-peptide levels compared to the other two groups (Fig. 8b,c). Homeostatic model assessments (HOMA) suggested suppressed β-cell function without significant IR in this BC patient cohort (Fig. 8d–e).
Figure 8: miR-122 in circulating EVs is associated with fasting blood glucose and insulin in BC patients.
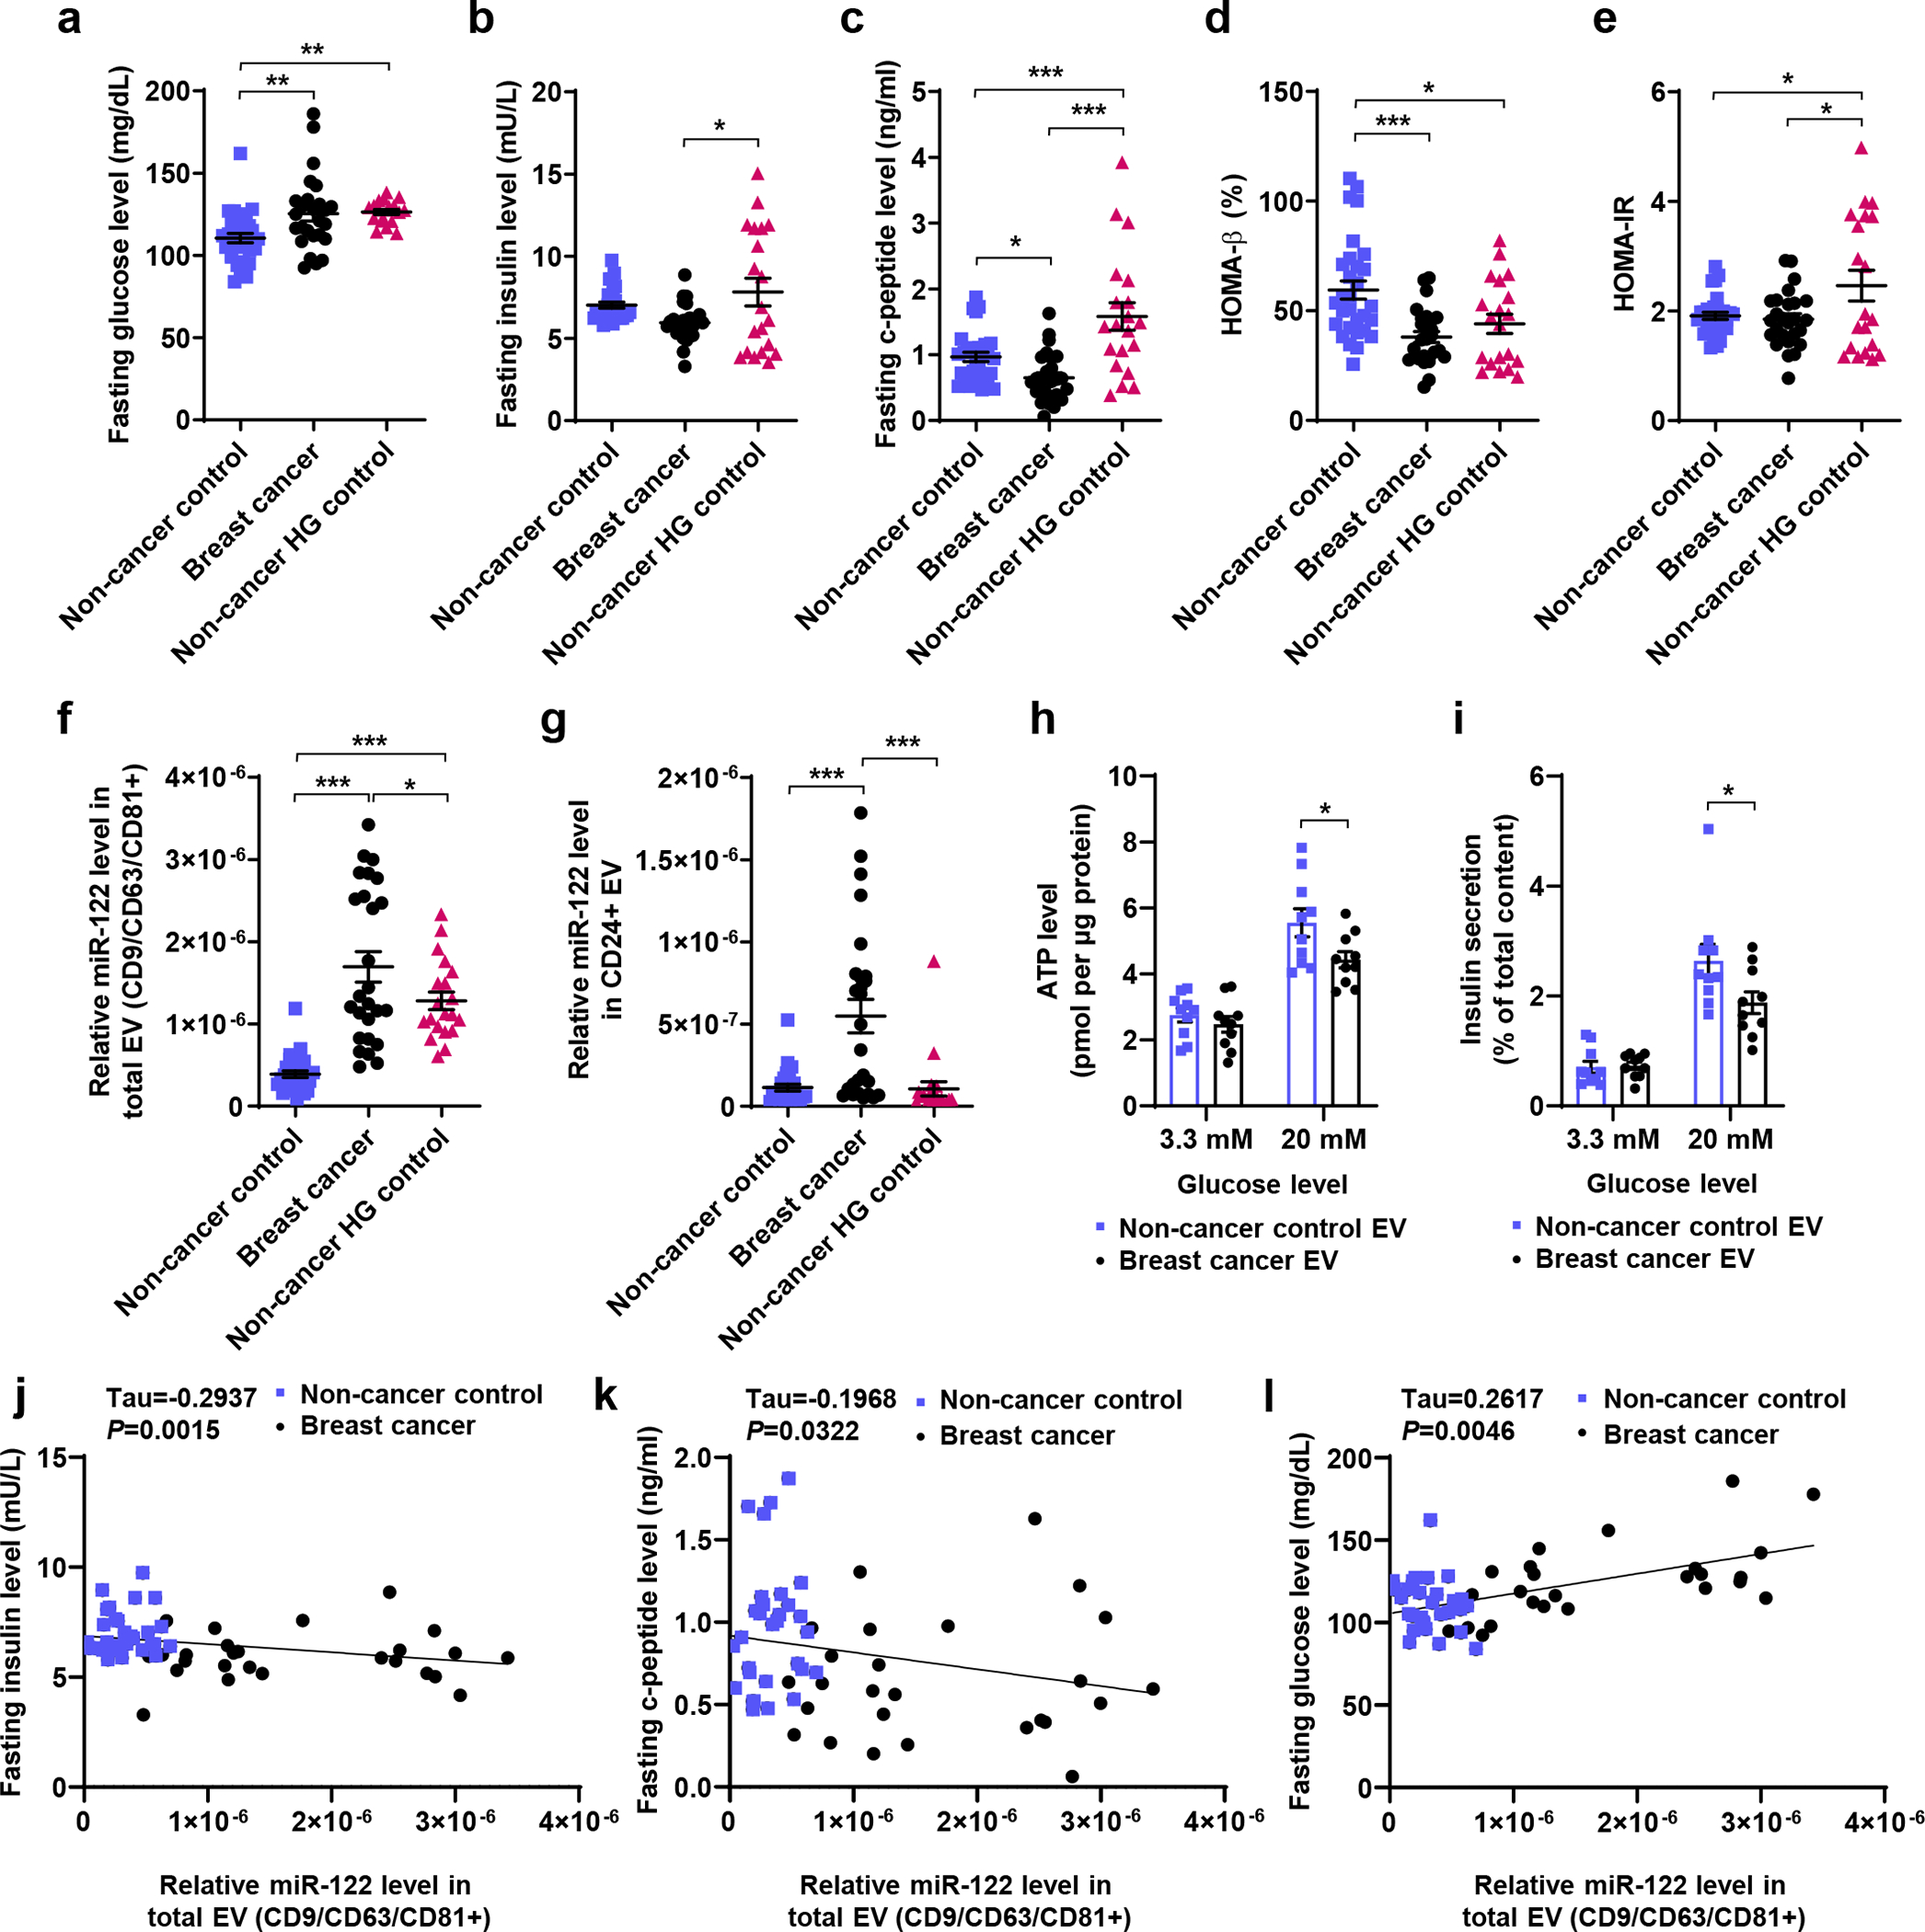
a-g, Fasting serum was collected from BC patients who had never been diagnosed with diabetes and had a BMI<35 kg/m2 (n=26), a group of non-cancer control females initially selected to match the BC patient characteristics of age and BMI (n=30), and an additional group of non-cancer control females selected to match the high glucose (HG) levels in BC patients (n=20). Scatter plots: (a) glucose, (b) insulin, (c) c-peptide, (d) HOMA-β (%), (e) HOMA-IR, (f) miR-122 in total circulating EVs (CD9/CD63/CD81+), and (g) miR-122 in CD24+ circulating EVs compared among the three groups (n=27 for non-cancer control group in g due to insufficient amount of serum for the other 3 samples in this group). Relative miR-122 levels were determined in circulating EVs enriched by CD9/CD63/CD81 or CD24 antibodies by RT-qPCR and normalized to ath-miR159a spike-in control. h and i, Donated human islets were treated twice in 48 hours with EVs purified from serum samples of selected non-cancer control and breast cancer subjects prior to assays of ATP levels (h) and insulin secretion (i) under 3.3 mM or 20 mM glucose stimulation (n=10 replicates). j-l, Scatter plots showing the correlations between relative miR-122 levels and fasting insulin (j), c-peptide (k), and glucose (l) among BC patients and the non-cancer control females (the non-cancer HG group is excluded due to the presence of IR confounding data interpretation). Kendall rank correlation coefficient (Tau) and P value are shown. For bar graphs in h and i, values are shown as mean ± SEM. One-way ANOVA followed by Holm-Sidak’s multiple comparison test was used for a-g. Two-way ANOVA followed by Bonferroni’s multiple comparison test was used for h and i. *P<0.05, **P<0.01, ***P<0.001. Numerical source data and statistics are available online.
Levels of miR-122 in total circulating EVs were higher in the BC group compared to the two non-cancer control groups (Fig. 8f). CD24 has been identified as a marker for breast tumour-derived EVs49. Circulating EVs in our BC patient sera indeed carried high levels of CD24, allowing enrichment of CD24+ EVs (Extended Data Fig. 8a,b). miR-122 levels in circulating CD24+ EVs were also higher in BC patients compared to non-cancer controls (Fig. 8g). Although the HG control group had higher levels of miR-122 in total circulating EVs compared to the other control group (Fig. 8f), this was not observed with CD24+ EVs (Fig. 8g). Compared to the BC group, the HG control group showed a lower calculated ratio of miR-122 abundance in CD24+ vs. total EVs (Extended Data Fig. 8c), suggesting different distributions of circulating miR-122 among different EV subpopulations in these two groups. A majority of miR-122 associated with CD24+ EVs from BC patients was protected from RNase digestion (Extended Data Fig. 8d), indicating miR-122 was largely packed inside of CD24+ EVs.
To assess the function of serum-derived EVs, we purified total circulating EVs from 10 BC patients and 10 non-cancer controls and used the EVs to treat human islets from a donor without diabetes or obesity. Under high glucose stimulation, islets treated with BC-patient-derived EVs showed lower ATP levels and lower insulin secretion (Fig. 8h,i). We further evaluated the correlations between miR-122 in total circulating EVs and serum levels of insulin, c-peptide, and glucose. The HG control group was excluded from this analysis due to the presence of IR (Fig. 8e), which would be a confounding factor for evaluation of insulin secretion. miR-122 was negatively correlated with insulin and c-peptide levels and positively correlated with fasting glucose levels in the sera (Fig. 8j–l). These results support our mechanistic model that systemic insulin/glucose homeostasis can be regulated by miR-122-loaded EVs in some BC patients.
Discussion
Large cohort studies have revealed an increased incidence of diabetes among BC survivors24–27. This may suggest BC-derived factors that predispose some cancer patients to diabetes, or reflect common risk factors for BC and diabetes or the effect of cancer treatment. Our results reveal that EVs from breast tumours directly suppress insulin secretion, leading to impaired glycaemic control and enhanced tumour growth. These findings also support a greater need for diabetes screening and prevention among BC patients and survivors.
Insulin signalling has been shown to promote cancer progression in certain contexts through activating PI3K pathway in tumours50, 51. Enhanced mammary tumour growth is observed in a T2D mouse model compared to non-diabetic mice, and this effect is reversed by dual blockade of insulin receptor and IGF-IR52. PI3K inhibitor treatment induces hyperinsulinemia, which compromises treatment effectiveness by reactivating the PI3K pathway in tumours53. This work also suggests that insulin receptor signalling lacks a major effect on tumour growth unless there is a supraphysiological amount of insulin, as knockdown of insulin receptor has little effect on tumour growth in the absence of a PI3K inhibitor53. Therefore, the direct effect of insulin signalling in tumours is context-dependent, and a tumour-promoting effect seems to be specific to T2D and hyperinsulinemia conditions.
Cancer cells display enhanced aerobic glycolysis to meet their massive anabolic needs54. High glucose per se can influence cancer cells by providing a source of energy to fuel the tumour, and by stimulating cancer cell proliferation, migration, and metastasis2. In addition, high glucose may also induce epigenetic modulations in tumour cells and a hyperglycaemic memory in multiple organs. These potential effects warrant future investigations to fully understand the pathogenic crosstalk between diabetes and BC, and to provide basis for therapeutically targeting these systemic effects in treating cancer and metabolic comorbidities.
Exosomes secreted by pancreatic cancer cells have been reported to deliver adrenomedullin to β-cells, leading to β-cell dysfunction and suppressed insulin secretion55. A number of miRNAs including miR-122 are elevated in the blood of pancreatic cancer patients56. Baseline levels of circulating miR-122 have been associated with development of metabolic syndrome and T2D in non-cancer humans48. Therefore, miR-122 from tumour and non-tumour origins may together contribute to the regulation of whole-body metabolism. Statins decrease both lipoprotein and miR-122 release from the liver48. Information on statin use is unavailable for the human subjects included in our study, which might be a potential confounding factor. In addition, due to the heterogeneities of BC and EVs, CD24 may not be present in all BC-cell-derived EVs. Some degree of heterogeneity was observed within the BC group in fasting glucose and c-peptide levels and miR-122 levels. Possibly due to the small sample size, we did not identify any clinical characteristics that could be potentially associated with this heterogeneity. Further studies are warranted to identify additional tumour or host factors that may explain this variation, to explore strategies targeting EV-mediated effects, and to discover other systemic effects of cancers on endocrine system that controls whole-body energy metabolism and functionality.
Methods
This research complies with all relevant ethical regulations. All animal experiments were approved by the institutional animal care and use committee at the University of California, San Diego; all research with human specimens were approved by the institutional review board committees at UC San Diego Health and City of Hope National Medical Center.
Cells and constructs
Cell lines used in this study were obtained from American Type Culture Collection (Manassas, VA) and cultured in the recommended media or as indicated. These include MDA-MB-231 (HTB-26), MCF-10A (CRL-10317), and normal human mammary epithelial cells (HMECs; PCS-600-010). MCF-10A cells were cultured as described57. MDA-MB-231 cells were cultured in Dulbecco’s Modified Eagle’s medium (Gibco) supplemented with 10% fetal bovine serum (Sigma-Aldrich). HMECs were cultured in Mammary Epithelial Cell Basal Medium (PCS-600-030, ATCC) supplemented with Growth Kit (PCS-600-040, ATCC). Mouse pancreatic β cell line MIN6 were maintained as previously described58. Patient-derived PDX265922 cancer cells (propagated in NSG mice and denoted as PDX) were originally isolated from a triple-negative breast tumour42 and cultured in Iscove’s Modified Dulbecco’s medium (Thermo Fisher Scientific) supplemented with 20% fetal bovine serum.
MCF-10A and PDX cells were engineered to stably overexpress miR-122 (MCF-10A/miR-122 and PDX/miR-122 OE) or the empty pBABE vector as previously described33. MDA-MB-231 and PDX cells with stable knockdown of RAB27A (Rab27a KD) were constructed by lentiviral transduction using the MISSION® shRNA system (Clone ID: NM_004580.3-735s1c1; MilliporeSigma), whereas the empty vector control (SHC001, MilliporeSigma) was used to construct the control lines. To knock out hsa-miR-122 gene using CRISPR-Cas9 genomic editing system, two single guide RNAs (sequences CACACTAAATAGCTACTGCT and CACACTCCACAGCTCTGCTA) predicted by the sgRNA Designer (https://portals.broadinstitute.org/gpp/public/analysis-tools/sgrna-design) were synthesized in DNA form and annealed into double strands, treated with T4 polynucleotide kinase and inserted into the BbsI-digested pSpCas9(BB)-2A-GFP vector59 (48138, Addgene). The two constructs were co-transfected into MDA-MB-231, and GFP+ cells were sorted by FACS 24 h after transfection. The same procedure was used to knock out hsa-miR-122 in PDX cells using two single guide RNAs (sequences CACACTAAATAGCTACTGCT and GAGTTTCCTTAGCAGAGCTG). Monoclones were screened by genotyping PCR and confirmed by Sanger sequencing. MDA-MB-231/Lck-GFP cells were constructed by stable transfection of an Lck-GFP expression plasmid41 (61099, Addgene) into MDA-MB-231 cells followed by selection in G418 and sorting of GFP+ cells by FACS. Construction of the PKM2 expression plasmid was described previously33. The mouse Pkm2 siRNAs (1027415) and scrambled control siRNA were purchased from Qiagen.
To construct AAV, the CMV promoter and eGFP regions in pscAAV-CMV-eGFP plasmid60 (32396, Addgene) were replaced with two fragments containing mouse insulin promoter and mouse PKM2 coding region, respectively. The mouse insulin promoter fragment was derived from plasmid pEMBOL-ds-INS-GFP61. The PKM2 fragment was derived from plasmid pLHCX-Flag-mPKM262 (42512, Addgene) by PCR using primers 5’-AATtcatgaAAGCTTGTTAACGCCACCAT-3’ and 5’- CGCtgtacaCTTTTATTTTATCGATTCAAGG-3’. AAV serotype 8 was used to produce AAV8-mI-mPKM2 to achieve robust transgene expression in β-cells. The resulting construct pscAAV-mouse insulin promoter (mI)-mPKM2 was confirmed by sequencing. The same insulin promoter fragment was used to replace the CMV promoter region of pscAAV-CMV-eGFP to generate the control construct pscAAV-mI-eGFP. Viruses were produced by the Vector Development Core Laboratory at UC San Diego, and titer was determined by PCR. For mouse injection, 5×10¹¹ genome copy resuspended in 100 μl PBS was used.
EV purification and characterization
EVs were purified from conditioned medium (CM) using a protocol similar to previously described33, 43. Briefly, CM was collected from cultured cells grown in serum-free medium containing 1% BSA for 24 h, and pre-cleared by centrifugation at 500 g for 15 min and then at 10,000 g for 20 min. EVs were pelleted by ultracentrifugation at 110,000 g for 70 min, and washed in PBS using the same ultracentrifugation conditions. When indicated, CFSE (5-(and 6)-Carboxyfluorescein diacetate succinimidyl ester of CFDA SE; BioLegend) was added into the PBS at 5 μM and incubated for 1 h at 37 °C before the washing step, followed by an extra round of washing in PBS to remove the excess dye. The EV pellet was suspended in PBS and subjected to various experiments, including nanoparticle tracking analysis (NTA) using a NanoSight NS300 (Malvern Panalytical), iodixanol/OptiPrep density gradient centrifugation43, RNA extraction by TRIZOL LS (Thermo Fisher Scientific), and treatment of cells, islets, and animals. EV treatment with Proteinase K (10 μg/ml) followed by RNase If (40 U) in the presence or absence of 1% Triton X-100 to determine the topology of EV RNA was performed as described63. For cell or islet treatment, 2 μg of EVs (equivalent to those derived from ~5×10⁶ producer cells) based on protein measurement using BCA protein assay kit (Thermo Fisher Scientific) were added to 2×10⁵ recipient cells or 30 islets cultured in 2 ml medium in a 6-well plate. When needed, the EV treatment was done in a 96-well plate with proportionally reduced EVs and cell/islet numbers.
Animals
All mice used in this study were obtained from the Jackson Laboratory. Female NOD/SCID/IL2Rγ-null (NSG) mice of 6–8-week-old were used in all experiments and maintained in the University of California, San Diego Animal Care Program Facility under 12-hour light/12-hour dark cycle (on at 6:00 am/off at 6:00 pm) with temperature of 72 °F ± 2 and 30–70% humidity. The maximal tumour size/burden permitted by the institutional animal care and use committee at the University of California, San Diego is a single mammary tumour reaching 1.5 cm in diameter. This maximal tumour size/burden was never exceeded in our mouse experiments.
For EV treatment, EVs were injected into the tail vein semi-weekly for 5 weeks (~10 μg EVs per injection per mouse). As indicated, some mice were i.p. injected with 2 U/kg insulin (125850124, Thermo Fisher Scientific) or saline after 10 times of EV injections; the liver was collected 15 minutes later to examine insulin signalling by western blotting. For in vivo tracking of GFP-labelled EVs, EVs derived from MDA-MB-231/Lck-GFP were injected into the tail vein for three consecutive days; mice were sacrificed 24 h after the last injection and pancreas were collected for sectioning. Xenograft tumours were established by injecting 2×10⁵ MDA-MB-231- or PDX-derived cells mixed with Matrigel (BD Biosciences) into the No.4 mammary fat pad. Tumour growth was monitored starting from 2 weeks after tumour cell injection, and tumour volume was calculated using the formula (length × width2)/2. For EV rescue experiments, BC cells (MDA-MB-231/Rab27a KD or MDA-MB-231/miR-122 KO) were injected into the mammary fat pad on day 0; indicated EVs were injected into the tail vein semi-weekly for 5 weeks starting from day 3 (~10 μg EVs per injection per mouse). For miR-122 oligonucleotide inhibitor (ONI) treatment, BC cells (MDA-MB-231/control or MDA-MB-231/Rab27a KD) were injected on day 0; miR-122 ONI or mismatch control was i.p. injected at 25 mg/kg body weight first daily for 5 consecutive days starting from day 3 and then semi-weekly for 5 weeks. The oligonucleotide compounds were synthesized by Regulus Therapeutics (San Diego, CA) and constituted in 0.9% sterile saline solution. miR-122 ONI is a fully phosphorothioated mixed chemistry oligonucleotide complimentary to miR-122 and represents the active unconjugated metabolite of RG-101 used in a clinical trial64. The mismatch control is a 23-mer with 6 mismatches. For PKM2 restoration in β-cells, 5×10¹¹ genomic copy of AAV8-mI-mPKM2 virus or control virus were injected through common bile duct. One week after AAV injection and when the wound on abdomen was fully healed, MDA-MB-231 cells were injected into the mammary fat pad to establish xenograft tumours. For insulin supplementation study, tumour cells were injected into the mammary fat pad on day 0; on day 14, mice were subcutaneously implanted with insulin-releasing pellets or palmitic acid micro-crystal control pellets (two for each mouse) by following the manufacturer’s instructions (LinBit, LinShin Canada). SGLT2 inhibitor Canagliflozin (Hy-10451, MedChemExpress) was used to lower the blood glucose level. Canagliflozin was dissolved in 10% DMSO and 90% corn oil (Sigma-Aldrich). Tumour cells were injected into the mammary fat pad on day 0. Starting from day 14, Canagliflozin solution (12 mg/kg body weight) or placebo (solvent) was given by oral gavage once daily for 28 days.
In vivo glucose-stimulated insulin secretion (GSIS) assay
GSIS was assayed in the last week before sacrificing the mice. Briefly, mice were fasted for 8 h from 6 am to 2 pm, and then received i.p. injection of 20% (w/v) glucose at 2 mg per gram of body weight. Blood was collected from tail vein before and at 10 min after glucose injection (the insulin supplementation study also includes another time point at 90 min). Serum was prepared and used to measure insulin level.
IP-GTT, PTT and ITT assays
For i.p. glucose tolerance test (IP-GTT), mice were fasted for 8 h from 6 am to 2 pm, and then received i.p. injection of 20% (w/v) glucose at 2 mg per gram of body weight. Blood glucose level was tested at 0, 15, 30, 45, 60, 90 and 120 min after glucose injection using a blood glucose meter and test strips. For pyruvate tolerance test (PTT), mice were fasted for 18 h from 8 pm of the previous day to 2 pm (for EV-treated mice and controls), or for 8 h from 6 am to 2 pm (for tumour-bearing mice and controls). Then, 25% (w/v) sodium pyruvate solution was i.p. injected at 2.5 mg per gram of body weight. Blood glucose level was tested at 0, 15, 30, 45, 60, 90 and 120 min after pyruvate injection. For insulin tolerance test (ITT), mice were fasted for 8 h from 6 am to 2 pm, and then received i.p. injection of 0.1 U/ml insulin solution (Gibco) at 0.001 U per gram of body weight. Blood glucose level was tested at 0, 15, 30, 45, 60, 90 and 120 min after insulin injection.
Mouse serum preparation and EV purification
To prepare mouse serum, whole blood was collected into serum separator tube (BD Biosciences). After blood coagulation, the tube was centrifuged at 1,200 g for 15 min to separate serum. For EV purification with mouse serum, 100 μl serum was mixed with 900 μl PBS and centrifuged at 10,000 g for 30 min; the supernatant was then mixed with 10 ml PBS before ultracentrifugation at 110,000 g for 70 min to pellet EVs.
RNA extraction, reverse transcription, and quantitative PCR
These procedures were carried out as reported33, 43. Sequences of the primers were obtained from PrimerBank and listed in Supplementary Table 1. For mRNA detection, reverse transcription (RT) was performed using random primers; Ppib (Cyclophilin B) or GAPDH mRNA was used as an internal reference in PCR to calculate the relative level of each mRNA. For miRNA detection, TaqMan® miRNA assays were used, with gene-specific RT primer, TaqMan probe, and PCR primer set for each miRNA. The U6 primer was used as an internal reference for intracellular miRNA levels. As a spike-in reference for EV miRNA levels, 10 fmol of synthetic Arabidopsis thaliana miR159a (ath-miR159a) was added during RNA extraction and measured for data normalization. When indicated, islets were treated with EVs in the presence of 10 μM 5,6-Dichlorobenzimidazole 1-β-D-ribofuranoside (DRB; D1916, MilliporeSigma) or 10 μM dynasore (D7693, MilliporeSigma) before RNA extraction and RT-qPCR. qPCR data were collected and analysed using Bio-Rad CFX Manager software (Bio-Rad, version 3.1).
RNA-seq and gene set enrichment analysis (GSEA)
RNA-seq of mouse liver and small RNA-seq of MDA-MB-231-derived cells and EVs were carried out by the City of Hope Integrative Genomic Core. For RNA-seq, RNA was sonicated and reverse-transcribed into cDNA, followed by end repair, A-tailing, and linker ligation. The ligated material was amplified by PCR and then analysed on a HiSeq2500 (Illumina; San Diego, CA) for parallel sequencing. For small RNA-seq, all small RNAs of 15–52 nts were selected and sequenced using the Hiseq 2500 system following Illumina’s protocol. Raw counts were normalized by trimmed mean of M value method and differentially expressed genes were identified using Bioconductor package edgeR. RNA-seq of EV-treated human pancreatic islets and data analysis were performed by Novogene (Sacramento, CA). RNA libraries were prepared for sequencing using standard Illumina protocols. mRNA was purified from total RNA using poly-T oligo-attached magnetic beads, and was fragmented randomly by addition of fragmentation buffer. Downstream analysis was performed using a combination of programs including STAR, HTseq, Cufflink and Novogene’s wrapped scripts. Alignments were parsed using Tophat program and differential expressions were determined through DESeq2/edgeR. Reference genome and gene model annotation files were downloaded from genome website browser (NCBI/UCSC/Ensembl) directly. Indexes of the reference genome was built using STAR and paired-end clean reads were aligned to the reference genome using STAR (v2.5). STAR used the method of Maximal Mappable Prefix (MMP) which can generate a precise mapping result for junction reads. HTSeq (v0.6.1) was used to count the read numbers mapped of each gene. And then FPKM (Fragments Per Kilobase Million) of each gene was calculated based on the length of the gene and reads count mapped to this gene. For GSEA, FPKM (Fragments Per Kilobase Million) were uploaded to GSEA 3.0 and enrichment of C2 curated gene sets or Hallmark gene sets was interrogated with 1,000 random permutations to obtain the normalized enrichment score (NES), P value, and q value.
Glycogen staining and measurement
Glycogen staining was performed using a Periodic acid-Schiff kit (MilliporeSigma) with mouse liver sections from formalin-fixed paraffin-embedded blocks. Images were taken using a BZ-X700 microscope (Keyence) and BZ-X viewer software (Keyence, version 1.0.0). The procedure to quantify glycogen in frozen liver tissue was modified from phenol-sulfuric acid colour reaction. Briefly, 1.5 ml 30% (w/v) KOH (saturated with Na2SO4) was added to ~20 mg frozen liver tissue before placed in a boiling water bath for 20 min. After cooling on ice, 1.8 ml 95% ethanol was added to precipitate glycogen by incubation on ice for 30 min. The glycogen pellet was collected by centrifugation at 900 g for 25 min and dissolved in 3 ml deionized water. For the subsequent phenol-sulfuric acid colour reaction, 50 μl sample solution was mixed with 150 μl 98% H2SO4 and then with 30 μl 5% (w/v) phenol, and incubated at 90 °C for 5 min. Absorbance at 490 nm was measured at room temperature, and glycogen content was calculated using a standard curve and normalized to the starting weight of liver tissue (μg/mg).
Western blot analysis
Protein extracts were separated by electrophoresis on a 10% or 12% SDS polyacrylamide gel. All antibodies used in this study are listed in Supplementary Table 2. Proteins detected by re-probing on the same blot are indicated in source data; otherwise, proteins are detected on blots from parallel gels. Loading controls are indicated in the source data. Unprocessed original scans of immunoblots are available in source data.
Triglyceride measurement
Triglyceride levels were measured using ~50 mg liver tissue using a Triglyceride Colorimetric Assay Kit (Cayman Chemical; Ann Arbor, MI; Cat# 10010303) following manufacturer’s protocol. Triglyceride content was normalized to the starting weight of liver tissue (μg/mg).
Immunohistochemistry (IHC) and immunofluorescence (IF)
Mouse pancreas was fixed in 10% neutral buffered formalin and embedded in paraffin for sectioning. IHC and IF were performed as previously described33. Antibodies used are listed in Supplementary Table 2.. Some slides, as indicated, also included nuclear staining by DAPI (4’, 6-diamidino-2-phenylindole). Ki67 IHC was used to calculate Ki67+ cells against total cell number from >4 views in each mouse. Co-IF of PDX1 and insulin was used to calculate the frequency of PDX1+ cells among insulin+ cells from 3–5 representative islets for each mouse. Co-IF of cleaved caspase-3 (Asp175) and insulin was used to calculate the frequency of apoptotic cells among insulin+ cells from 3–5 representative islets for each mouse. H&E staining was conducted by following the manufacturer’s instructions (ab245880, Abcam). Images were taken using a BZ-X700 microscope (Keyence) and BZ-X viewer software (Keyence, version 1.0.0). Islet area was measured using ImageJ and average islet area was calculated from more than 8 representative islets for each mouse.
ELISA assays
ELISA assays were used to measure mouse insulin (90080, Crystal Chem), c-peptide (90050, Crystal Chem), glucagon (81518, Crystal Chem), GLP-1 (81508, Crystal Chem), or ghrelin (EIAM-GHR-1, RayBiotech) in mouse-derived samples. Human insulin (90095, Crystal Chem) and c-peptide (80954, Crystal Chem) ELISA kits were used for human serum samples.
Pyruvate kinase activity measurement
Pyruvate kinase (PK) activity was measured in MIN6 cells and pancreatic islets using a Pyruvate Kinase Activity Colorimetric/Fluorometric Assay Kit (K709, BioVision). One unit was set as the amount of enzyme that could transfer a phosphate group from phosphoenolpyruvate (PEP) to adenosine diphosphate (ADP), yielding 1.0 μmol of pyruvate per minute at 25 °C. The level of PK activity was normalized to the protein content of samples.
ATP measurement
For measurement of ATP concentrations, 20 pancreatic islets were pre-incubated in Krebs-Ringer bicarbonate buffer (KRBB) supplemented with 0.25% BSA and 3.3 mM glucose for 2 h, and then incubated under 3.3 mM or 16.7 mM glucose for 1 h prior to measurement using an ATP Assay Kit (MAK190, MilliporeSigma) following the manufacturer’s protocol. Total protein content was used to normalize the ATP concentration. For measurement of ATP/ADP ratio, MIN6 cells were pre-incubated in KRBB supplemented with 0.25% BSA for 2 h, and then incubated under 3.3 mM or 16.7 mM glucose for 1 hour prior to measurement with an ADP/ATP Ratio Assay Kit (MAK135, MilliporeSigma) following the manufacturer’s instructions.
Cytosolic Ca2+ measurement
For intracellular Ca2+ assay, MIN6 cells or single cells dissociated from 50 mouse islets were washed and incubated in KRBB supplemented with 0.25% BSA and with (for islets) or without (for MIN6) 3.3 mM glucose for 1 h, before 1 μM Fura-2 AM (Thermo Fisher Scientific) was added for another incubation of 1 h in dark to load Fura-2 AM into cells. Fluorescence at 340 nm and 380 nm was recorded at an interval of 1 min prior to and after addition of glucose to reach a 3.3 mM or 16.7 mM final concentration as indicated. The relative intracellular Ca2+ level was reflected by the ratio of readings at 340 nm vs. 380 nm.
Oxygen consumption rate measurement
Fifty mouse islets were pre-incubated in KRBB supplemented with 0.25% BSA and 3.3 mM glucose for 2 h before switching to 16.7 mM glucose. Oxygen consumption was measured using a phosphorescent oxygen probe from Oxygen Consumption Rate Assay Kit (600800, Cayman Chemical). The fluorescence intensity at Ex 380 nm/Em 650 nm was recorded at an interval of 2 min at 37 °C.
In vitro GSIS assay
MIN6 cells or islets were pre-incubated in KRBB supplemented with 0.25% BSA (for MIN6) or with 0.25% BSA + 3.3 mM glucose (for islets) for 2 h, and then incubated under 3.3 mM or 16.7 mM glucose for 1 h before measurement of insulin level in the cell-free supernatant. The insulin secretion rate was normalized to protein content (for MIN6) or total insulin content in islet cells (for islets). For insulin secretion stimulated by monomethyl succinate (MMS), MIN6 cells were incubated with 20 mM MMS instead of glucose for 1 h prior to measurement of insulin. For insulin secretion stimulated by Exendin-4, mouse islets were incubated in 16.7 mM glucose + 100 nM Exendin-4 for 1 h prior to measurement of insulin.
Flow cytometry assay
Mouse islets incubated with CFSE-labelled EVs for 18 h were pelleted by centrifugation, dissociated into single cells by trypsin, and stained with anti-mouse insulin-Alexa Fluor 647 antibody to label β-cells. Samples were acquired with a BD FACSCanto™ II cytometer (BD Biosciences) and analysed with FACSDiva software (BD Biosciences, version 8.0.1).
Cell proliferation and migration assays
Cell proliferation was assessed by counting cell numbers every 24 h after seeding 100,000 cells per well in 12-well plates, or by using an MTS assay kit (ab197010, Abcam). For cell proliferation assessment under different glucose concentrations, cells were pre-cultured in 5.0 mM glucose for 48 h before seeding into 12-well plates at 50,000 cells per well. For wound closure migration assay, cells were pre-cultured in 5.0 mM glucose for 48 h before seeding into 6-well plates at 1,500,000 cells per well. Fully confluent monolayer was scratched by using standard 200 μl pipette tip, and scratches were recorded under a microscope every 24 h. For proliferation and migration assays under different glucose or insulin concentrations, medium was replaced every 24 h with fresh medium containing indicated glucose/insulin concentrations.
Human islets
Human islets were purified by Prodo Laboratories from a donor who was a 47 years old female without diabetes. Donor’s HbA1c level was 5.7% and the BMI was 23.51. Human islets were cultured immediately upon receipt in RPMI 1640 medium (Gibco) supplemented with 10% FBS for at least 24 h before experiments.
Human serum specimens
Archived samples from cancer patients and controls used in this study were collected in accordance with the Declaration of Helsinki and the principles of Good Clinical Practice. All participants provided written informed consent. Archived fasting serum samples were collected from female BC patients and female control subjects without cancer, who had never been diagnosed with diabetes and had a BMI <35 kg/m2. The 26 BC patient samples (mean age 56.31 ± 10.45 SD) were from UC San Diego Health and City of Hope, and were from patients who had tumours of all subtypes. The archival control samples were collected during another study of generally healthy San Diego County residents65. The initial group of 30 non-cancer controls (mean age 55.78 ± 10.56 SD) were derived from a subset of 602 individuals randomly selected to match the BC patient characteristics of age, BMI, and ethnicity/race. The additional group of 20 non-cancer controls (HG; mean age 67.26 ± 8.48 SD) was selected to match the mean fasting glucose levels detected in the BC patients. Clinical characteristics are summarized in Supplementary Table 3. Glucose concentration in serum was measured using a blood glucose meter and test strips. The following equations were used to calculate HOMA-%B and HOMA-IR for β-cell function and IR, respectively: HOMA-%B = (20 × FSI)/(FSG − 3.5), HOMA-IR = (FSI × FSG)/22.5, where FSI is fasting serum insulin concentration (mU/l) and FSG is fasting serum glucose (mmol/l). For assessment of total circulating EVs (CD9/CD63/CD81+), 500 μl of serum was subjected to EV enrichment using an EasySep™ Human Pan-Extracellular Vesicle Positive Selection Kit (Stemcell Technologies; BC, Canada) following manufacturer’s instructions. For enrichment of CD24+ circulating EVs, human CD24 antibody was conjugated to the superparamagnetic Dynabeads™ using Dynabeads Antibody Coupling Kit (14311D, Thermo Fisher Scientific). Human serum (400 μl) was mixed with 1.5 ml PBS and centrifuged at 12,000 g, 4 °C for 30 min. The supernatant was mixed with 10 mg beads pre-coated with 25 μg CD24 antibody and rotated at 37 °C for 4 h, before the beads were washed three times in PBS containing 0.1% BSA. Trizol LS was used to extract total EV RNA after 10 fmol of synthetic ath-miR159a was spiked in. The RNA pellet was dissolved in 13 μl RNase-free water and subjected to RT-qPCR with ath-miR159a served as a normalization reference. For treatment of human islets with human serum-derived EVs, 250 μl serum from 10 BC patients or 10 non-cancer controls were used for EV purification using ExoQuick ULTRA EV Isolation Kit (EQULTRA-20A-1, System Biosciences) following manufacturer’s instructions. About 400 μl solution containing purified EVs was recovered from each subject and used to treat human islets (cultured in 6-well plates with 2.6 ml culture medium) twice in 48 h followed by ATP measurement and insulin secretion assay under 3 mM or 20 mM glucose stimulation.
Electron microscopy (EM)
EVs eluted from CD24 antibody-conjugated beads were subjected to negative staining EM. Formvar-carbon-coated copper grids (100 mesh, Electron Microscopy Sciences, Hatfield, PA) were placed on 20 μL drops of each sample solution displayed on a Parafilm sheet. After allowing material to adhere to the grids for 10 min, grids were washed 3 times by rising through 200 μL drops of milli-Q water before being left for 1 min on 2% (wt/vol) uranyl acetate (Ladd Research Industries, Williston, VT). Excess solution was removed with Whatman 3MM blotting paper, and grids were left to dry for a few minutes before viewing. Grids were examined using a JEOL JEM-1400Plus transmission electron microscope operating at 80 kV. Images were recorded using a Gatan OneView 4K digital camera.
Statistics and reproducibility
All quantitative data are presented as mean ± standard error of mean (SEM) unless otherwise stated. Prism (GraphPad Software, version 7.01) was used for data analysis and statistics. Two-tailed Student’s t-tests were used for comparison of means of data between two groups. For multiple independent groups, one-way or two-way ANOVA with Bonferroni’s or Tukey’s tests were used except for Fig. 8a–g, where Holm-Šídák test following one-way ANOVA was used to compare among the three groups of human subjects. The correlations between EV-associated miR-122 and insulin, c-peptide or glucose levels were evaluated by Kendall rank correlation analyses. Values of P<0.05 were considered significant. Sample size was generally chosen based on preliminary data indicating the variance within each group and the differences between groups. Except for RNA-seq, all experiments were performed at least twice independently with similar results. No samples or animals were excluded from the analysis. All mice/samples were randomized before experiments. Data collection and analysis were performed blinded to group allocation.
Data availability
RNA-seq data that support the findings of this study have been deposited in the Gene Expression Omnibus (GEO) under accession codes GSE152391, GSE173408, and GSE173276. All other data supporting the findings of this study are available from the corresponding author on reasonable request.
Extended Data
Extended Data Fig. 1. Additional assessments of the EV injection model in Figure 1.
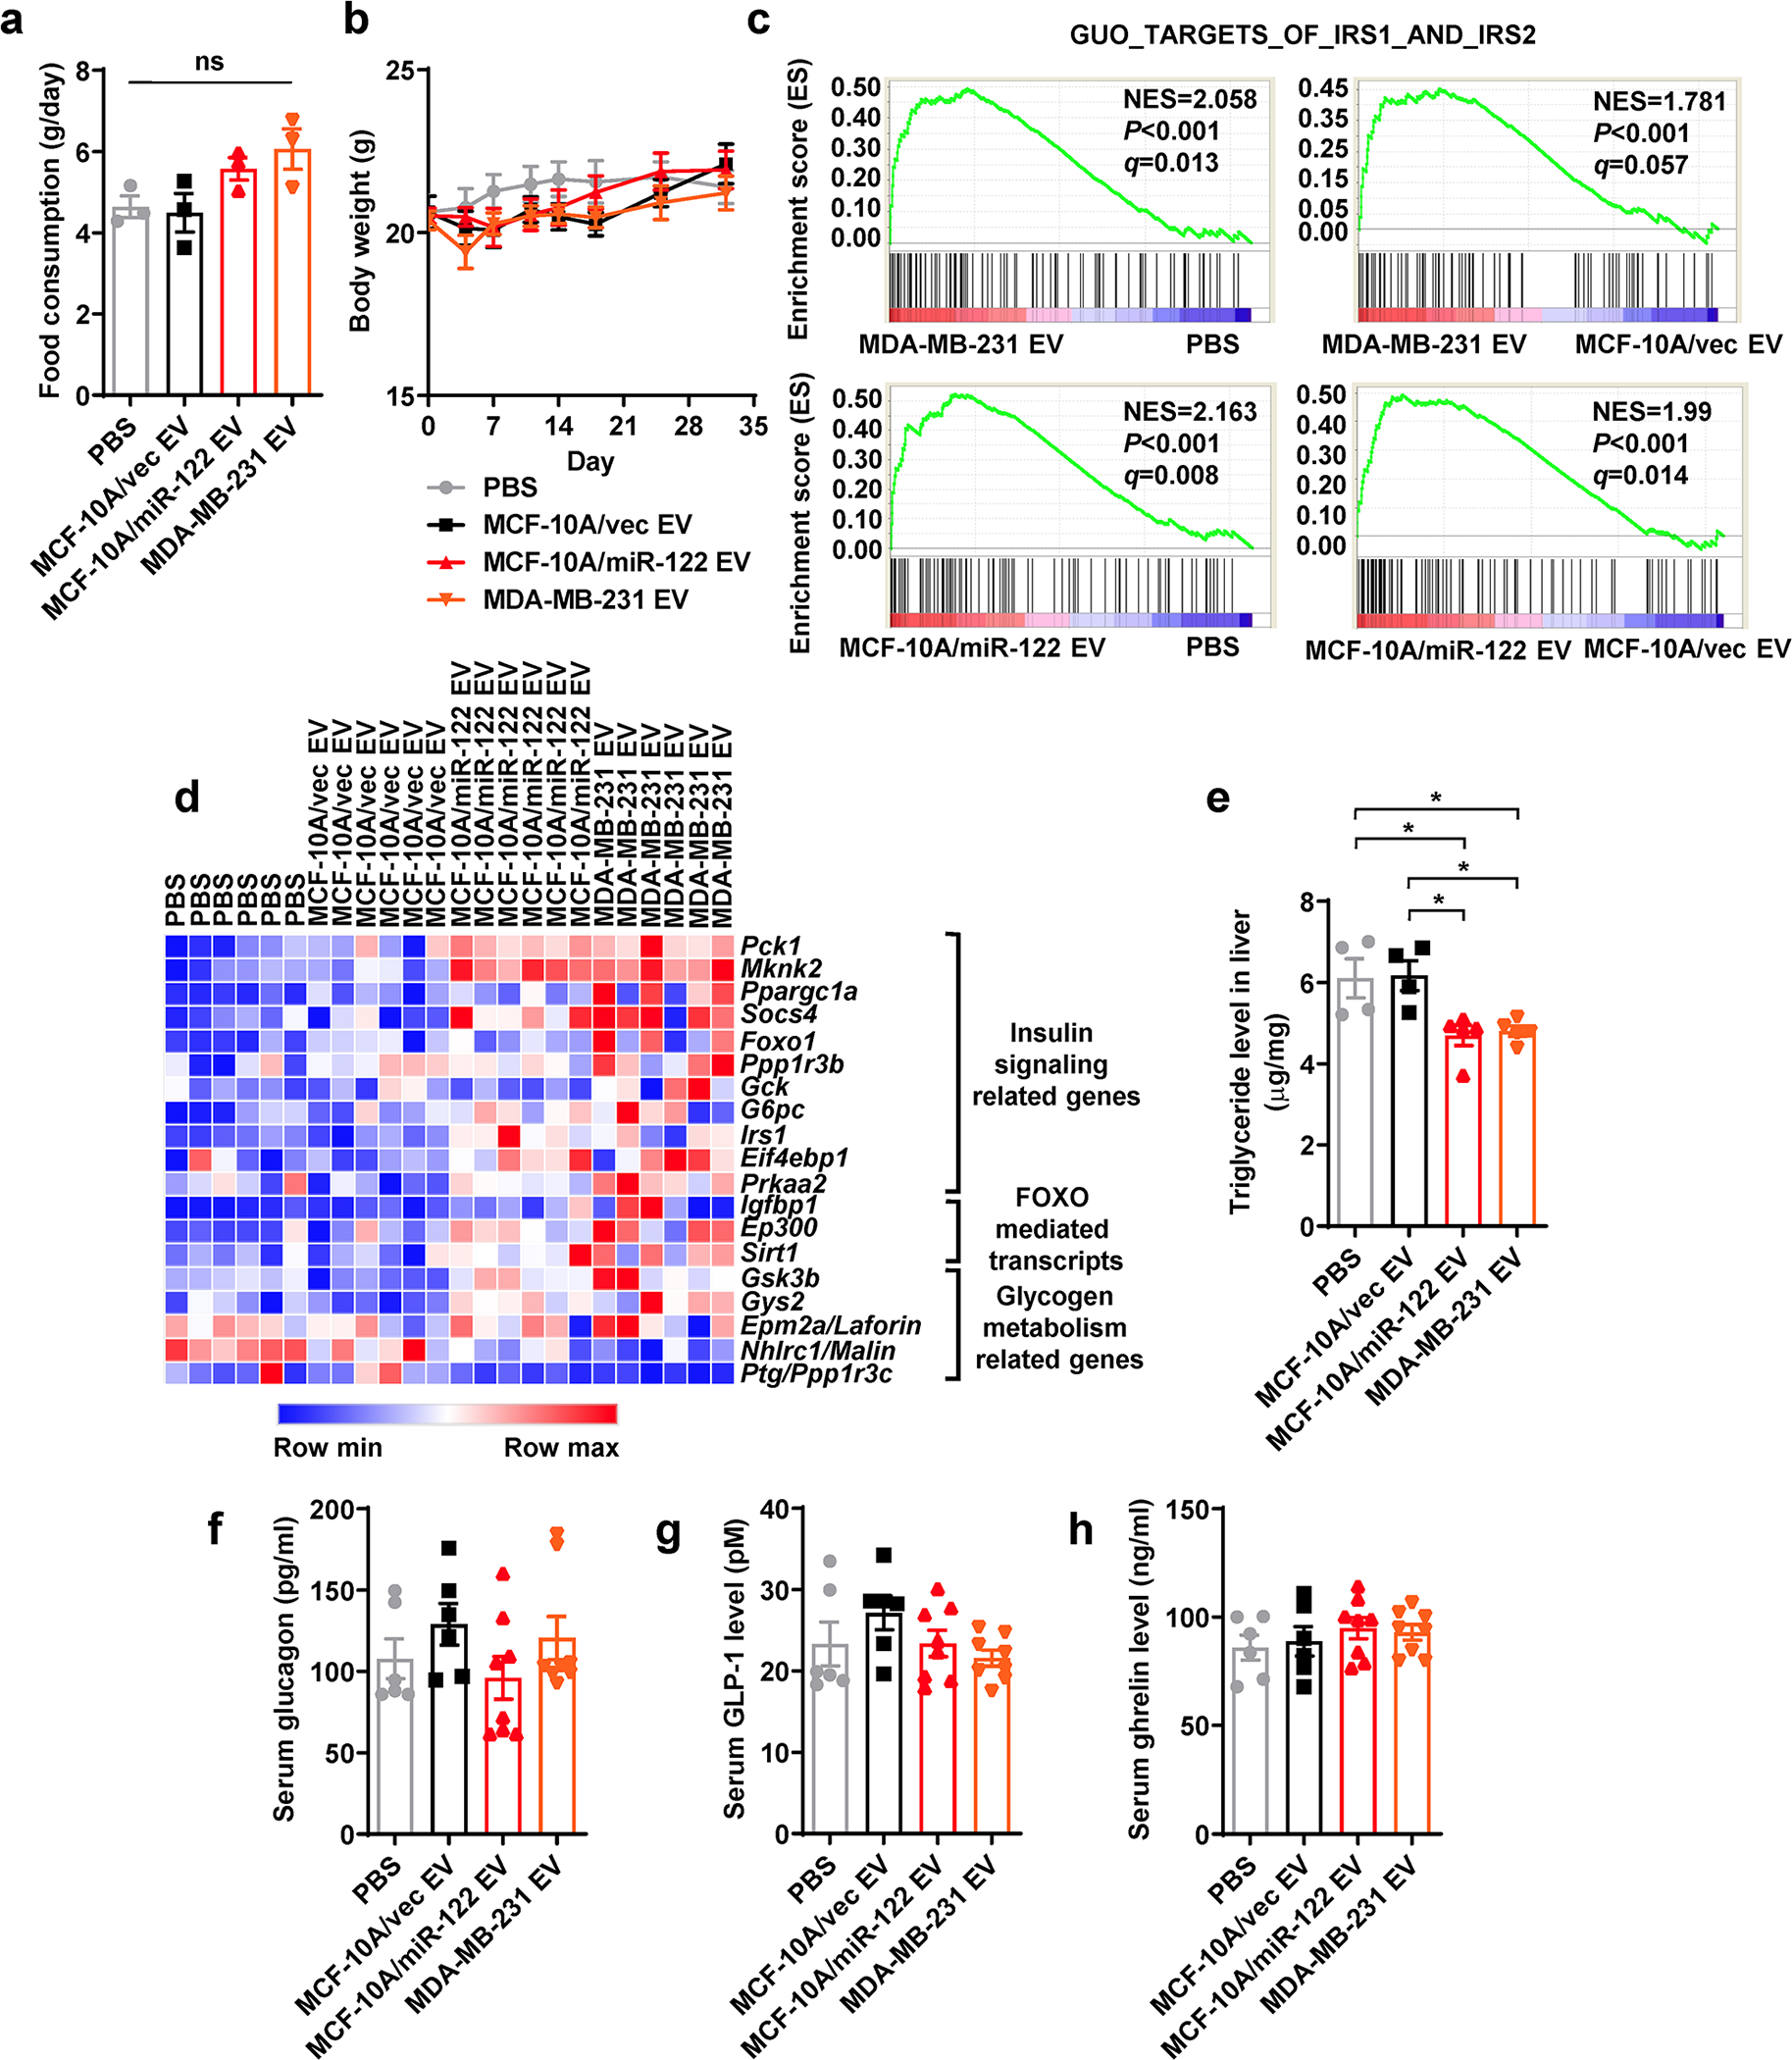
a, Food consumption was calculated by total food consumed in 48 h after the 8th EV/PBS injection (n=3 mice per group). b, Body weight was monitored (n=8 mice for MDA-MB-231 EV and n=7 mice for other groups). c, Liver tissues collected at ZT10 from mice that had received 5 weeks of EV/PBS injections were subjected to RNA-seq and GSEA, showing enrichment of genes related to IRS1/2 signalling (n=6 mice per group). d, Heatmap showing the relative levels of selected genes based on the RNA-seq data. e, Triglyceride levels measured in the liver (n=4 mice for PBS and MCF-10A/vec EV group and n=5 for other groups). f-h, Mouse serum glucagon (f), GLP-1 (g), and ghrelin (h) levels were determined by ELISA kits (n=6 mice for PBS and MCF-10A/vec EV group and n=8 for other groups). Data are shown as mean ± SEM. One-way ANOVA followed by Tukey’s multiple comparison test was used for a, e-h. Two-way ANOVA followed by Tukey’s multiple comparison test was used for b. ns: not significant. *P<0.05. Numerical source data and statistics are available online.
Extended Data Fig. 2. Characterization of BC-cell-secreted EVs.
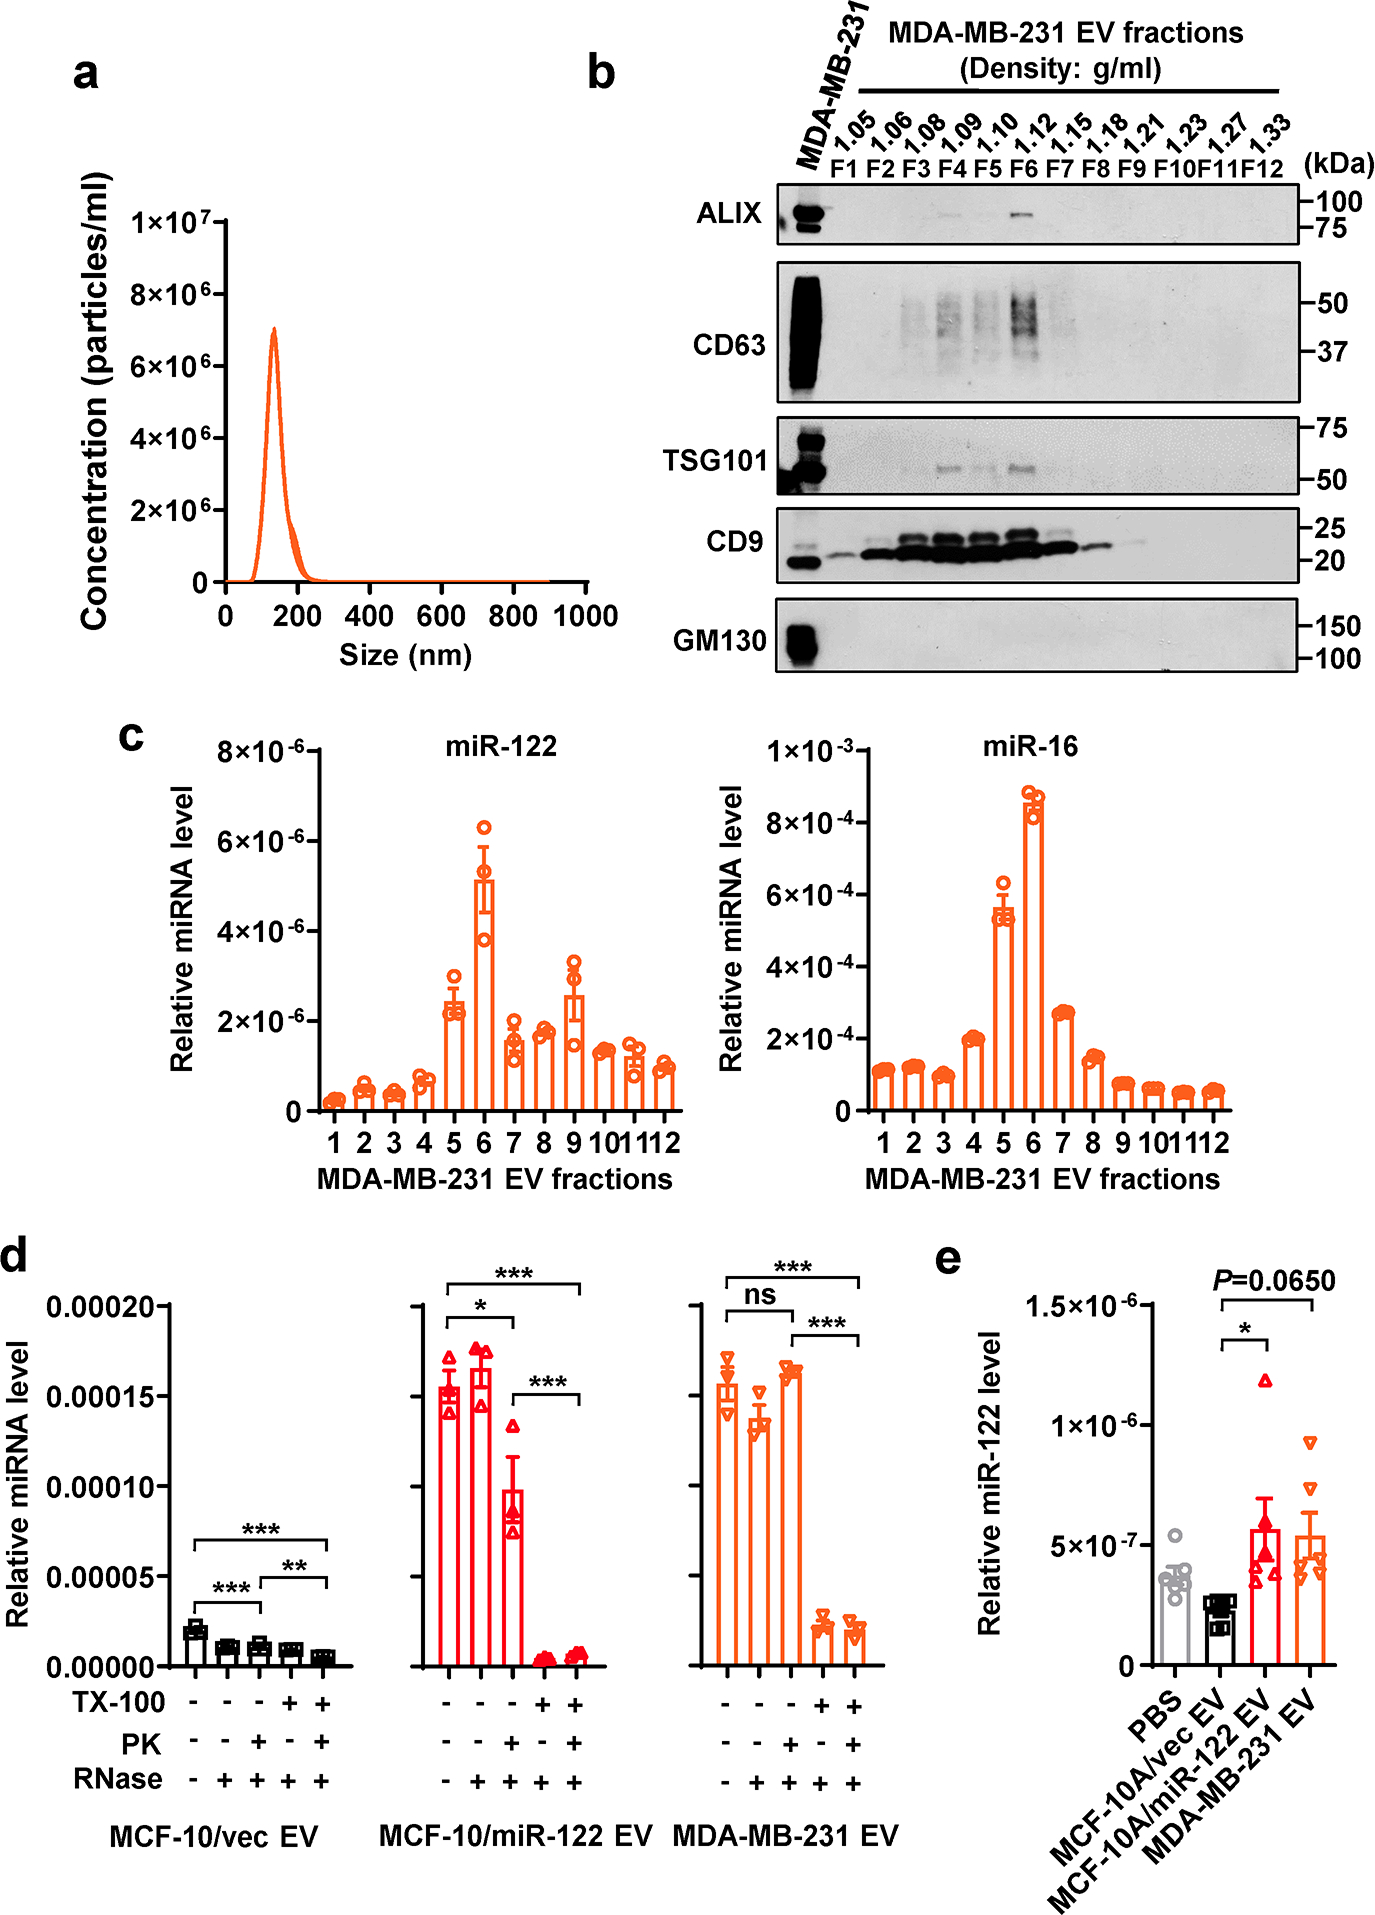
a, NTA of MDA-MB-231 EVs (n=3 replicates). b, Immunoblots of indicated proteins in MDA-MB-231 whole cell lysate and EV fractions from OptiPrep gradient ultracentrifugation showing EV markers and a Golgi marker (GM130, as a negative control for EV-specific proteins). c, RT-qPCR-determined miR-122 (left) and miR-16 (right) levels in OptiPrep gradient fractions of MDA-MB-231 EVs (n=3 replicates; normalized to an ath-miR159a spike-in control). d, miR-122 levels in EVs treated with Proteinase K (PK, 10 μg/mL) followed by RNase If (RNase, 40 U) or with PBS (as control) in the presence or absence of 1% Triton X-100 (TX-100) (n=3 replicates). RT-qPCR data were normalized to an ath-miR159a spike-in control added after all treatments. e, RT-qPCR showing relative miR-122 levels (normalized to spike-in control) in EVs isolated from the sera of mice in Figure 1 (n=6 mice per group). Data are shown as mean ± SEM. One-way ANOVA followed by Tukey’s multiple comparison test was used for d and e. ns: not significant. *P<0.05, **P<0.01, ***P<0.001. Numerical source data, statistics and unprocessed blots are available online.
Extended Data Fig. 3. Functional assessments of EVs and PKM2 in MIN6 β-cells.
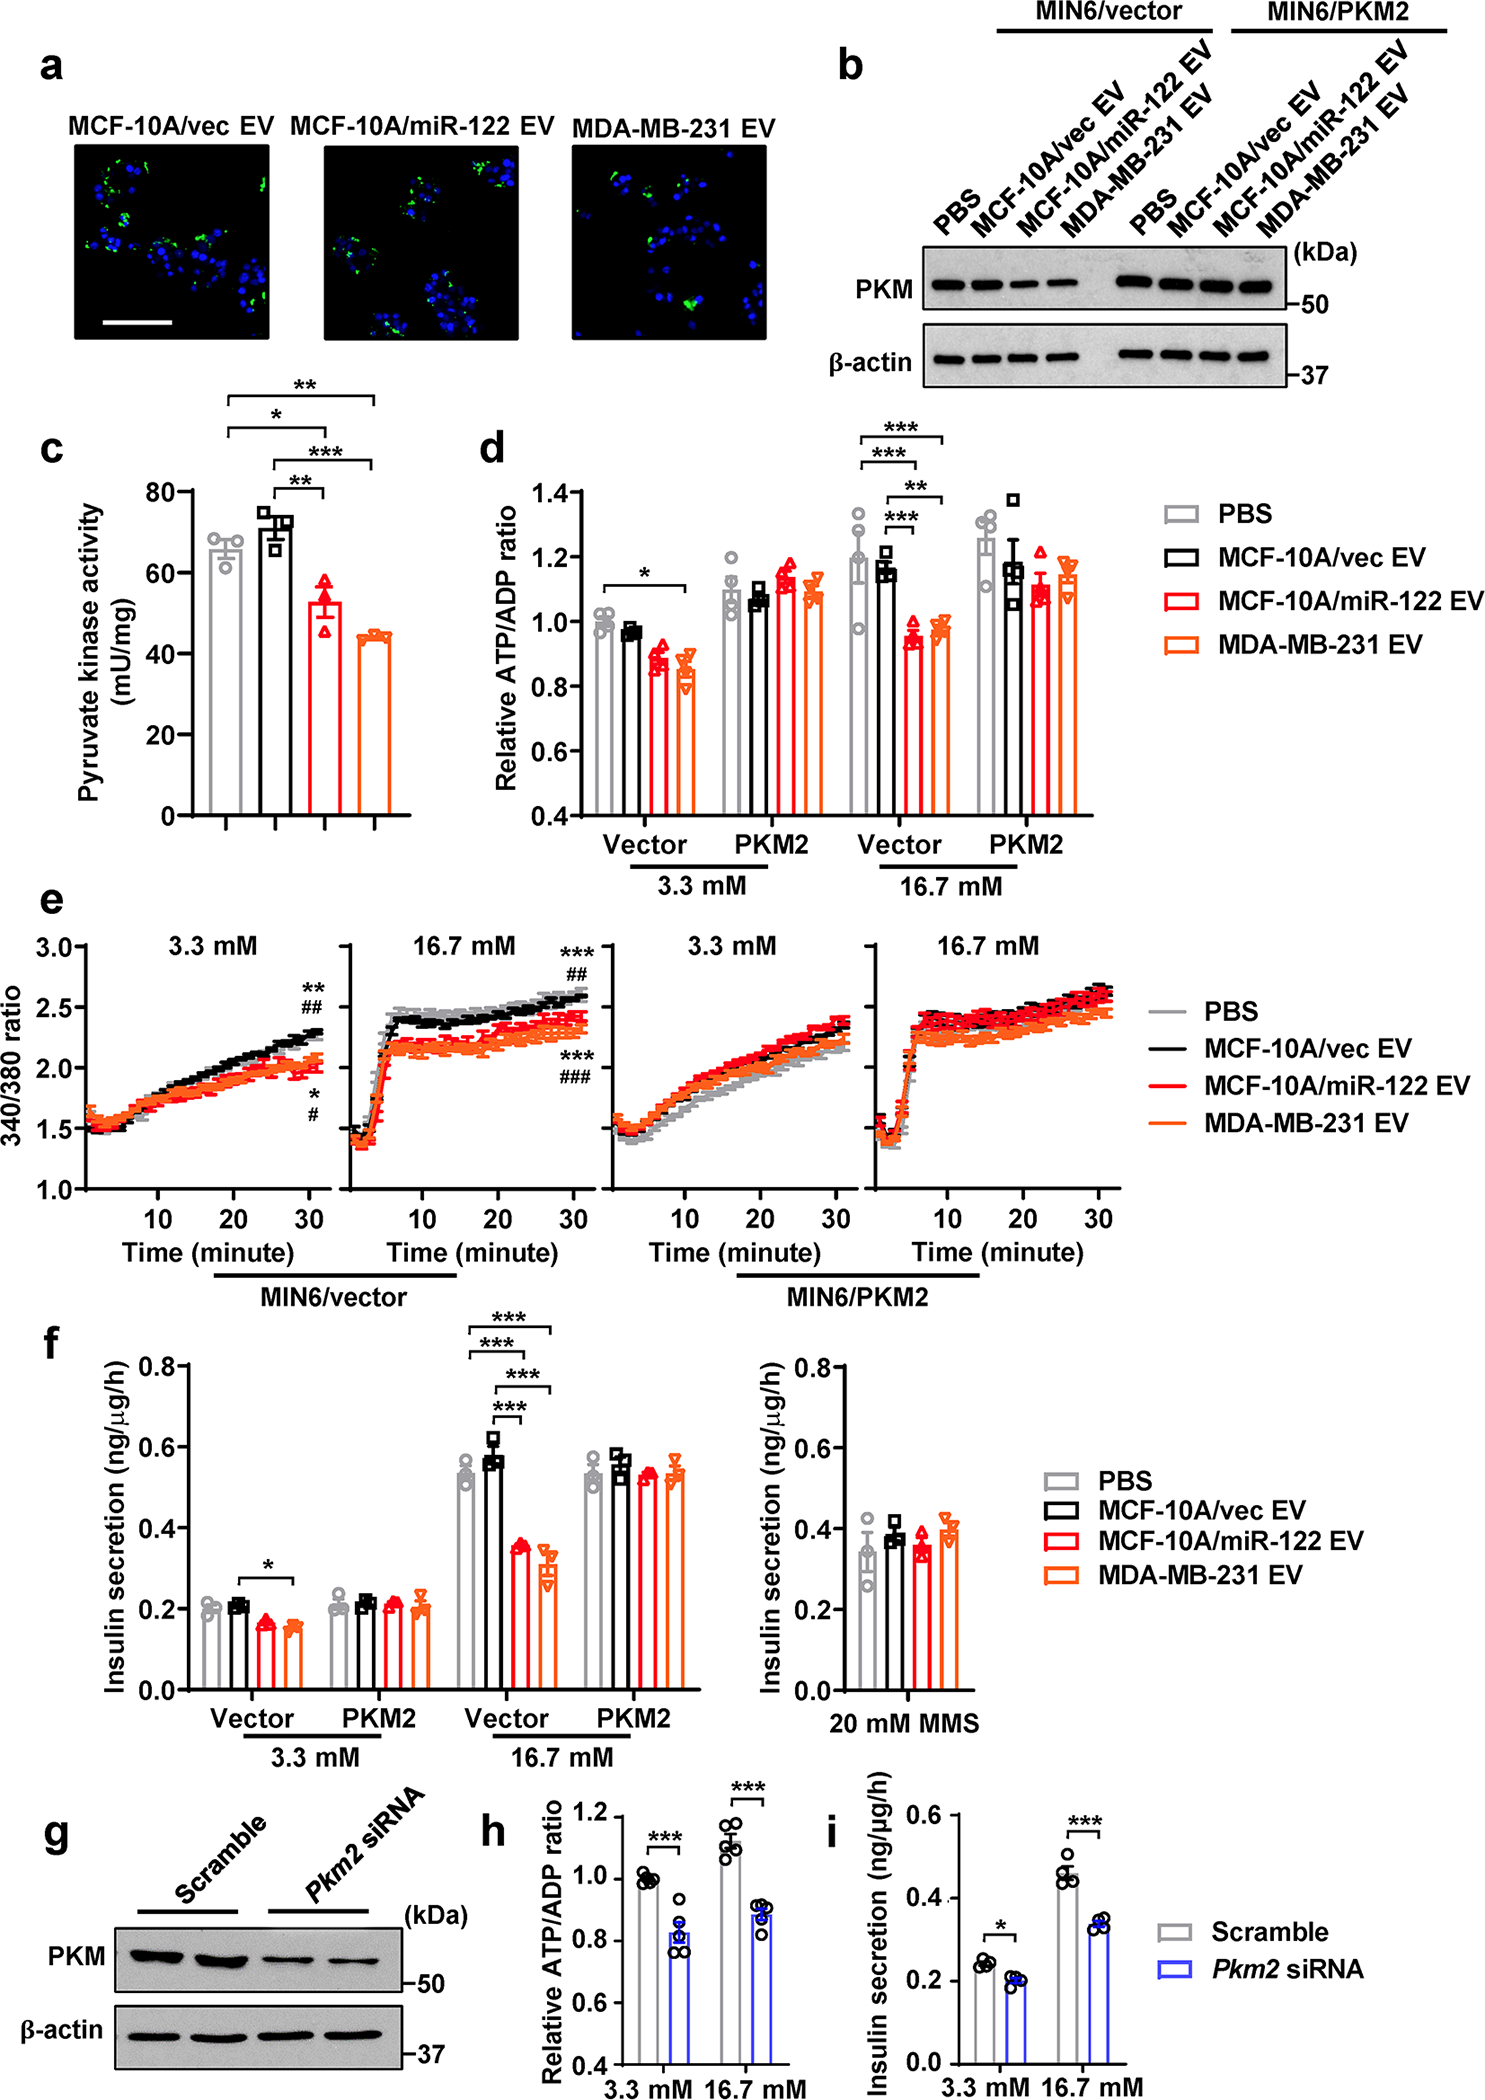
a, Uptake of CFSE-labelled EVs by MIN6 cells (CFSE, green; DAPI, blue). Bar=50 μm. b, Immunoblots of MIN6 cells after EV/PBS treatment for 48 h. When indicated, MIN6 cells were pre-transfected with a PKM2 cDNA expression plasmid or empty vector. c, Pyruvate kinase activity in MIN6 cells (n=3 replicates). d, Relative ATP/ADP ratio in MIN6 cells (n=4 replicates) after low glucose (3.3 mM) or high glucose (16.7 mM) stimulation. Data were normalized to the first bar. e, Changes of the intracellular Ca2+ levels measured by Fura-2/AM in MIN6 cells after low or high glucose stimulation (n=6 replicates). f, Insulin secretion by EV/PBS-treated MIN6 cells (n=3 replicates) under 3.3 mM glucose, 16.7 mM glucose, or 20 mM monomethyl succinate (MMS). g, Immunoblots of MIN6 cells transfected with siRNA against Pkm2 (scrambled siRNA served as a negative control). h,i, Relative ATP/ADP ratio (h; n=6 replicates) and insulin secretion (i; n=4 replicates) in siRNA-transfected MIN6 cells after low glucose (3.3 mM) or high glucose (16.7 mM) stimulation. For all bar and line graphs, values are shown as mean ± SEM. One-way ANOVA followed by Tukey’s multiple comparison test was used for c and right panel of f. Two-way ANOVA with repeated measures followed by Tukey’s multiple comparison test was used for e. Two-way ANOVA followed by Tukey’s multiple comparison test was used for d and left panel of f, or by Bonferroni’s multiple comparison test used for h and i. *P<0.05, **P<0.01, ***P<0.001 compared to PBS or as indicated; #P<0.05, ##P<0.01, ###P<0.001 compared to MCF-10A/vec EV. In e, the upper set of signs indicate MCF-10A/miR-122 EV vs. PBS or MCF-10A/vec EV, and the lower set indicate MDA-MB-231 EV vs. PBS or MCF-10A/vec EV. Numerical source data, statistics and unprocessed blots are available online.
Extended Data Fig. 4. Characterization of MDA-MB-231-derived cells.
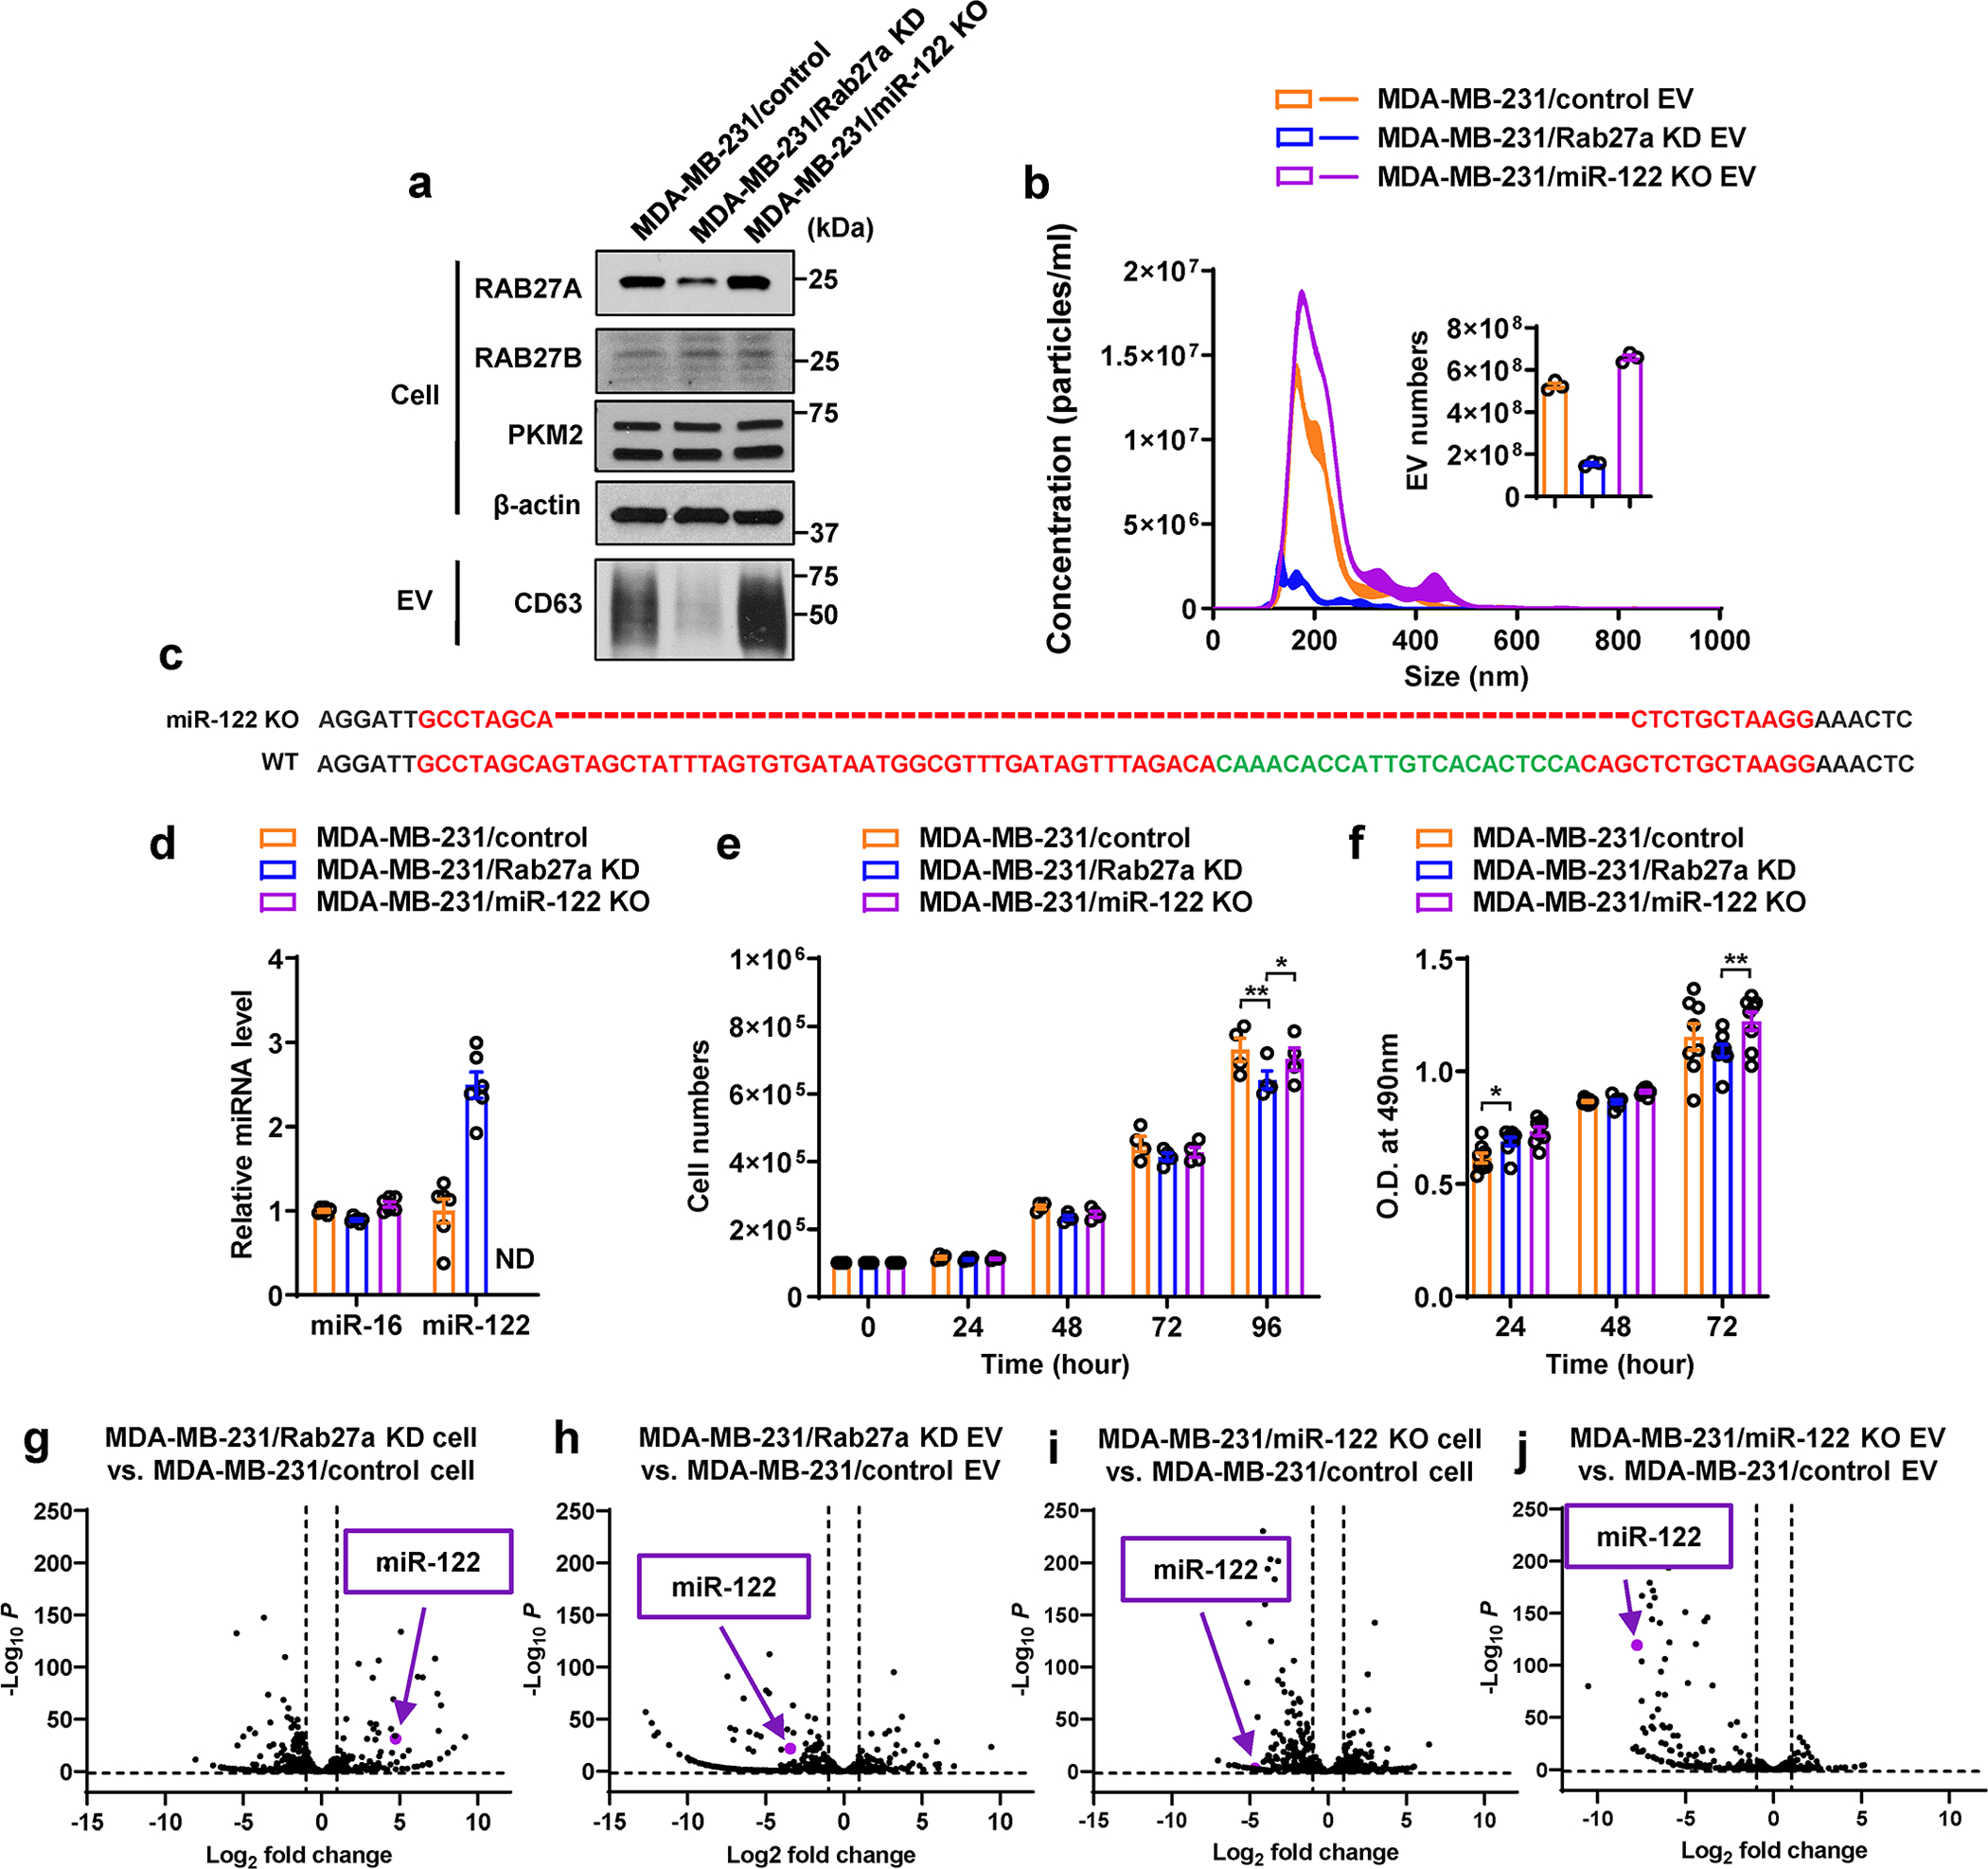
a, Immunoblots showing protein levels in indicated MDA-MB-231-derived cells and their EVs. EVs secreted from equal number of cells were loaded. b, NTA of EVs from indicated cells (n=3 replicates). The inserted graph shows the numbers of EVs secreted in 24 hours per 107 cells (n=3 replicates). c, Sanger sequencing showing genetic knockout of hsa-mir-122 gene in MDA-MB-231/miR-122 KO cells. Dashes indicate the region deleted by the CRISPR-Cas9 genome editing system. d, RT-qPCR-determined miR-122 and miR-16 levels (normalized to U6 snRNA) in indicated MDA-MB-231-derived cells (n=6 replicates). e, Cell proliferation indicated by cell numbers counted every 24 hours (n=4 replicates). f, Cell proliferation indicated by MTS assay. Optical density (O.D.) at 490 nm was shown (n=8 replicates). g-j, Volcano plots showing differentially expressed miRNAs in indicated cells and EVs based on small RNA-seq data (n=2 replicates). The position of miR-122 was noted in each plot. Data in bar and line graphs are shown as mean ± SEM. Two-way ANOVA followed by Tukey’s multiple comparison test was used for e and f. *P<0.05, **P<0.01. Numerical source data, statistics and unprocessed blots are available online.
Extended Data Fig. 5. Additional assessments of the MDA-MB-231-derived tumour model in Figure 3a–n.
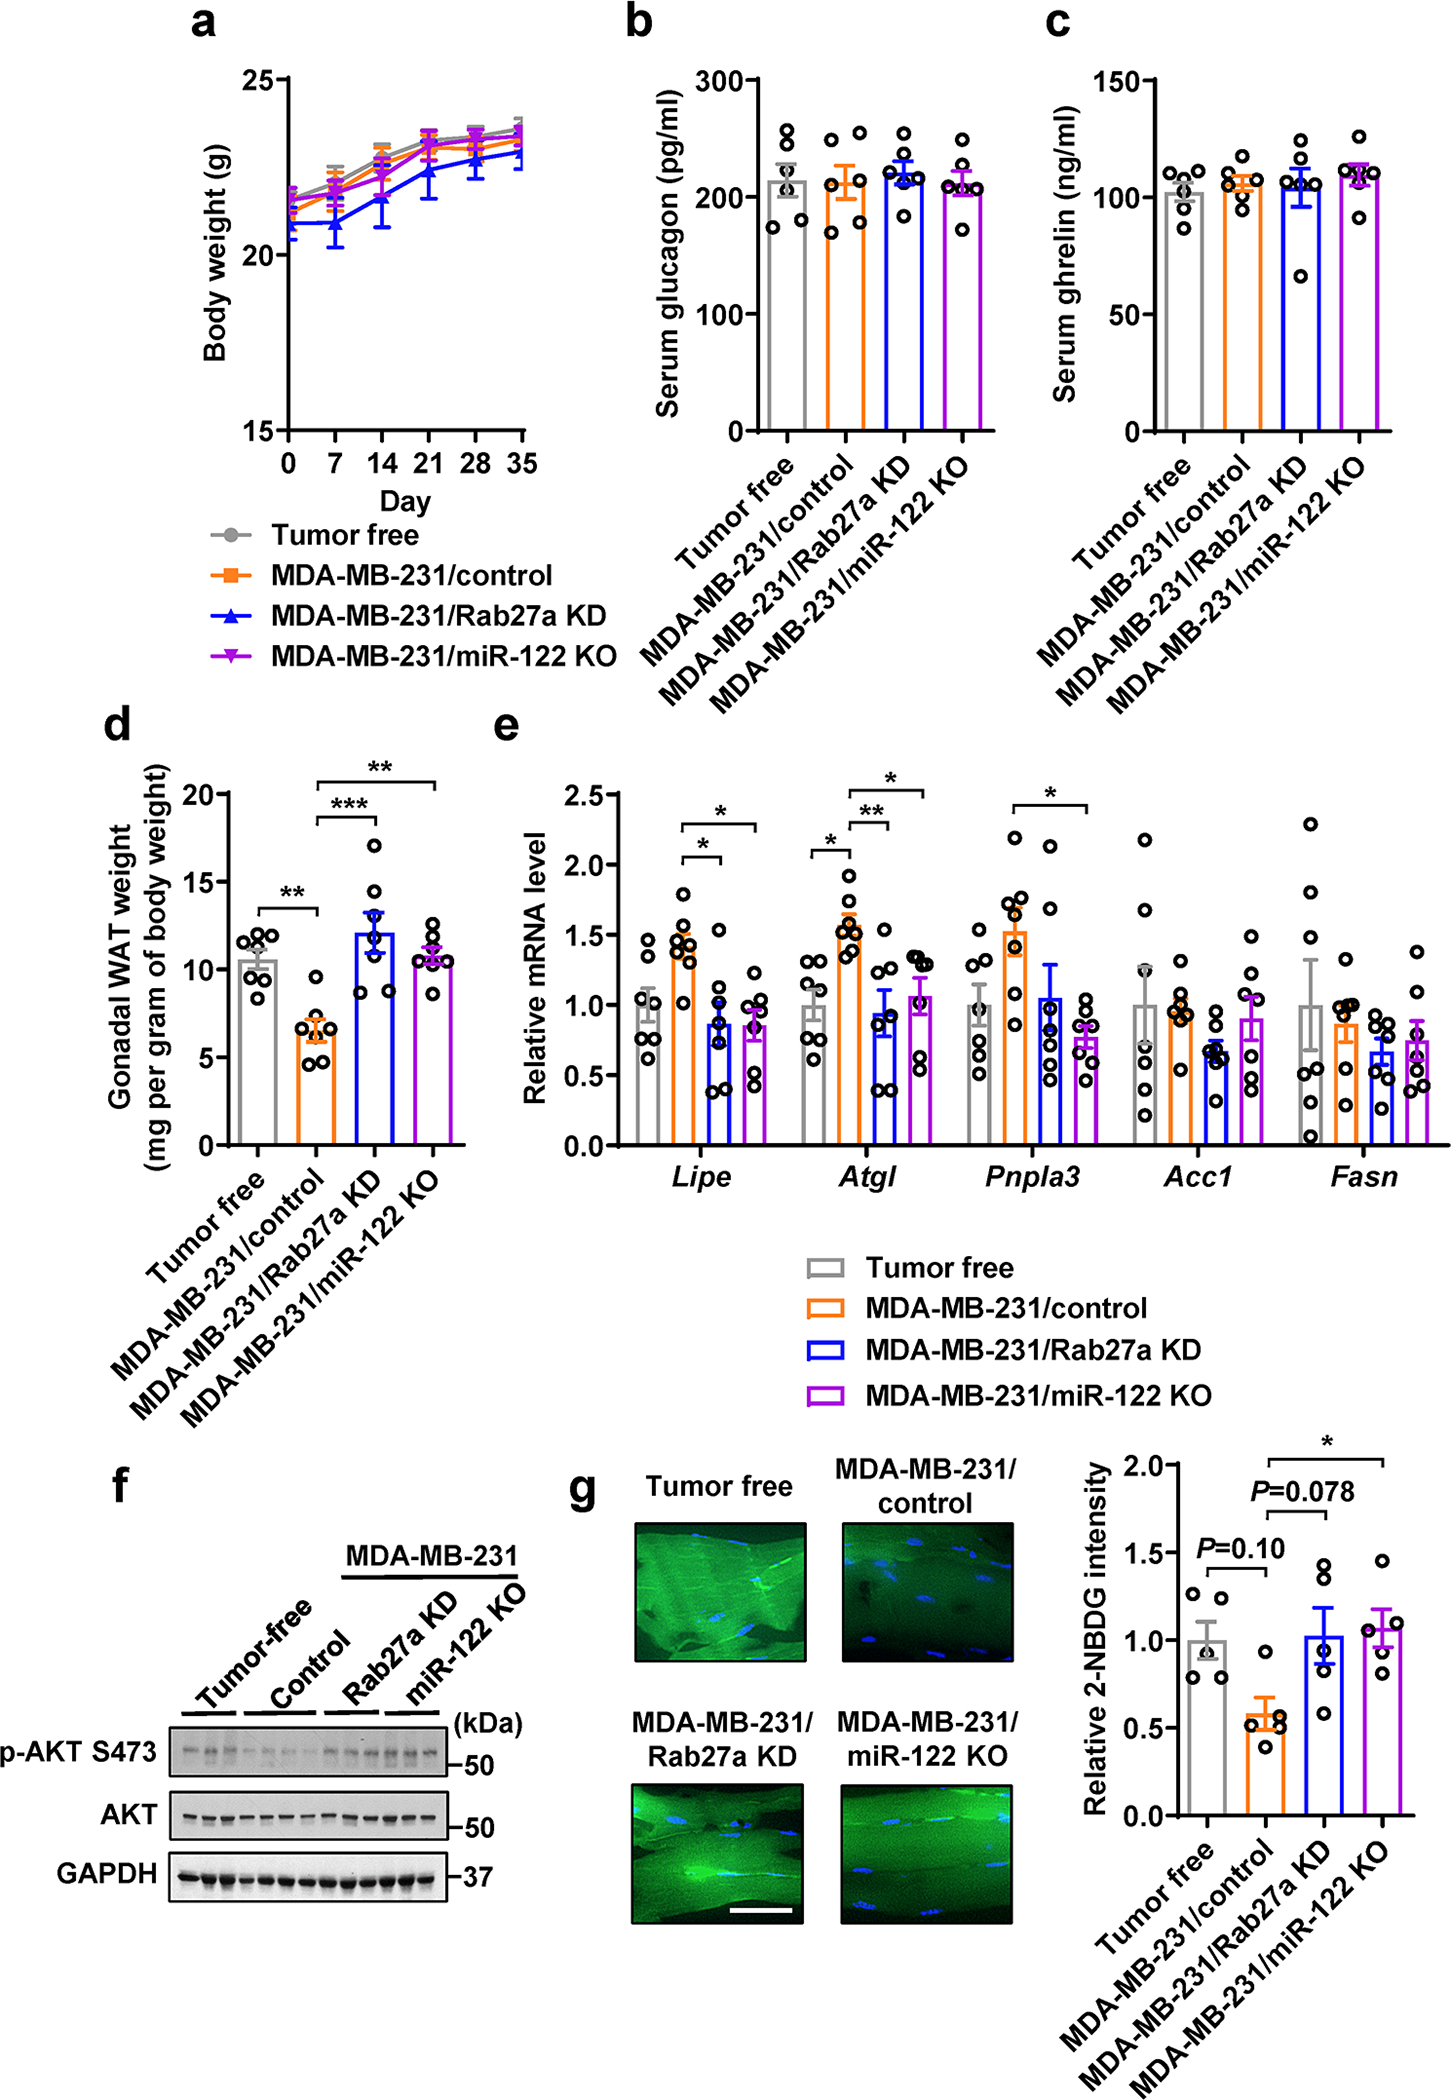
a, Body weight over time (n=6 mice per group). b,c, Serum glucagon (b) and ghrelin (c) levels (n=6 mice per group). d, Weight of gonadal white adipose tissue (WAT) (n=7 mice per group). Values were normalized to whole body weight. e, RT-qPCR showing the relative mRNA levels (normalized to Gapdh mRNA) in gonadal WAT (n=7 mice per group). f, Immunoblots of indicated proteins in the gastrocnemius muscle tissues from indicated groups. g, Representative images showing 2-NBDG uptake in the gastrocnemius from indicated groups (left; Bar=50μm) and overall 2-NBDG signal intensity quantified by ImageJ (right; n=5 mice per group). Data in bar and line graphs are shown as mean ± SEM. Two-way ANOVA followed by Tukey’s multiple comparison post was used for a. One-way ANOVA followed by Tukey’s multiple comparison test was used for b-e and g. *P<0.05, **P<0.01, ***P<0.001. Numerical source data, statistics and unprocessed blots are available online.
Extended Data Fig. 6. Cell proliferation and migration under different culture conditions.
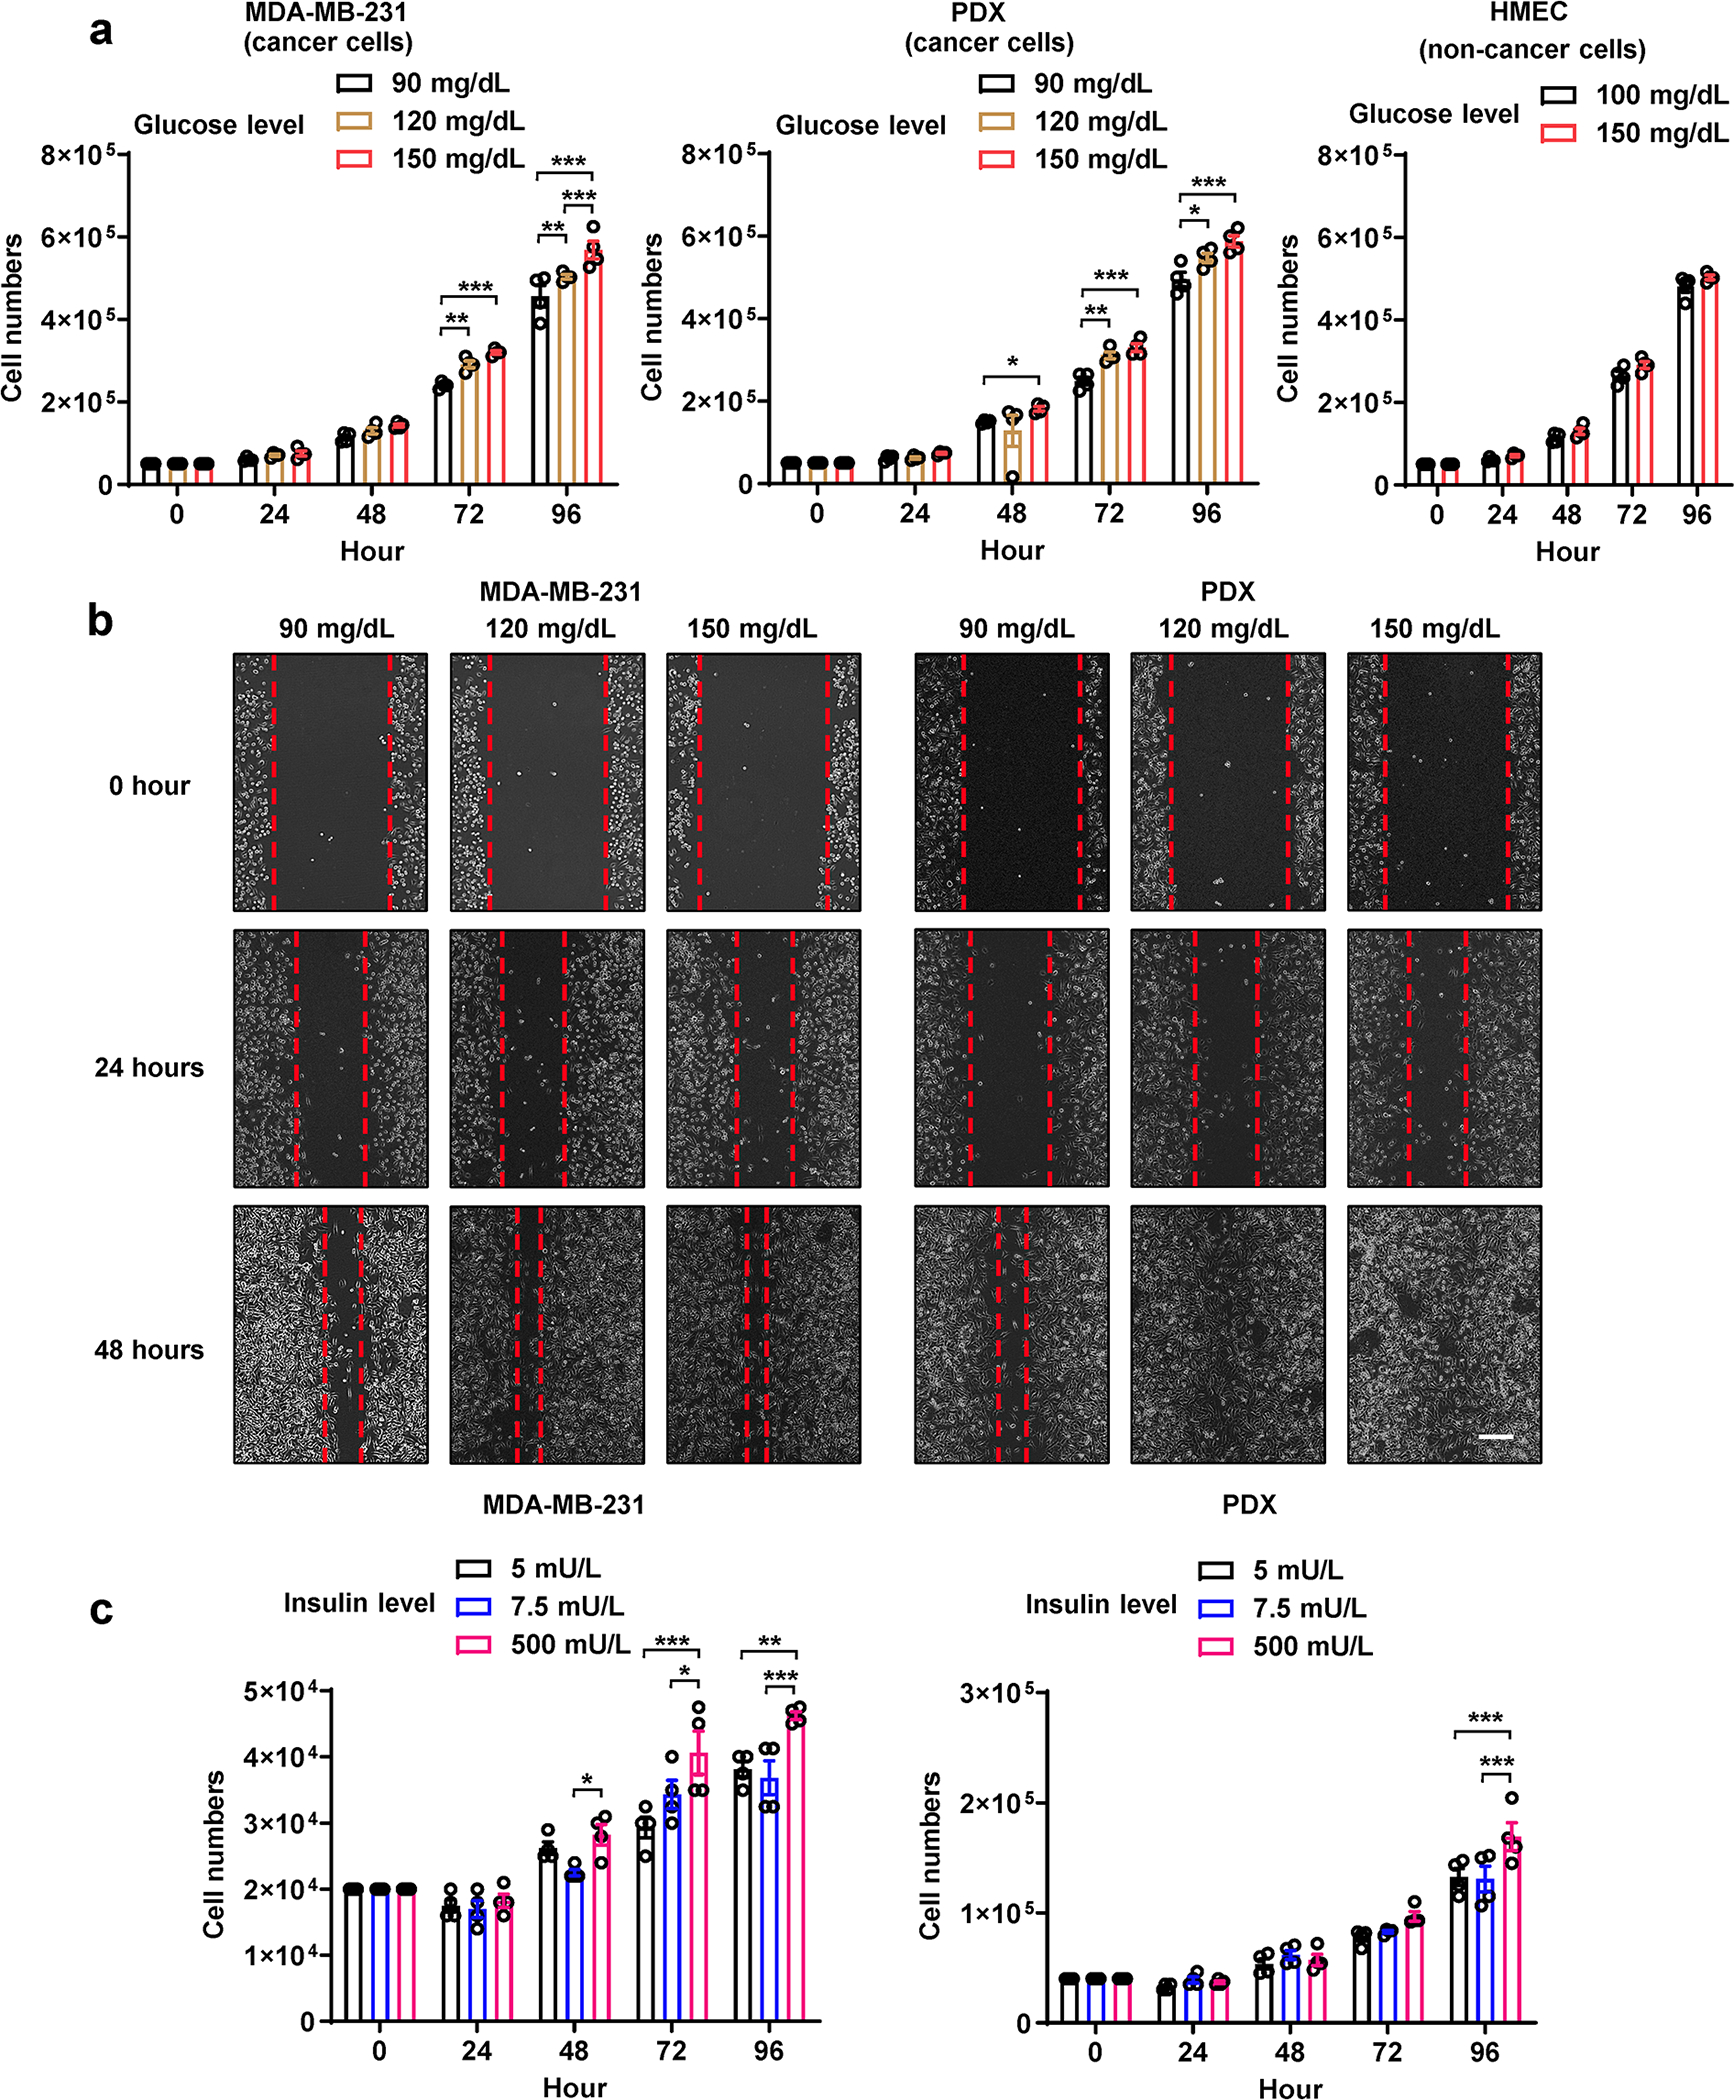
a, Cell number counting every 24 hours under different glucose concentrations (n=4 biologically independent plates of cells). Medium containing indicated glucose concentration was replenished every 24 hours. b, Wound closure migration assay under indicated glucose concentration. Bar=200μm. c, Cell number counting every 24 hours under different insulin concentrations (n=4 biologically independent plates of cells). Medium containing indicated insulin concentration was replenished every 24 hours. Data are shown as mean ± SEM. Two-way ANOVA followed by Tukey’s multiple comparison test was used for a-c. *P<0.05, **P<0.01, ***P<0.001. Numerical source data and statistics are available online.
Extended Data Fig. 7. Assessments of the pancreatic islets of mice in Figure 7g–j.
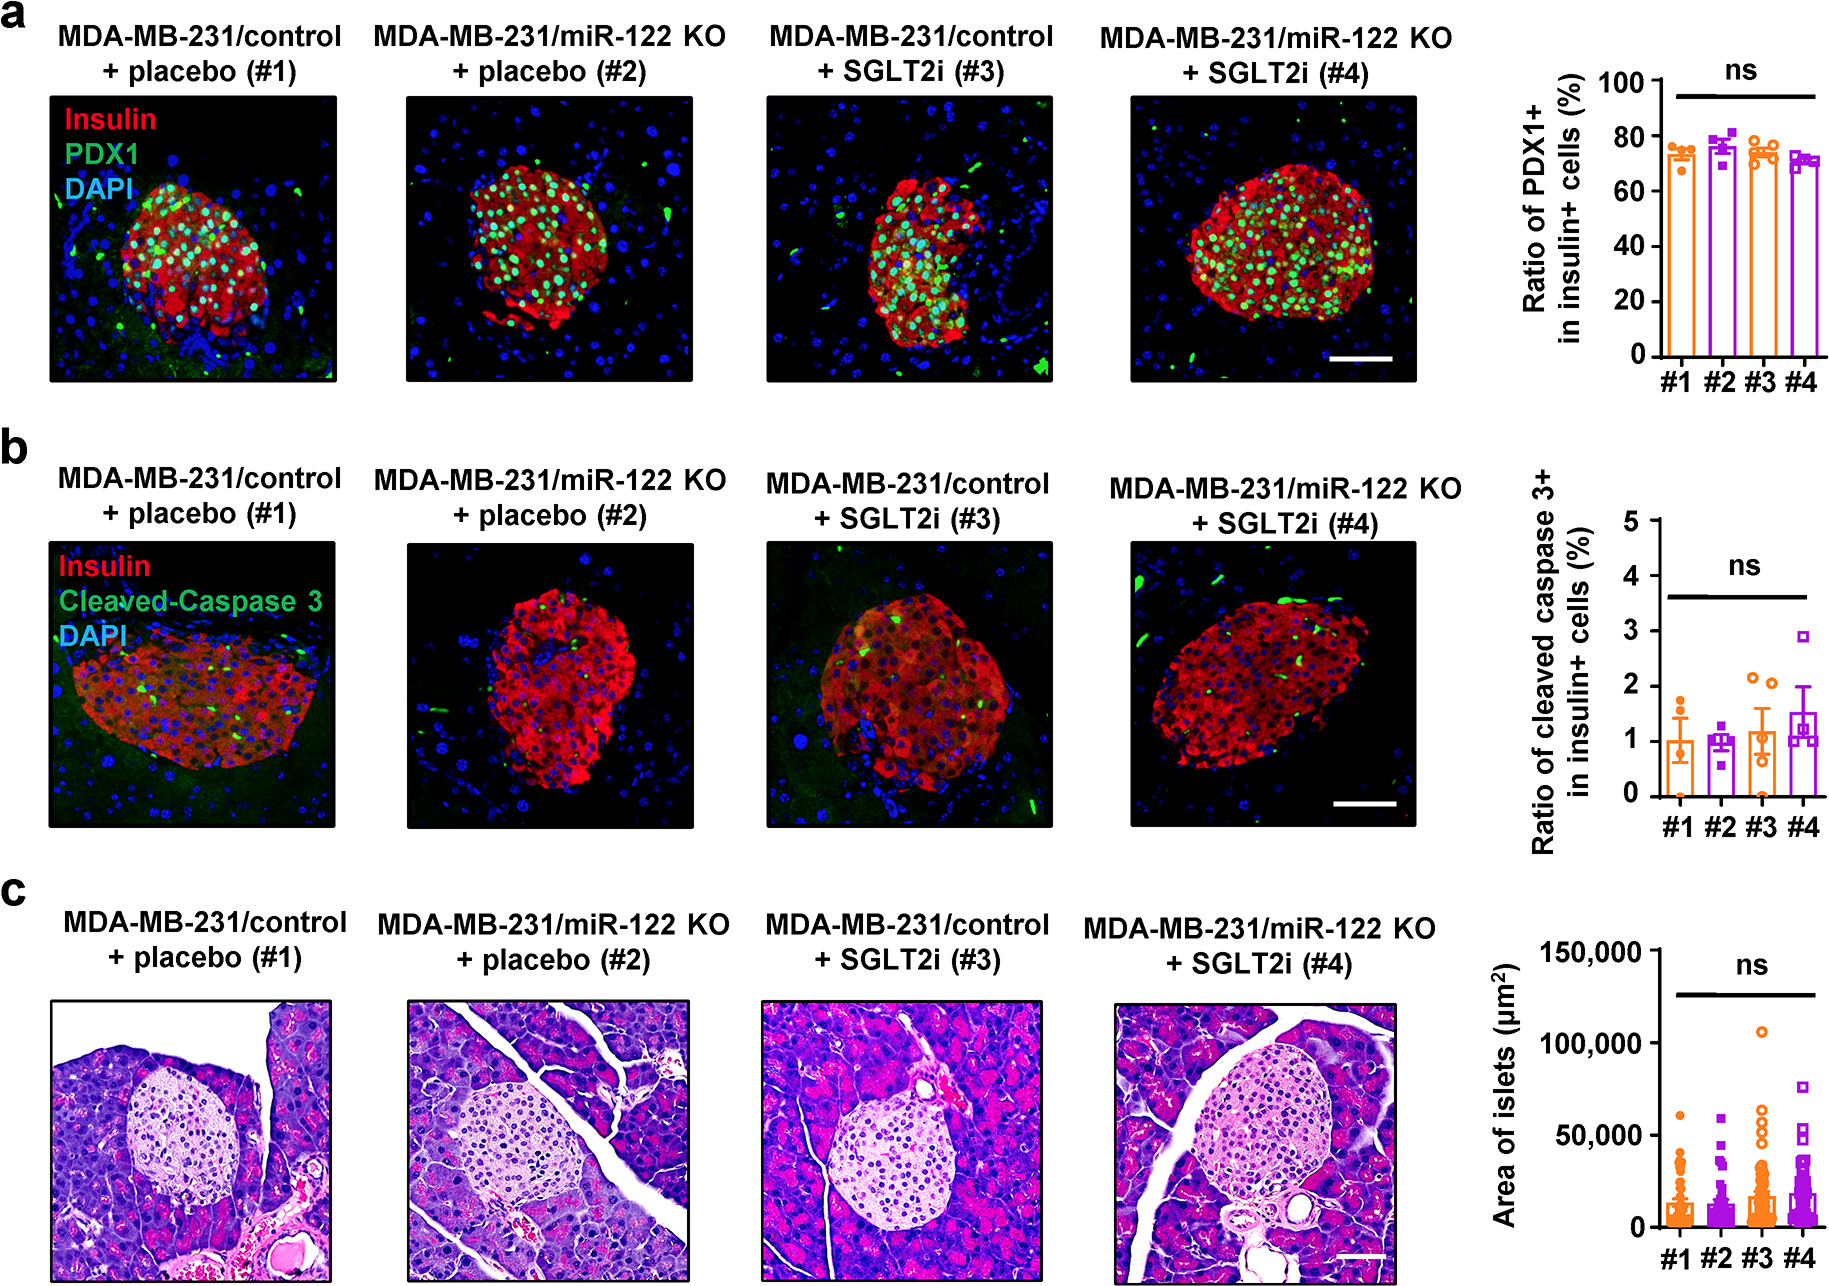
a, Immunofluorescence of pancreas sections (left) showing PDX1 expression (green) in β-cells (insulin+; red). Bar=50μm. The overall frequency of PDX1+ among insulin+ cells was calculated and plotted in the right panel (n=4 mice per group except n=5 mice for MDA-MB-231/control + SGLT2i group). b, Immunofluorescence of pancreas sections (left) showing apoptosis events (indicated by cleaved caspase-3 staining; green) in β-cells (insulin+; red). Bar=50μm. The overall frequency of cleaved caspase-3+ among insulin+ cells was calculated and plotted in the right panel (n=4 mice per group except n=5 mice for MDA-MB-231/control + SGLT2i group). c, Representative H&E staining of pancreas sections (left) showing the regular morphology of mouse islets. Bar=50μm. Area of at least 8 islets from each mouse was calculated and plotted in the right panel (n=4 mice per group except n=5 mice for MDA-MB-231/control + SGLT2i group). Data are shown as mean ± SEM. One-way ANOVA followed by Tukey’s multiple comparison test was used for a-c. ns: not significant. Numerical source data and statistics are available online.
Extended Data Fig. 8. Characterization of CD24+ EVs enriched from human serum samples.
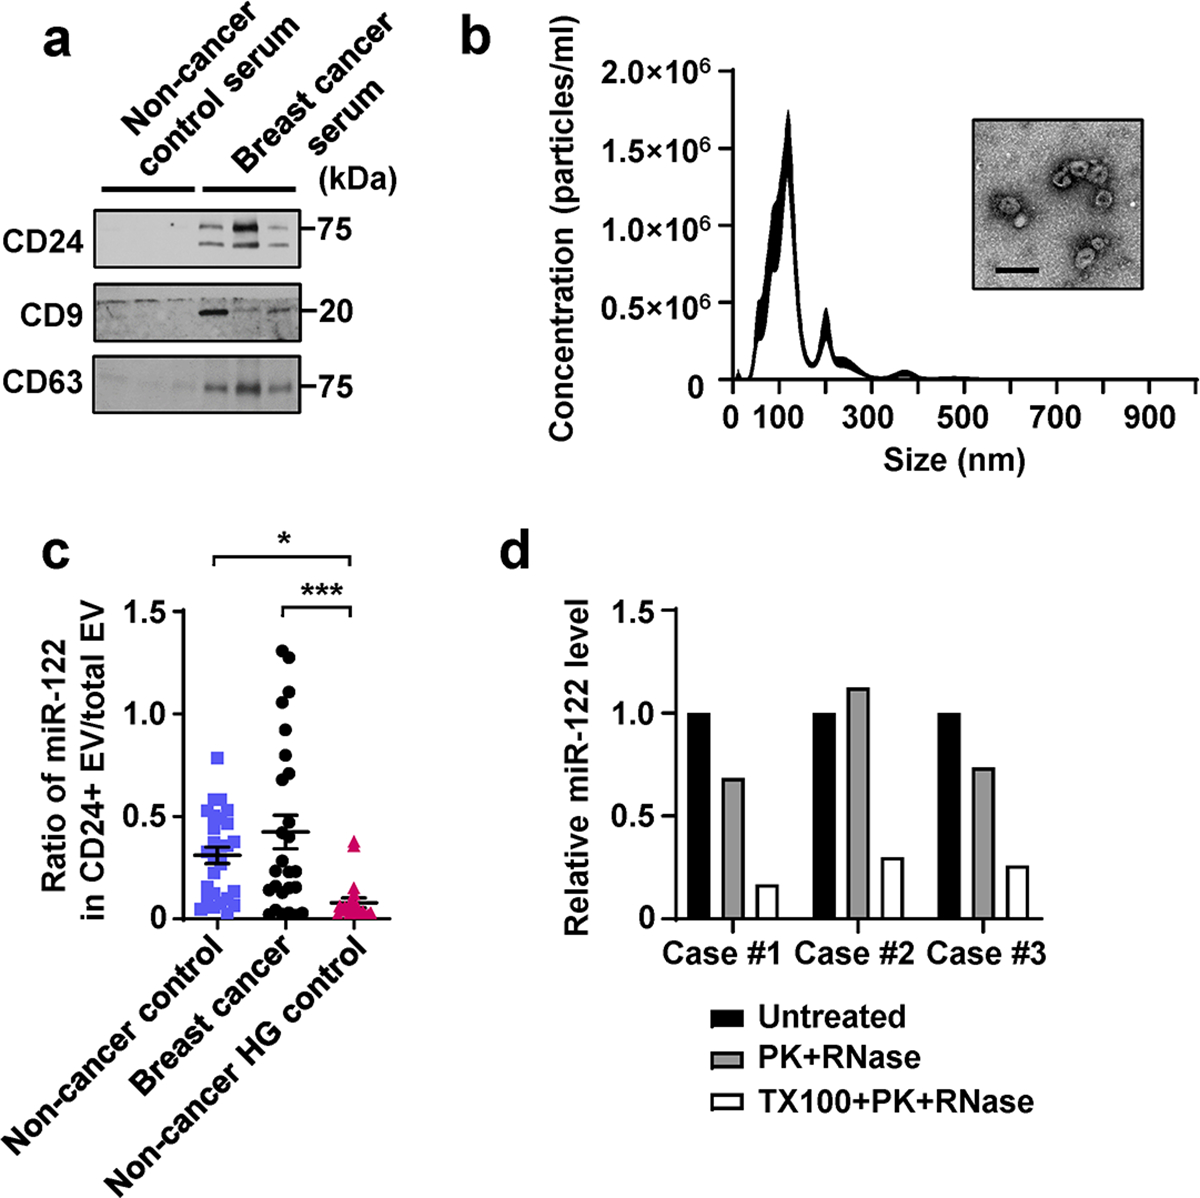
a, Immunoblots of indicated proteins in CD24+ EVs enriched from equal volume of human serum samples, including 3 non-cancer controls and 3 cases of BC. b, NTA and a representative EM image of the CD24+ EVs enriched from the serum of a BC patient. Bar=200nm. c, Calculated ratio of miR-122 abundance in CD24+ vs. total (CD9/CD63/CD81+) circulating EVs. d, RT-qPCR showing relative miR-122 levels in CD24+ EVs (from 3 cases of BC patients) following indicated treatment. Data are shown as mean ± SEM. One-way ANOVA followed by Holm-Sidak’s multiple comparison test was used for c. *P<0.05 and ***P<0.001. Numerical source data, statistics and unprocessed blots are available online.
Extended Data Fig. 9. Gating strategies used for islet cell flow cytometry.
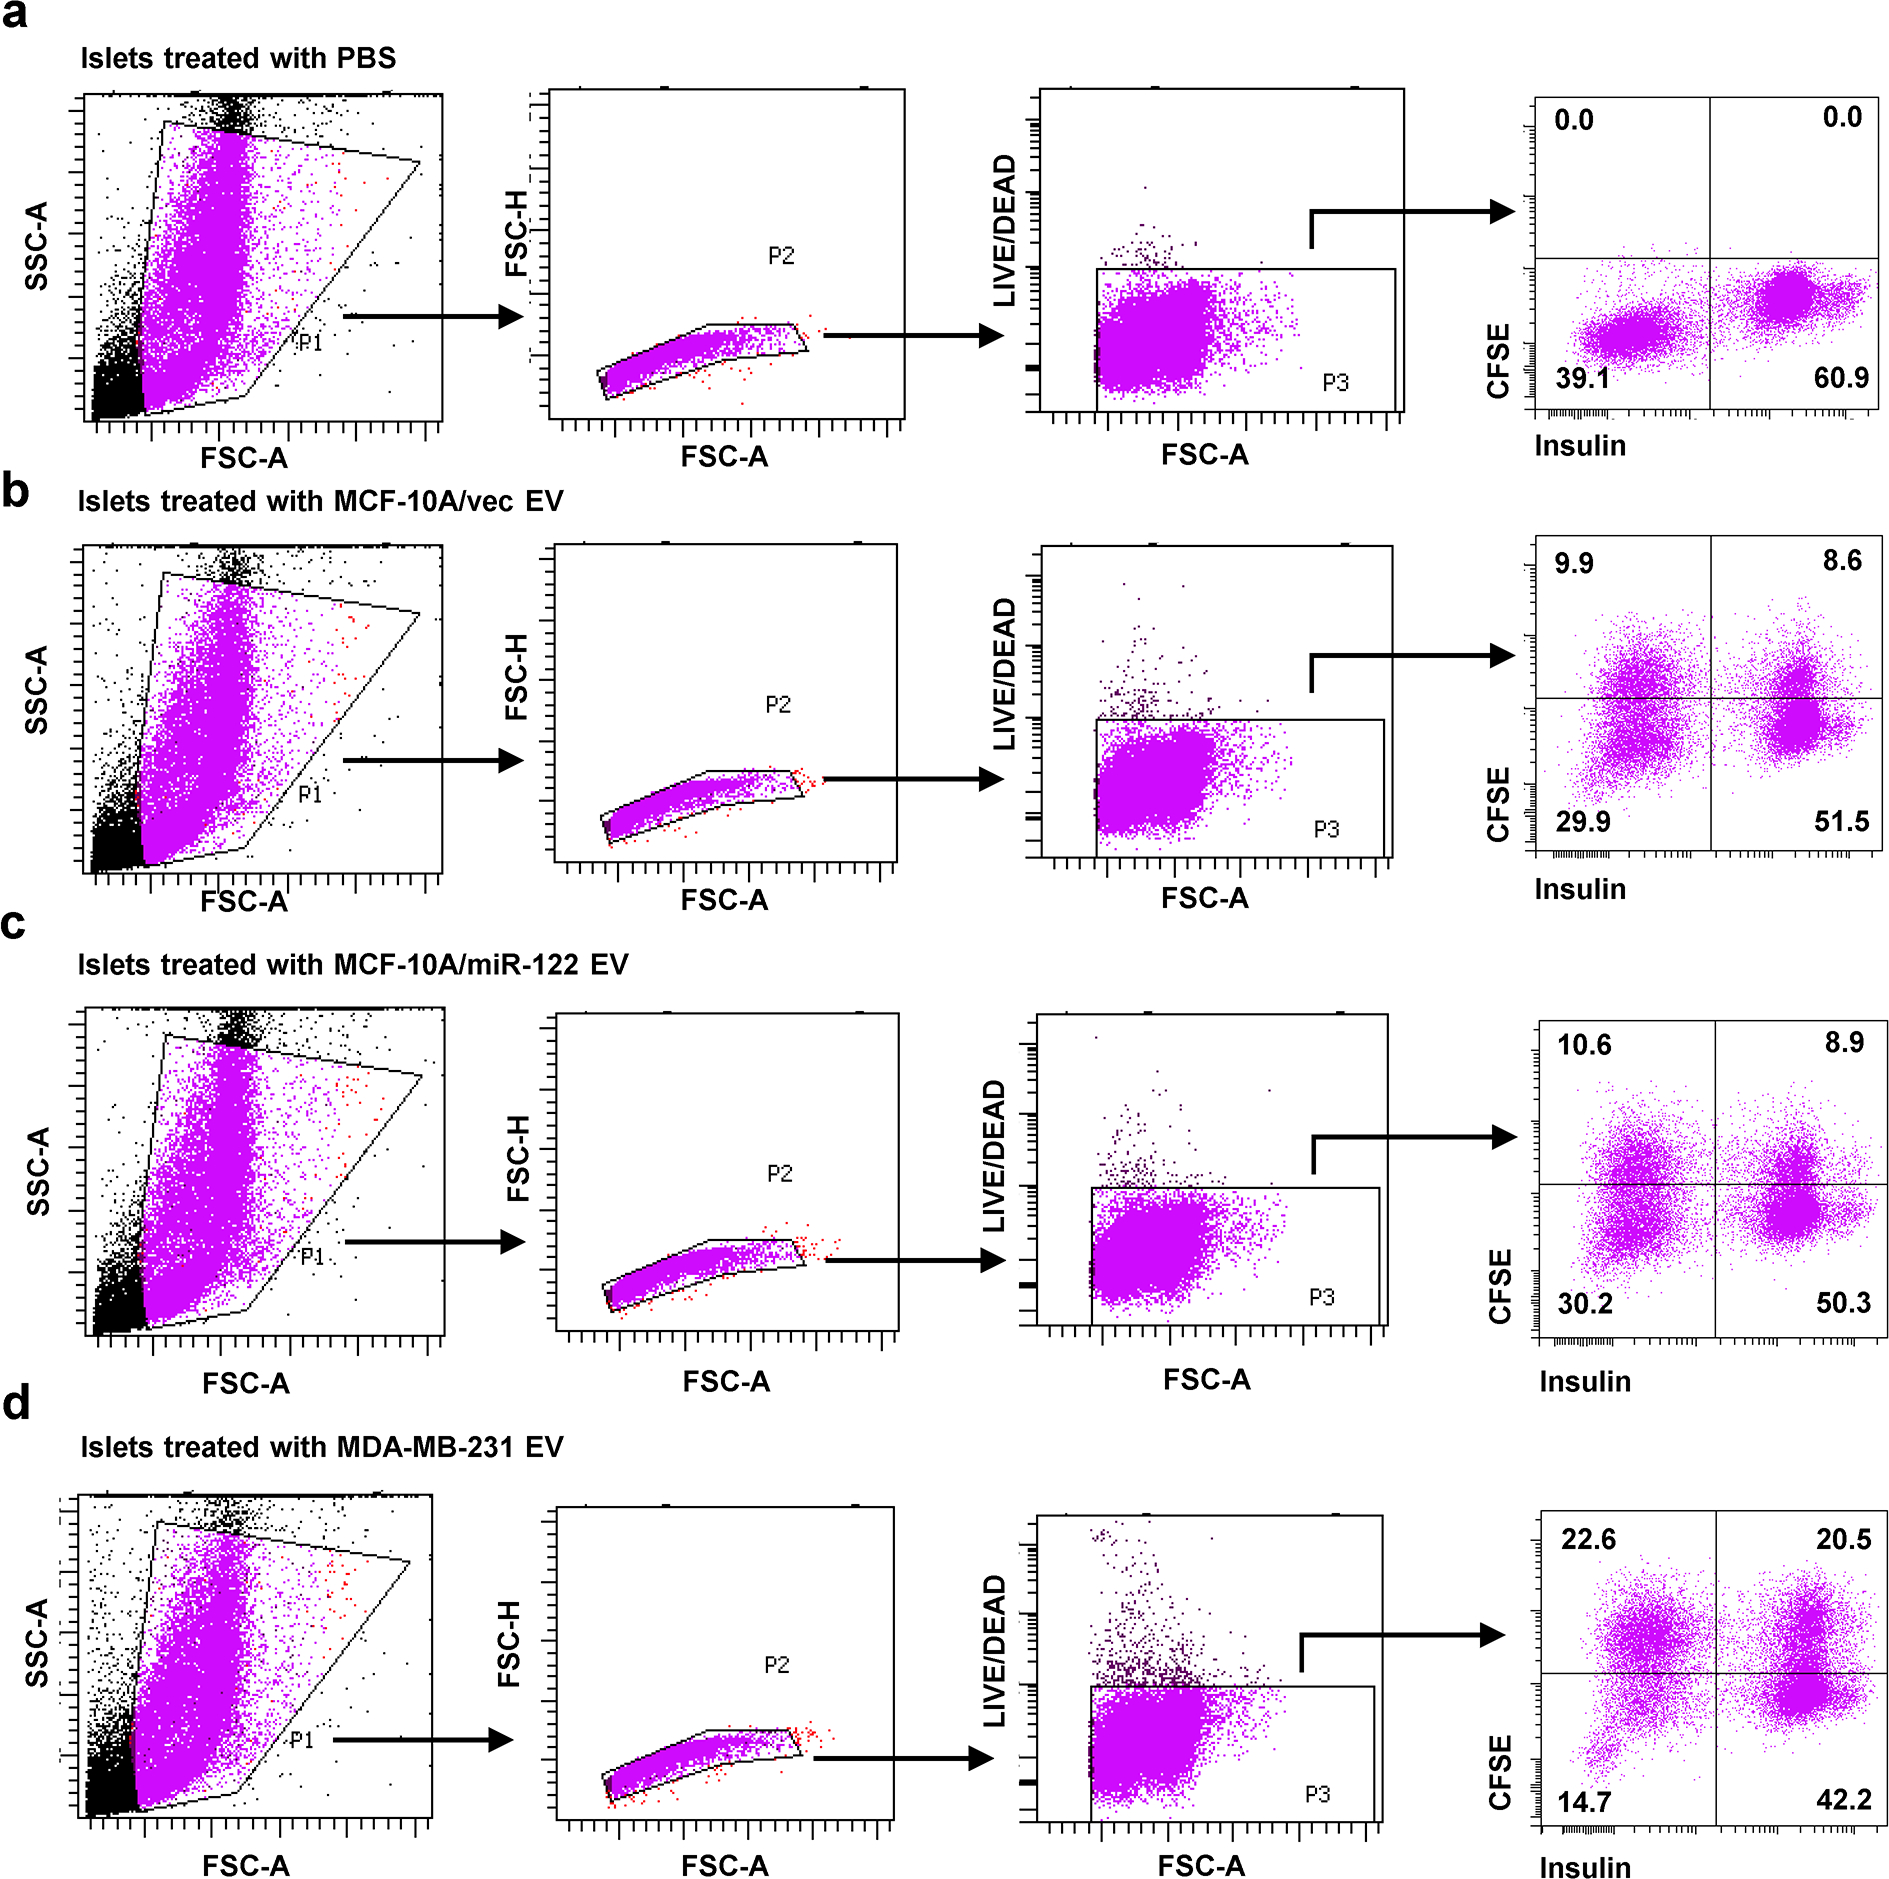
Gating strategies used to analyse uptake of CFSE-labelled EVs by insulin+ pancreatic islet β-cells presented in Figure 2c. a-d, Islets were treated with PBS or EVs as indicated.
Supplementary Material
Acknowledgements
This work was supported by the National Institutes of Health (NIH)/National Cancer Institute (NCI) grants R01CA218140 (SEW), R01CA206911 (SEW), and R01CA179977 (DDS). JDB is supported by a grant from the Hartwell Foundation. Research reported in this publication included work performed in the core facilities supported by the NIH/NCI under grant number P30CA23100 (UCSD Moores Cancer Center) and in the City of Hope Integrative Genomics Core supported by NIH/NCI under grant number P30CA33572. The authors would like to thank the UCSD/CMM electron microscopy facility for EM sample preparation. The EM facility is supported by NIH equipment grant 1S10OD023527. We thank Dr. Xiao Xiao for kindly providing plasmid pEMBOL-D(+)-Ins-GFP4.
Footnotes
Competing Interests Statement
S.N. and D.D. are employees of Regulus Therapeutics, inc. The remaining authors declare no competing interests.
References
- 1.Ferlay J et al. Cancer incidence and mortality worldwide: sources, methods and major patterns in GLOBOCAN 2012. Int J Cancer 136, E359–386 (2015). [DOI] [PubMed] [Google Scholar]
- 2.Ryu TY, Park J & Scherer PE Hyperglycemia as a risk factor for cancer progression. Diabetes Metab J 38, 330–336 (2014). [DOI] [PMC free article] [PubMed] [Google Scholar]
- 3.Maskarinec G et al. Type II Diabetes, Obesity, and Breast Cancer Risk: The Multiethnic Cohort. Cancer Epidemiol Biomarkers Prev 26, 854–861 (2017). [DOI] [PMC free article] [PubMed] [Google Scholar]
- 4.Bronsveld HK et al. Diabetes and Breast Cancer Subtypes. PLoS One 12, e0170084 (2017). [DOI] [PMC free article] [PubMed] [Google Scholar]
- 5.Xue F & Michels KB Diabetes, metabolic syndrome, and breast cancer: a review of the current evidence. Am J Clin Nutr 86, s823–835 (2007). [DOI] [PubMed] [Google Scholar]
- 6.Larsson SC, Mantzoros CS & Wolk A Diabetes mellitus and risk of breast cancer: a meta-analysis. Int J Cancer 121, 856–862 (2007). [DOI] [PubMed] [Google Scholar]
- 7.Liao S et al. Association between diabetes mellitus and breast cancer risk: a meta-analysis of the literature. Asian Pac J Cancer Prev 12, 1061–1065 (2011). [PubMed] [Google Scholar]
- 8.Boyle P et al. Diabetes and breast cancer risk: a meta-analysis. Br J Cancer 107, 1608–1617 (2012). [DOI] [PMC free article] [PubMed] [Google Scholar]
- 9.Luque RM et al. Breast cancer is associated to impaired glucose/insulin homeostasis in premenopausal obese/overweight patients. Oncotarget 8, 81462–81474 (2017). [DOI] [PMC free article] [PubMed] [Google Scholar]
- 10.Villarreal-Garza C et al. Impact of diabetes and hyperglycemia on survival in advanced breast cancer patients. Exp Diabetes Res 2012, 732027 (2012). [DOI] [PMC free article] [PubMed] [Google Scholar]
- 11.Nam S et al. Association Between Insulin Resistance and Luminal B Subtype Breast Cancer in Postmenopausal Women. Medicine (Baltimore) 95, e2825 (2016). [DOI] [PMC free article] [PubMed] [Google Scholar]
- 12.Duggan C et al. Associations of insulin resistance and adiponectin with mortality in women with breast cancer. J Clin Oncol 29, 32–39 (2011). [DOI] [PMC free article] [PubMed] [Google Scholar]
- 13.Hernandez AV et al. Association between insulin resistance and breast carcinoma: a systematic review and meta-analysis. PLoS One 9, e99317 (2014). [DOI] [PMC free article] [PubMed] [Google Scholar]
- 14.Goodwin PJ et al. Insulin- and obesity-related variables in early-stage breast cancer: correlations and time course of prognostic associations. J Clin Oncol 30, 164–171 (2012). [DOI] [PubMed] [Google Scholar]
- 15.Rose DP & Vona-Davis L The cellular and molecular mechanisms by which insulin influences breast cancer risk and progression. Endocr Relat Cancer 19, R225–241 (2012). [DOI] [PubMed] [Google Scholar]
- 16.Bruning PF et al. Insulin resistance and breast-cancer risk. Int J Cancer 52, 511–516 (1992). [DOI] [PubMed] [Google Scholar]
- 17.Muti P et al. Fasting glucose is a risk factor for breast cancer: a prospective study. Cancer Epidemiol Biomarkers Prev 11, 1361–1368 (2002). [PubMed] [Google Scholar]
- 18.Vona-Davis L & Rose DP Type 2 diabetes and obesity metabolic interactions: common factors for breast cancer risk and novel approaches to prevention and therapy. Curr Diabetes Rev 8, 116–130 (2012). [DOI] [PubMed] [Google Scholar]
- 19.Gunter MJ et al. Insulin, insulin-like growth factor-I, and risk of breast cancer in postmenopausal women. J Natl Cancer Inst 101, 48–60 (2009). [DOI] [PMC free article] [PubMed] [Google Scholar]
- 20.Kaaks R et al. Prospective study of IGF-I, IGF-binding proteins, and breast cancer risk, in northern and southern Sweden. Cancer Causes Control 13, 307–316 (2002). [DOI] [PubMed] [Google Scholar]
- 21.Keinan-Boker L et al. Circulating levels of insulin-like growth factor I, its binding proteins −1,−2, −3, C-peptide and risk of postmenopausal breast cancer. Int J Cancer 106, 90–95 (2003). [DOI] [PubMed] [Google Scholar]
- 22.Eliassen AH, Tworoger SS, Mantzoros CS, Pollak MN & Hankinson SE Circulating insulin and c-peptide levels and risk of breast cancer among predominately premenopausal women. Cancer Epidemiol Biomarkers Prev 16, 161–164 (2007). [DOI] [PubMed] [Google Scholar]
- 23.Verheus M et al. Serum C-peptide levels and breast cancer risk: results from the European Prospective Investigation into Cancer and Nutrition (EPIC). Int J Cancer 119, 659–667 (2006). [DOI] [PubMed] [Google Scholar]
- 24.Lipscombe LL, Goodwin PJ, Zinman B, McLaughlin JR & Hux JE Increased prevalence of prior breast cancer in women with newly diagnosed diabetes. Breast Cancer Res Treat 98, 303–309 (2006). [DOI] [PubMed] [Google Scholar]
- 25.Lipscombe LL et al. Incidence of diabetes among postmenopausal breast cancer survivors. Diabetologia 56, 476–483 (2013). [DOI] [PubMed] [Google Scholar]
- 26.Onitilo AA et al. Breast cancer incidence before and after diagnosis of type 2 diabetes mellitus in women: increased risk in the prediabetes phase. Eur J Cancer Prev 23, 76–83 (2014). [DOI] [PubMed] [Google Scholar]
- 27.Bordeleau L et al. Diabetes and breast cancer among women with BRCA1 and BRCA2 mutations. Cancer 117, 1812–1818 (2011). [DOI] [PMC free article] [PubMed] [Google Scholar]
- 28.Onitilo AA et al. Breast and prostate cancer survivors in a diabetic cohort: results from the Living with Diabetes Study. Clin Med Res 11, 210–218 (2013). [DOI] [PMC free article] [PubMed] [Google Scholar]
- 29.Tkach M & Thery C Communication by Extracellular Vesicles: Where We Are and Where We Need to Go. Cell 164, 1226–1232 (2016). [DOI] [PubMed] [Google Scholar]
- 30.Becker A et al. Extracellular Vesicles in Cancer: Cell-to-Cell Mediators of Metastasis. Cancer Cell 30, 836–848 (2016). [DOI] [PMC free article] [PubMed] [Google Scholar]
- 31.Wang SE Extracellular Vesicles and Metastasis. Cold Spring Harbor perspectives in medicine (2019). [DOI] [PMC free article] [PubMed] [Google Scholar]
- 32.Valadi H et al. Exosome-mediated transfer of mRNAs and microRNAs is a novel mechanism of genetic exchange between cells. Nat Cell Biol 9, 654–659 (2007). [DOI] [PubMed] [Google Scholar]
- 33.Fong MY et al. Breast-cancer-secreted miR-122 reprograms glucose metabolism in premetastatic niche to promote metastasis. Nat Cell Biol 17, 183–194 (2015). [DOI] [PMC free article] [PubMed] [Google Scholar]
- 34.Redzic JS, Balaj L, van der Vos KE & Breakefield XO Extracellular RNA mediates and marks cancer progression. Semin Cancer Biol 28, 14–23 (2014). [DOI] [PMC free article] [PubMed] [Google Scholar]
- 35.Mitchell PS et al. Circulating microRNAs as stable blood-based markers for cancer detection. Proc Natl Acad Sci U S A 105, 10513–10518 (2008). [DOI] [PMC free article] [PubMed] [Google Scholar]
- 36.Wu X et al. De novo sequencing of circulating miRNAs identifies novel markers predicting clinical outcome of locally advanced breast cancer. J Transl Med 10, 42 (2012). [DOI] [PMC free article] [PubMed] [Google Scholar]
- 37.Zhou W et al. Cancer-Secreted miR-105 Destroys Vascular Endothelial Barriers to Promote Metastasis. Cancer Cell 25, 501–515 (2014). [DOI] [PMC free article] [PubMed] [Google Scholar]
- 38.Ashcroft FM ATP-sensitive potassium channelopathies: focus on insulin secretion. J Clin Invest 115, 2047–2058 (2005). [DOI] [PMC free article] [PubMed] [Google Scholar]
- 39.Nakatsu D et al. L-cysteine reversibly inhibits glucose-induced biphasic insulin secretion and ATP production by inactivating PKM2. Proc Natl Acad Sci U S A 112, E1067–1076 (2015). [DOI] [PMC free article] [PubMed] [Google Scholar]
- 40.Parkes DG, Pittner R, Jodka C, Smith P & Young A Insulinotropic actions of exendin-4 and glucagon-like peptide-1 in vivo and in vitro. Metabolism: clinical and experimental 50, 583–589 (2001). [DOI] [PubMed] [Google Scholar]
- 41.Benediktsson AM, Schachtele SJ, Green SH & Dailey ME Ballistic labeling and dynamic imaging of astrocytes in organotypic hippocampal slice cultures. J Neurosci Methods 141, 41–53 (2005). [DOI] [PubMed] [Google Scholar]
- 42.Tsuyada A et al. CCL2 mediates cross-talk between cancer cells and stromal fibroblasts that regulates breast cancer stem cells. Cancer Res 72, 2768–2779 (2012). [DOI] [PMC free article] [PubMed] [Google Scholar]
- 43.Yan W et al. Cancer-cell-secreted exosomal miR-105 promotes tumour growth through the MYC-dependent metabolic reprogramming of stromal cells. Nat Cell Biol 20, 597–609 (2018). [DOI] [PMC free article] [PubMed] [Google Scholar]
- 44.Tsuji K et al. Common bile duct injection as a novel method for establishing red fluorescent protein (RFP)-expressing human pancreatic cancer in nude mice. JOP 7, 193–199 (2006). [PubMed] [Google Scholar]
- 45.Thackeray JT et al. Insulin supplementation attenuates cancer-induced cardiomyopathy and slows tumor disease progression. JCI Insight 2 (2017). [DOI] [PMC free article] [PubMed] [Google Scholar]
- 46.Stenlof K et al. Efficacy and safety of canagliflozin monotherapy in subjects with type 2 diabetes mellitus inadequately controlled with diet and exercise. Diabetes Obes Metab 15, 372–382 (2013). [DOI] [PMC free article] [PubMed] [Google Scholar]
- 47.Simionescu N et al. Hyperglycemia Determines Increased Specific MicroRNAs Levels in Sera and HDL of Acute Coronary Syndrome Patients and Stimulates MicroRNAs Production in Human Macrophages. PLoS One 11, e0161201 (2016). [DOI] [PMC free article] [PubMed] [Google Scholar]
- 48.Willeit P et al. Circulating MicroRNA-122 Is Associated With the Risk of New-Onset Metabolic Syndrome and Type 2 Diabetes. Diabetes 66, 347–357 (2017). [DOI] [PMC free article] [PubMed] [Google Scholar]
- 49.Rupp AK et al. Loss of EpCAM expression in breast cancer derived serum exosomes: role of proteolytic cleavage. Gynecol Oncol 122, 437–446 (2011). [DOI] [PubMed] [Google Scholar]
- 50.Gallagher EJ & LeRoith D Minireview: IGF, Insulin, and Cancer. Endocrinology 152, 2546–2551 (2011). [DOI] [PubMed] [Google Scholar]
- 51.Belardi V, Gallagher EJ, Novosyadlyy R & LeRoith D Insulin and IGFs in obesity-related breast cancer. J Mammary Gland Biol Neoplasia 18, 277–289 (2013). [DOI] [PubMed] [Google Scholar]
- 52.Novosyadlyy R et al. Insulin-mediated acceleration of breast cancer development and progression in a nonobese model of type 2 diabetes. Cancer Res 70, 741–751 (2010). [DOI] [PMC free article] [PubMed] [Google Scholar]
- 53.Hopkins BD et al. Suppression of insulin feedback enhances the efficacy of PI3K inhibitors. Nature 560, 499–503 (2018). [DOI] [PMC free article] [PubMed] [Google Scholar]
- 54.Hay N Reprogramming glucose metabolism in cancer: can it be exploited for cancer therapy? Nat Rev Cancer 16, 635–649 (2016). [DOI] [PMC free article] [PubMed] [Google Scholar]
- 55.Javeed N et al. Pancreatic Cancer-Derived Exosomes Cause Paraneoplastic beta-cell Dysfunction. Clin Cancer Res 21, 1722–1733 (2015). [DOI] [PMC free article] [PubMed] [Google Scholar]
- 56.Schultz NA et al. MicroRNA biomarkers in whole blood for detection of pancreatic cancer. JAMA 311, 392–404 (2014). [DOI] [PubMed] [Google Scholar]
- 57.Debnath J et al. The role of apoptosis in creating and maintaining luminal space within normal and oncogene-expressing mammary acini. Cell 111, 29–40. (2002). [DOI] [PubMed] [Google Scholar]
- 58.Lee YS et al. The fractalkine/CX3CR1 system regulates beta cell function and insulin secretion. Cell 153, 413–425 (2013). [DOI] [PMC free article] [PubMed] [Google Scholar]
- 59.Ran FA et al. Genome engineering using the CRISPR-Cas9 system. Nat Protoc 8, 2281–2308 (2013). [DOI] [PMC free article] [PubMed] [Google Scholar]
- 60.Gray JT & Zolotukhin S Design and construction of functional AAV vectors. Methods Mol Biol 807, 25–46 (2011). [DOI] [PubMed] [Google Scholar]
- 61.Zhao C et al. Overcoming Insulin Insufficiency by Forced Follistatin Expression in beta-cells of db/db Mice. Mol Ther 23, 866–874 (2015). [DOI] [PMC free article] [PubMed] [Google Scholar]
- 62.Anastasiou D et al. Inhibition of pyruvate kinase M2 by reactive oxygen species contributes to cellular antioxidant responses. Science 334, 1278–1283 (2011). [DOI] [PMC free article] [PubMed] [Google Scholar]
- 63.Shurtleff MJ et al. Broad role for YBX1 in defining the small noncoding RNA composition of exosomes. Proc Natl Acad Sci U S A 114, E8987–E8995 (2017). [DOI] [PMC free article] [PubMed] [Google Scholar]
- 64.van der Ree MH et al. Safety, tolerability, and antiviral effect of RG-101 in patients with chronic hepatitis C: a phase 1B, double-blind, randomised controlled trial. Lancet 389, 709–717 (2017). [DOI] [PubMed] [Google Scholar]
- 65.Jankowska MM et al. Protocol for a cross sectional study of cancer risk, environmental exposures and lifestyle behaviors in a diverse community sample: the Community of Mine study. BMC Public Health 19, 186 (2019). [DOI] [PMC free article] [PubMed] [Google Scholar]
Associated Data
This section collects any data citations, data availability statements, or supplementary materials included in this article.
Supplementary Materials
Data Availability Statement
RNA-seq data that support the findings of this study have been deposited in the Gene Expression Omnibus (GEO) under accession codes GSE152391, GSE173408, and GSE173276. All other data supporting the findings of this study are available from the corresponding author on reasonable request.


