

Abstract
In this article, we provide an overview of current neuroimaging methods for studying perivascular spaces (PVS) in humans using brain MRI. In recent years, an increasing number of studies highlighted the role of PVS in cerebrospinal/interstial fluid circulation and clearance of cerebral waste products and their association with neurological diseases. Novel strategies and techniques have been introduced to improve the quantification of PVS and to investigate their function and morphological features in physiological and pathological conditions. After a brief introduction on the anatomy and physiology of PVS, we examine the latest technological developments to quantitatively analyze the structure and function of PVS in humans with MRI. We describe the applications, advantages, and limitations of these methods, providing guidance and suggestions on the acquisition protocols and analysis techniques that can be applied to study PVS in vivo. Finally, we review the human neuroimaging studies on PVS across the normative lifespan and in the context of neurological disorders.
Keywords: Perivascular spaces, Structural MRI, Diffusion MRI, Ultra-high field MRI
1. Introduction
In the last decade, several studies have demonstrated that perivascular spaces (PVS) are critically involved in the circulation of cerebral fluid, and both functional and structural alterations to PVS have been found to be associated with multiple neurological diseases as well as other non-neurological conditions (Francis et al., 2019). Despite the recent advancements in PVS research, a full understanding of the physiological functions of PVS and their pathophysiological implications for clinical disorders remains elusive. Imaging PVS in pre-clinical models and clinical studies can be used not only to better understand the mechanisms underlying the cerebral fluid dynamics of perivascular flow and their alterations in diseases, but also to explore the potential use of PVS as a neuroimaging diagnostic biomarker and for therapeutic purposes. In fact, PVS can represent both a route for the delivery of therapeutic agents into the brain and a therapeutic target, since variations in the perivascular flow occur in several neurological disorders and are linked to neurodegeneration (Sweeney et al., 2018). For example, the development of cerebral edema after stroke, a detrimental complication whose severity is a critical prognostic factor and predicts the patients’ functional outcome (Liang et al., 2007; Stokum et al., 2016), has been shown to be dependent on an increase of the perivascular flow accompanied by PVS enlargement (Mestre et al., 2020). Additionally, pre-clinical studies have shown that PVS is a major component of the brain clearance system, whose impairment can lead to the accumulation of metabolic waste products, formation of amyloid-β (Aβ) plaques, protein aggregation, and subsequent cellular damage (Iliff et al., 2012; Mawuenyega et al., 2010; Xu et al., 2015). The results from these and other studies provide conceptual bases for the development of therapeutic strategies specifically targeting PVS and highlight the importance of neuroimaging as a fundamental tool for the investigation of PVS. In this review, we describe the main structural and functional characteristics of PVS that can be captured using neuroimaging techniques, and provide guidance and suggestions on the acquisition protocols and analysis techniques that can be applied to study PVS in vivo. Finally, we report and review recent neuroimaging studies investigating PVS under different physiological and pathological conditions.
2. Anatomy and function of PVS
PVS are fluid-filled spaces that surround cerebral blood vessels penetrating or leaving the brain parenchyma and are limited externally by the glia limitans, mesh of astrocyte endfeet covered by an outer basal lamina (Pollock et al., 1997). PVS were described for the first time by Durand-Fardel and Pestalozzi in the 1840s (Durand-Fardel, 1843; Woollam and Millen, 1955), but they are commonly called Virchow-Robin spaces from the names of the German pathologist Rudolf Virchow and the French anatomist Charles Philippe Robin, who described them in the 1850s (Robin, 1859; Virchow, 1851). PVS surround most of the perforating blood vessels in the brain, but on MRI they are most commonly visible at the level of the basal ganglia and the centrum semiovale (Osborn and Barisano, 2020). According to Zhang et al. (1990), PVS around superficial perforating arteries in the centrum semiovale have only one layer of pia mater and communicate with the subpial space, whereas in lenticulostriate arteries at the level of the basal ganglia PVS present two layers of leptomeningeal membranes and communicate with the subarachnoid space (Pollock et al., 1997). Moreover, in contrast with periarterial spaces, the perivenous spaces lack the outer layer of leptomeninges (Pollock et al., 1997). The PVS are a key compartment at the interface between the blood vessels and the brain, and different types of cells interact with PVS, including endothelial cells, pericytes, astrocytes, neurons, and microglia (Troili et al., 2020).
In 2012, the glymphatic system was first described as the system responsible for brain clearance of toxic and waste metabolites via cerebrospinal fluid (CSF)–interstitial fluid (ISF) exchange, drainage of fluids, as well as transport of other molecules, such as glucose and lipids, necessary for the correct cerebral functioning (Iliff et al., 2012). According to the glymphatic system model, the CSF flows from the subarachnoid space into the PVS driven by an arterial pulsation that pushes the fluid along the penetrating arteries diving into the brain parenchyma where CSF mixes with ISF (Iliff et al., 2013b; Mestre et al., 2018). The CSF-ISF containing solutes and waste products subsequently reaches the perivenous space and drains away from the cerebral parenchyma reentering the subarachnoid space or the ventricles (Iliff et al., 2012). Since PVS represent a critical component of the glymphatic system, it has been proposed that alterations in the glymphatic flow mechanism could lead to PVS enlargement. Recently, it was also reported that vasomotion, i.e., the slow constrictions and dilations of arterioles that is initiated spontaneously by the vascular smooth muscle cells and is independent of pulsatile blood flow (He et al., 2018; Mateo et al., 2017), constitute a driving force for the paravascular clearance (van Veluw et al., 2020). The mechanisms underlying the movement of the fluid from PVS to the parenchyma and vice versa remain however currently elusive. While the original glymphatic hypothesis proposed that there is a convective bulk flow linking paravascular and interstitial compartments and driving the clearance of interstitial solutes from the brain parenchyma (Iliff et al., 2012), other recent studies suggested that CSF-ISF exchange occurs by diffusion (Asgari et al., 2016; Holter et al., 2017; Jin et al., 2016).
Another brain clearance system model known as the “intramural periarterial drainage pathway” (IPAD) reports that the transport of ISF and solutes, but not cells, occur along the basement membranes of the capillaries and within the tunica media of arterioles and arteries in the opposite direction to the arterial blood flow, towards the cervical lymph nodes via major cerebral arteries in the neck (Bakker et al., 2016; Carare et al., 2008). For the IPAD system, vasomotion has been proposed to be the major motive force (Aldea et al., 2019). Since this fluid movement occurs at microscopic level along the arterial walls, it is currently unclear whether alterations in the IPAD system would correspond to an enlargement of MRI-visible PVS.
Additionally, it remains unclear how MRI-visible PVS relate to the clearance pathways external to the brain parenchyma, including: the arachnoid (or Pacchioni) granulations, which connects the subarachnoid space to the venous system; the meningeal lymphatics, lymphatic vessels located in the dura mater in proximity of the venous sinuses which drain to the extracranial deep cervical lymph nodes (Absinta et al., 2017; Aspelund et al., 2015); the perineural space along cranial and spinal nerves (Bradbury et al., 1981; Bradbury and Westrop, 1983; Kaminski et al., 2012a,b).
3. Imaging PVS structure
Given the high sensitivity of MRI in detecting cerebral fluid structural and biophysical properties, it is an ideal neuroimaging modality to capture PVS characteristics. PVS on structural MRI appear as tubular, fluid-filled structures. The principal locations of MRI-visible PVS include the basal ganglia and the whole white matter, with the highest prominence typically found in the centrum semiovale (i.e., the part of white matter superior to the lateral ventricles and corpus callosum) and the highest concentration (i.e., PVS-to-white-matter ratio) in the subinsular white matter (Barisano et al., 2021b). Other brain regions where PVS are visible on MRI include the hippocampus, midbrain, pons and the cerebellum (usually dentate nuclei and cerebellar white matter) (Osborn and Barisano, 2020). While the composition of the PVS fluid is not completely known, PVS on MRI typically have a signal intensity similar to that of CSF, i.e., low on T1-weighted and high on T2-weighted images, suggesting that the relaxation properties of the fluid inside PVS and CSF are comparable.
It should be noted that the visibility of PVS on MRI depends on the presence of fluid inside PVS; in fact, structural MRI allows for the visualization of the fluid inside PVS rather than the PVS themselves, which would have a different MRI signal profile, challenging to detect, if they were empty. Importantly, recent histological studies in pericytedeficient mice and patients with cerebral amyloid angiopathy (CAA) have shown that enlarged PVS may contain not only fluid but also proteinaceous material, such as fibrin/fibrinogen (Montagne et al., 2018), extracellular matrix and hemosiderin deposits (Perosa et al., 2022). Nevertheless, the influence of these deposits on the signal and visibility of PVS on in vivo MRI remains elusive.
PVS on MRI appear as lines when they are parallel to the image acquisition plane, and as dots when they are perpendicular to the image acquisition plane. Normally, PVS cross-sectional diameter on MRI is less than 2 mm (Rudie et al., 2018). As the blood vessels penetrate deeper in the cerebral parenchyma, the diameter of PVS decreases. The visibility of PVS on MRI is significantly affected by the magnetic field strength and the image resolution (Barisano et al., 2021a). In fact, while it might be difficult to visualize PVS with 1.5 Tesla MRI when they are not enlarged, higher magnetic field (≥ 3 Tesla) provides sufficient resolution and signal-to-noise ratio (SNR) to visualize PVS morphology virtually in all individuals, even in healthy adolescents and young adults (Barisano et al., 2021b; Piantino et al., 2020), where the MRI-visible PVS do not necessarily indicate an underlying pathology.
Despite histological studies that described PVS around both arteries and veins, some recent studies performed with 7 Tesla MRI suggest that the majority of MRI-visible PVS in the centrum semiovale are periarterial rather than perivenous (Bouvy et al., 2014; George et al., 2021; Jochems et al., 2020). The reason why perivenous spaces are less visible than periarterial spaces on MRI is currently unclear, but it might be related to the smaller size of perivenous spaces as well as differences in the amount and/or composition of the perivenous fluid. For example, perivenous space signal intensity might be similar to that of the adjacent cerebral parenchyma, making their visualization on MRI difficult. In CAA patients, the enlargement of PVS was also found to occur more frequently around arterioles rather than venules (Perosa et al., 2022).
3.1. Current methods for analyzing MRI-visible PVS
3.1.1. Visual rating scales
Visual rating scales have been thus far the most used approach to investigate PVS on MRI. In the past three decades, several types of visual rating systems have been adopted (Adachi et al., 1998; Adams et al., 2013; Di Costanzo et al., 2001; Doubal et al., 2010a; Duperron et al., 2018; Groeschel et al., 2006; Heier et al., 1989; Patankar et al., 2005; Potter et al., 2015a; Rouhl et al., 2008; Zhu et al., 2010a). Most of them classify PVS in different areas of the brain based on their count. For example, a commonly used system rates PVS in each region with the following scores: 0 if PVS are not visible, 1 if 1–10 PVS are visible, 2 for 11–20 PVS, 3 for 21–40, and 4 if > 40 are counted (Potter et al., 2015a). Typically, basal ganglia and centrum semiovale are independently scored. Sometimes other regions are assessed as well, including the mesencephalon, hippocampus, and the subinsular white matter. For each region, one or few slices (usually those including the highest number of PVS) are evaluated and PVS are scored separately on each side or hemisphere: the higher score among the two hemispheres is then utilized. Notably, PVS in basal ganglia are usually scored above the anterior commissurae, as PVS below it, in the anterior perforated substance, are not considered pathologic (Adachi et al., 1998; Groeschel et al., 2006; Heier et al., 1989; Jungreis et al., 1988; Kwee and Kwee, 2007; Potter et al., 2015a). In fact, these PVS reflect the entry of the lenticulostriate arteries from the subarachnoid space of the Sylvian cistern into the brain parenchyma and are commonly found on 1.5 Tesla and even more on 3 Tesla MRI in healthy people, including young and adults.
In some cases, the scoring system takes into account the PVS size as well (Di Costanzo et al., 2001; Ding et al., 2017; Heier et al., 1989). One recent study, for example, scored PVS based on the presence or absence of PVS with cross-sectional diameter larger than 3 mm, which they called large PVS (Ding et al., 2017).
Visual rating scales present several advantages: they are relatively easy to learn and adopt, can be used both on T1-weighted and on T2-weighted images, do not require a 3D or isotropic acquisition, and can be performed directly on the images without the need of specialized workstation or computational tools.
While these scoring systems provide a qualitative estimate of the extent of PVS burden, manual counting is still required to assign a rating and lacks granularity, particularly in cases where the PVS count is close to the limit threshold differentiating two categories (e.g., 20 which differentiates the scores 2 and 3 in the 5-scale rating system described above). Additional limitations of the visual rating scales are low sensitivity (Ballerini et al., 2018; Sepehrband et al., 2019a), the inter- and intra-rater variability, and the limited number of PVS features that could be derived. Moreover, the assessment of small PVS with visual scales remain difficult, the application of the visual scales on large datasets is burdensome, and counting PVS can be time-consuming (Wang et al., 2016). To overcome some of these issues, recently an automatic classifier for the rating of PVS burden in the basal ganglia as low or high was described: this system uses a support vector machine classifier on descriptors based on bag of visual words model, using keypoints obtained from a dense grid characterized with the scale-invariant feature transform (SIFT) characteristics (González-Castro et al., 2017). The achieved accuracy was approximately 80% (González-Castro et al., 2017).
3.1.2. PVS segmentation and morphometry
Recent technological advancements have allowed for the development of a number of automatic and semiautomatic PVS segmentation and quantification strategies (Ballerini et al., 2018; Boespflug et al., 2018; Cai et al., 2015; González-Castro et al., 2017; Park et al., 2016; Ramirez et al., 2015; Sepehrband et al., 2019a; Wuerfel et al., 2008; Zong et al., 2016). To the best of our knowledge, Descombes et al. (2004) were the first to perform a computer-aided segmentation of PVS. Their approach was based on the marked point process framework, which couples the typical tubular shape of PVS with their localization and tendency to cluster, and was optimized via the Markov chain Monte Carlo method (Descombes et al., 2004). Uchiyama et al. (2008) used the white top-hat transformation to enhance the intensities of tubular structures and extract them via intensity thresholding. A similar approach has been adopted more recently by several groups who employed the Frangi filter (Frangi et al., 1998) for the detection of tubular structures on 2D and 3D images (Ballerini et al., 2018; Park et al., 2016; Sepehrband et al., 2019a; Zong et al., 2016).
Wuerfel and colleagues were the first to perform a clinical study where the PVS were segmented (Wuerfel et al., 2008). They used a threshold-based semiautomatic method, originally developed for the quantification of brain lesions (Makale et al., 2002), where connectivity and threshold values were adjusted based on manually determined PVS (Wuerfel et al., 2008). Similar threshold-based approaches were adopted by Ramirez et al. (2011), who segmented PVS via a modified lesion extraction algorithm employing T1-weighted, T2-weighted, and proton-density (PD) weighted images, and by Wang et al. (2016), who were able to segment PVS on one single slice in centrum semiovale and in a manually-traced ovoid region of the basal ganglia after performing a linear intensity adaptive adjustment in 3 stages (normalization, gamma correction, and linear mapping).
Once the PVS have been segmented, several metrics and morphological features of PVS can be computed from the segmentation masks (Fig. 1). The PVS volume is one of these metrics, and provides an estimate of the amount of fluid present in the PVS. Since the PVS volume in healthy individuals is strongly correlated with the brain size (Barisano et al., 2021b), it is recommended to correct for it when implementing statistical models aimed at comparing PVS volumes across different individuals. It is also possible to compute the volume fraction of PVS in each brain region, calculated by dividing the total volume of segmented PVS cluster voxels in the region by the total volume of the region (Barisano et al., 2021b; Zong et al., 2016).
Fig. 1.

Examples of morphological characteristics computed on two MRI-visible PVS with different shapes: curved (PVS1) and straight (PVS2) (top and bottom rows, respectively). (a) MRI scans acquired from a healthy 25-year-old female subject at 7T with the protocol in Table 2. Masks (cyan) of the PVS examples were overlaid on the right images. (b) 3D representation of the PVS voxels (cyan cubes with black dots). (c) 3D representation of the PVS path (red line), i.e., the longest line connecting any two PVS voxels (cubes with black dots), and the voxels of the PVS path (cubes with red asterisks), computed to measure the mean cross-sectional diameter similar to Zong et al. (2016). The PVS voxels overlapping with the voxels of the corresponding PVS path are indicated by the cubes with both a red asterisk and a black dot. The overlap is higher in PVS2 than PVS1. Each PVS voxel is associated to the nearest voxel on the PVS path (cubes with the same color) and they are used to calculate the cross-sectional diameter. The voxels on the PVS path not associated to any PVS voxel are indicated by white cubes with red asterisks, while the last voxels on the PVS path are indicated by white cubes with both red asterisks and black dots. The cross-sectional diameter in each colored voxel on the PVS path (non-white cubes with red asterisks) is computed as per formula 1, where N is the number of PVS voxels associated to that voxel on the PVS path (i.e., PVS voxels with the same color as the corresponding voxel on the PVS path) and 1 is the mean distance between that voxel on the PVS path and its two neighbors voxels on the PVS path. (d) 3D representation of the PVS linearity, calculated similar to Boespflug et al. (2018): the blue line is the best fit line computed with singular value decomposition and the red lines are the norms connecting the center of each PVS voxel to the best fit line. The longer the norms are (i.e., the more the centers of the PVS voxels are distant from the best fit line), the less linear the PVS is. In this example, PVS1 is less linear than PVS2. (e) 3D representation of solidity based on the convex hull (red polygon) and its vertices (red dots on the voxels). The convex hull in PVS1 includes a large region with no PVS voxels, whereas in PVS2 the convex hull includes mostly PVS voxels. Solidity of PVS1 is therefore lower compared with PVS2.
The mean cross-sectional diameter is another important PVS feature that can be used to distinguish PVS from other lesions related to cerebral small vessel disease (CSVD) (Wardlaw et al., 2013). One approach to measure the mean cross-sectional diameter is the following (Zong et al., 2016). Each connected cluster of segmented voxels is defined as one PVS. Then, a thinning algorithm is applied to define the path of each cluster (Kerschnitzki et al., 2013; Lee et al., 1994). The Euclidean distance among all pair of voxels within a cluster is measured, and then the longest pathway between any two voxels within the thinned cluster is considered as the PVS path. For each voxel on the PVS path, the shortest path is measured by counting the number of voxels in the original cluster that were closer to that voxel than to any other voxel on the PVS path (Fig. 1c). Then, the diameter for each voxel x on the PVS path is calculated as: Fig. 1 where N is the number of voxels in the original PVS cluster associated with that voxel x on the PVS path, and l is the mean distance of the voxel x on the PVS path to its two neighbor voxels on the PVS path. Since the distance between the voxels on the PVS path does not change significantly, the main factor influencing the estimation of the mean cross-sectional diameter is the number of voxels associated to each voxel x. The last voxels on the PVS path are excluded from the diameter measurements since their diameters were artificially increased due to the thinning algorithm (Zong et al., 2016).
Another morphological characteristic that can be assessed in segmented PVS is the linearity, i.e., the resemblance of a specific PVS cluster to the tubular morphology. Boefsplug et al. recently presented an approach to assess PVS linearity. First, each segmented PVS cluster coordinate set (X) is subtracted by the mean of each cluster coordinate to localize the coordinates of PVS clusters and translate them to the origin. Then, singular value decomposition is used to define the central PVS cluster principal axis vector and the largest eigenvalue vector (V1) is calculated such that the cluster could be rotated around the principal axis V1 and the magnitude of perpendicular norm vectors from each cluster voxels coordinate to V1 (Xerr) is minimized, as in orthogonal regression. The coordinate of V1 that lays on the same norm vector is defined as . The minimum Euclidean distance to the origin is measured for each cluster coordinate in X and in , (Xdist and , respectively), and the Pearson correlation coefficient (r) between the two distance vectors Xdist and is measured. A coefficient r greater than 0.8 has been considered necessary for a PVS cluster to meet the linearity constraint (Boespflug et al., 2018). The closer the PVS voxels are to the principal axis vector, the higher the linearity of the PVS (Fig. 1d). This approach also allows to measure the maximum width of each PVS cluster, which is calculated as the sum of the largest norm, plus a norm whose vector has opposite direction in the same plane, plus the distance of corner-to-corner of the voxel (e.g., 1.7 mm for a 1 mm3 voxel). Based on the existing literature, 15 mm is considered the maximum width of a single MRI-visible perivascular space (Valdés Hernández et al., 2013).
Solidity is another morphological feature of PVS that can be derived from PVS segmentation masks: it corresponds to the shape complexity of PVS, where a low solidity tends to describe a more tortuous course and less compact shape, and is calculated as the ratio between the area/volume of the voxels of a single PVS and the area/volume of the smallest convex hull containing that single PVS (Fig. 1e).
The computation of PVS morphological features presents some limitations. Due to partial volume effects that result from low spatial resolution, the segmented PVS clusters may not provide accurate morphological feature estimates. In such cases, the use of a probabilistic segmentation approach overcomes some of the issues associated with partial volume effects (Kim et al., 2005). Another solution is to dilate the segmented cluster by 1 voxel, which results in a relatively conservative estimate of the overall PVS and limits the utility of pixel-wise evaluation of the segmented PVS cluster (Ballerini et al., 2018). It should be noted that most of the structural metrics of PVS are technically overestimated and comprise both the actual perivascular space and the enclosed vessel. In fact, the vessel inside the PVS is usually not visible on MRI due to partial volume effects, noise, their similar signal intensities especially on T1-weighted images, and the limited resolution (Barisano et al., 2021a; Bouvy et al., 2014). Imaging separately PVS and their enclosed vessel would grant a more precise estimate of PVS volume, which could be important for a better understanding of the physiology and functioning of PVS. The possibility to use time-of-flight angiography and susceptibility-weighted imaging at ultra-high field (UHF, ≥ 7 Tesla) to image the small penetrating arteries and veins (Barisano et al., 2019; Hendrikse et al., 2008; Kang et al., 2009; von Morze et al., 2007), respectively, enables exploration of the spatial correlation between PVS and their enclosed vessels. In addition, normal physiological changes of PVS in the same subject, such as potential effects of time-of-day, sleep, and hydration, may result in changes on morphometric estimates of PVS (Barisano et al., 2021b; Berezuk et al., 2015; Dickson et al., 2005; Kempton et al., 2009; Trefler et al., 2016).
3.1.3. Deep learning for PVS segmentation
As in recent years the availability of large neuroimaging datasets and high-resolution images increased significantly, data-driven methods like machine learning and deep learning have been frequently used for the PVS segmentation tasks. Ballerini et al. (2018) proposed a method to combine Frangi filter with PVS visual rating scales optimized by ordered logit model to segment PVS robustly. Zhang et al. (2017) utilized three types of vascular filter results with structured random forest to achieve the binary classification between the PVS and background. Convolutional neural network (CNN) is one of the commonly used neural network methods for image processing tasks. Lian et al. (2018) designed a multi-channel multi-scale CNN by recursively incorporating previous PVS segmentation maps as additional input channel to provide enriched contextual information for PVS segmentation. Sudre et al. (2018) extended the region-based CNN from 2D to 3D to achieve both the segmentation of extremely small objects and the classification of lacunes and enlarged PVS. An example of PVS segmented using Unet algorithm is shown in Fig. 2. A recent approach employed an unsupervised hybrid CNN model to enable PVS mapping in the absence of annotated data. This unsupervised method is composed of a Frangi filter as CNN with fixed gaussian kernels and Unet. The result of Frangi filter, which will be PVS saliency guidance, and the result of Unet are used as inputs of a conditional random field as the recurrent neural network to perform segmentation post-processing. This hybrid method increases PVS segmentation accuracy by increasing the true positive rate compared to filter-based methods and by decreasing the false positive rate compared to the CNN method (Lan and Sepehrband, 2021).
Fig. 2.
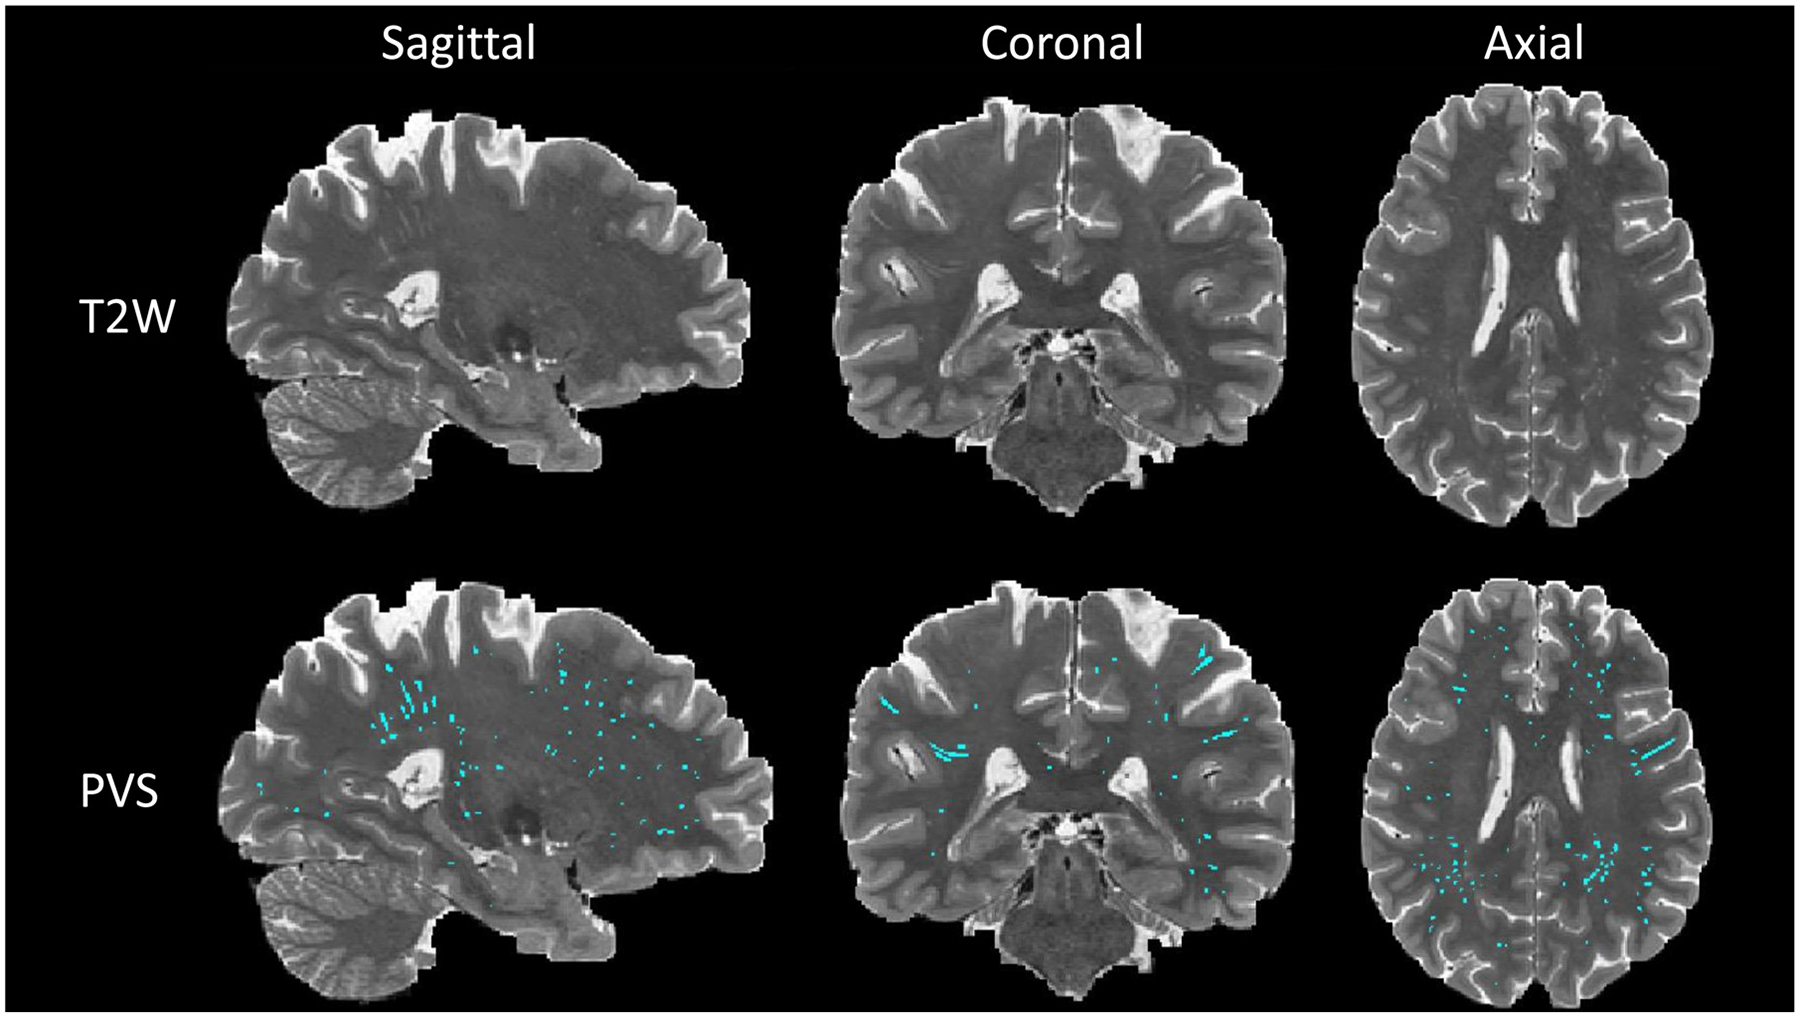
PVS map segmented by Unet algorithm. First row is the T2-weighted modality of one subject with sagittal, coronal, and axial view. Second row is the PVS map (cyan) overlaid on T2-weighted modality from the same subject. PVS map was generated using deep learning model Unet which was trained by supervised learning manner with manually annotated PVS map.
3.2. Limitations and how to overcome them
3.2.1. How to differentiate PVS from lesions
The identification and segmentation of PVS on structural MRI can be sometimes challenging, especially in the context of aging, CSVD, and other neurodegenerative conditions, as the presence of white matter hyperintensities (WMH), lacunes, and cysts can hide or mimic PVS. Knowing the anatomical distribution, structure, and the normal radiological appearance of PVS is critical for this task. In fact, the most important characteristics to distinguish PVS from other type of lesions are the signal intensity, shape, and location/distribution.
WMH appear hyperintense on fluid-attenuated inversion recovery (FLAIR) sequences, while PVS appear hypointense on FLAIR when visible. However, on T1-weighted and T2-weighted images, PVS and WMH have a similar signal intensity profile and therefore other characteristics need to be considered in order to distinguish them when FLAIR is not available. Similar to PVS, WMH tend to be symmetrically distributed, but the location could be different. WMH are frequently found in the periventricular area and follow the shape of the borders of the lateral ventricles, while MRI-visible PVS are usually not found around the lateral ventricles. WMH in the deep white matter (dWMH) can be found in areas where also PVS are visible and may have various appearance and sizes. When the dWMH size is relatively big (more than 5 mm) and the shape is irregular and not rounded or tubular, it is easier to define it as dWMH rather than as PVS, but the task becomes difficult in case of rounded/tubular dWMH with small size. In these cases, one way to distinguish dWMH from PVS consists in evaluating their relationship with the cortical layer: usually PVS in the white matter originate from the lower border of the cortical layer and advance towards the lateral ventricles, following the course of the penetrating vessels, whereas dWMH are usually not in direct contact with the cortical layer. Unfortunately, in some cases, it will still not be possible to confidently distinguish WMH from PVS, especially when FLAIR is not available.
Lacunes are defined as round or ovoid, subcortical, fluid-filled cavity consistent with a previous acute small subcortical infarct or hemorrhage in the territory of one perforating arteriole (Wardlaw et al., 2013). Their location, signal intensity, and sometimes shape are similar to PVS. However, they are usually larger than PVS (typically between 3 mm and about 15 mm in diameter, but they can be bigger), tend to be asymmetrical, and the shape is often not tubular as in PVS. Moreover, they are more common in the upper two thirds of the basal ganglia, whereas basal ganglia PVS on MRI are more commonly found in the lower third and closer to the anterior commissure (Benjamin et al., 2018). FLAIR can also be helpful to distinguish PVS from lacunes, since the latter may have a hyperintense rim thought to be related to reactive gliosis and/or siderosis, which are not usually found around PVS (Benjamin et al., 2018).
Since both lacunes and WMH can be frequently found in older adults, acquiring FLAIR images is recommended when studying PVS in this type of population.
These neuroradiological features are summarized in Table 1.
Table 1.
Main neuroradiological characteristics of perivascular spaces (PVS), white matter hyperintensities (WMH), and lacunes useful for differential diagnosis.
| Characteristic | PVS | WMH | Lacune |
|---|---|---|---|
| Signal intensity | |||
| T1w | Hypointense (CSF-like) | Hypointense (cortex-like) | Hypointense (CSF-like) |
| T2w | Hyperintense (CSF-like) | Hyperintense | Hyperintense (CSF-like) |
| FLAIR | Hypointense (CSF-like) | Hyperintense | Hypointense (CSF-like) |
| Size | Usually < 2 mm | Usually > 3 mm | Usually 3–15 mm |
| Shape | Tubular or dot-like, depending on the plane and the course of the vessel | Rounded, periventricular, or irregular | Variable: dot-like, triangular, irregular |
| Location | WM | WM | WM |
| BG (lower portion) | Periventricular | BG (upper portion) | |
| Distribution | Usually symmetric | Usually symmetric | Usually asymmetric |
| Course | Specific: | Aspecific. | Aspecific |
| BG: Lenticulostriate arteries | Tend to coalesce. | ||
| WM: Medullary arteries |
Abbreviations: Basal ganglia: BG; Cerebrospinal fluid: CSF; White matter: WM.
Brain cysts are fluid-filled lesions in the brain that can be related to different types of pathology, including neoplasia or infections. When brain cysts contain CSF, they have signal intensity similar to PVS, and since in some cases their shape may also emulate PVS, they can be considered PVS by the automated segmentation tools. While arachnoid cysts, a common type of CSF-filled brain cyst (Hall et al., 2019), are not usually segmented by automated software since they are typically located outside of the white matter, other types of cysts, such as those related to neurocysticercosis at the vesicular stage, may require manual deletion. Another type of cyst that could be mistaken for PVS on MRI are the hippocampal sulcus remnant cysts, also known as hippocampal cavities. These CSF-filled cysts, which can commonly be observed on MRI as incidental finding in the adult population, originate from an incomplete obliteration of the embryonic hippocampal fissure around which the hippocampal folding occurs (Bastos-Leite et al., 2006; Li et al., 2006). Since the signal intensity (CSF-like) and shape (round/ovoid) resemble those of PVS on MRI, they could be erroneously considered MRI-visible PVS. Characteristics that help differentiate these cysts from PVS include their location and course: they are typically located on the lateral side of the hippocampus between the cornu ammonis and the dentate gyrus and are not related to the hippocampal microvasculature.
3.2.2. Increasing PVS contrast
Increasing PVS contrast represents a promising solution to improve the visualization and therefore the quantification of PVS on MRI. In the last few years, several approaches have been developed to overcome visibility limitation. A recently developed technique enhances the PVS contrast at postprocessing stage, based on combining T1-weighted and T2-weighted images both preprocessed and filtered with a non-local mean filtering to remove high frequency spatial noise (Sepehrband et al., 2019a). This approach allows to visualize small PVS (< 1 mm of diameter) even in healthy populations (Barisano et al., 2021b). Hou et al. (2017) used the Haar transform of non-local cubes to amplify weak signal and remove noise by performing a block-matching 4D filtering before PVS segmentation. Alternatively, densely connected deep CNN have been shown to predict accurately the enhanced images without heuristic parameter tuning, and removing noise by considering contextual information derived from low-level to high-level features (Jung et al., 2019). When the FLAIR image is available, the identification and segmentation of PVS can be improved by excluding WMH and therefore reducing the amount of false positives PVS (Schwartz et al., 2019; Sepehrband et al., 2021). Sepehrband et al. (2021) examined PVS segmentation accuracy on 25 manually annotated MRI data, with and without FLAIR: they showed that specificity of PVS segmentation increases from around 65% to 90% when FLAIR data is utilized for removing the false positives in a cohort of individuals aged 65 and older, cognitively unimpaired or with mild cognitive impairment (MCI).
Another solution is to apply UHF technology (Barisano et al., 2021a). In particular, turbo spin echo sequences and 3-dimensional fast spin echo sequences have the advantage of isotropic spatial resolutions and short scan times (Zong et al., 2020) (Table 2).
Table 2.
Protocols employed at our institution for studying PVS structure and morphology at 3T and 7T MRI. Post-processing techniques to enhance the PVS contrast, such as Sepehrband et al., (2019a), can be applied on images acquired following these protocols.
| Field strength | Modality | Sequence | TR (ms) | TE (ms) | TI (ms) | FOV (mm) | Resolution (mm3) | Scan time (min:sec) |
|---|---|---|---|---|---|---|---|---|
| 3 Tesla | T1w | 3D MPRAGE | 2400 | 2.14 | 1000 | 224×224 | 0.7 isotropic | 7:40 |
| T2w | 3D SPACE | 3200 | 565 | 224×224 | 0.7 isotropic | 8:24 | ||
| 7 Tesla | T1w | 3D MPRAGE | 2200 | 2.95 | 1000 | 224×224 | 0.7 isotropic | 6:33 |
| T2w | 3D SPACE | 4000 | 118 | 224×224 | 0.7 isotropic | 6:52 |
Fig. 3 reports an example of PVS automated segmentation performed after increasing PVS contrast on T1-weighted and T2-weighted images acquired at UHF using a PTX coil (Nova 8Tx/32Rx).
Fig. 3.
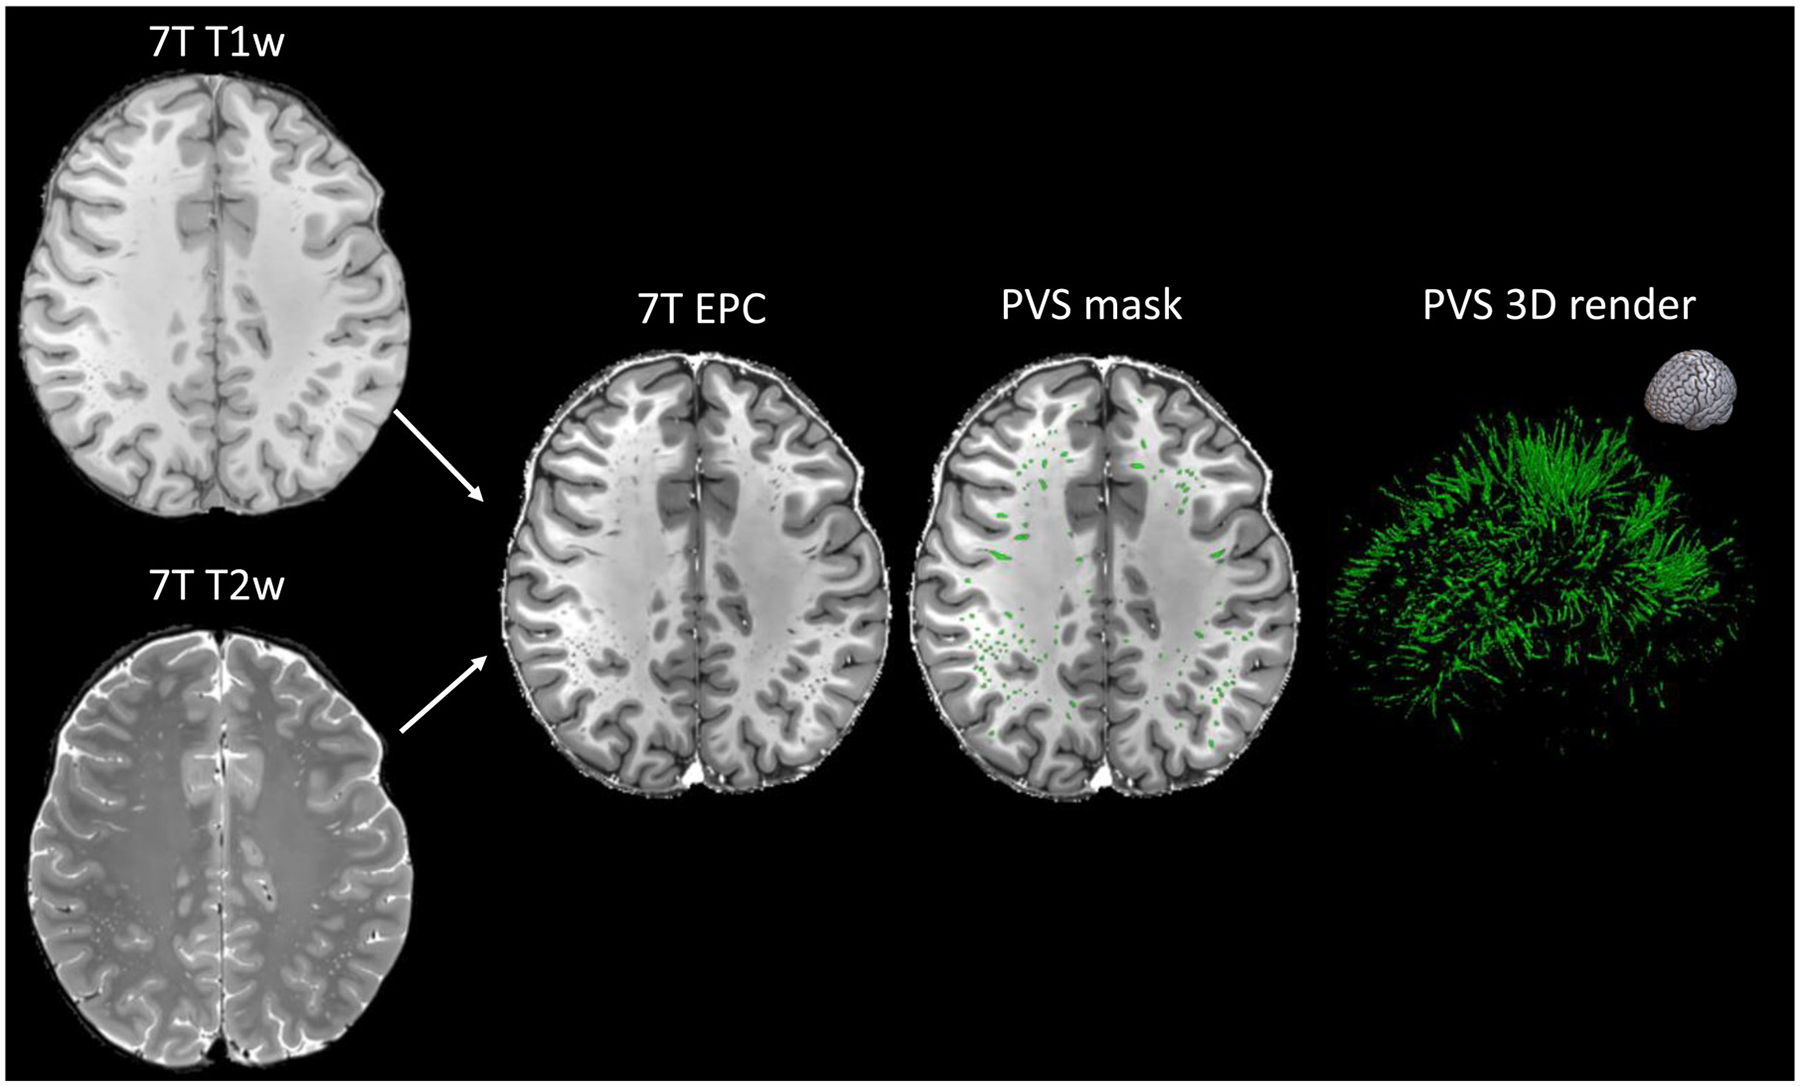
Example of enhanced PVS contrast (EPC) post-processing technique (Sepehrband et al., 2019a) applied on T1-weighted and T2-weighted images acquired from a healthy 25-year-old female subject at 7T MRI with the protocol in Table 2. The T1-weighted, T2-weighted, and EPC images are shown on the left column and the PVS mask was overlaid in the center (green). The image on the right is the corresponding 3D map of the PVS masks. The orientation of the 3D map is reported on the top right corner.
4. Imaging PVS function
4.1. Imaging fluid flow dynamics
In addition to the structural properties of PVS, another important element that can be analyzed and imaged in vivo are PVS fluid flow dynamics, which is relevant for the investigation of the physiological and pathophysiological processes affecting the perivascular transport. While the mechanisms underlying the movement of the fluid in PVS are still not fully understood, recent studies have shown that arterial pulsations drive the fluid movement in PVS (Iliff et al., 2013b; Mestre et al., 2018). The direction of the net flow in PVS is the same as the blood flow and the velocity decreases towards the PVS walls and arterial bifurcations (Mestre et al., 2018). Other factors such as respiratory movement (Dreha-Kulaczewski et al., 2015; Sepehrband et al., 2021; Zong et al., 2020) and the sleep–wake cycle (Ramirez et al., 2015; Xie et al., 2013) may also contribute to the PVS fluid flow dynamics. Studies in animal models allow to investigate in vivo the fluid flow in PVS and the IPAD through techniques such as two-photon microscopy and particle tracking velocimetry. These approaches are unfeasible for human studies and the implementation of MRI-based tools that could potentially be used to explore the perivascular flow in humans is currently being investigated.
Phase-contrast MRI measures CSF and blood flow dynamics, as well as vascular pulsatility in the brain noninvasively and without the need of contrast injection (Sakhare et al., 2019). Recent studies have shown that higher vascular pulsatility in venous sinuses is associated with higher visibility of PVS in basal ganglia and lower CSF stroke volume in foramen magnum, suggesting that alterations in cerebrovascular pulsatility influence the movement and drainage of perivascular fluid (Blair et al., 2020; Shi et al., 2020). Currently, the most common anatomical location for quantifying CSF flow is the sylvian aqueduct at the level of the foramen magnum, but it is possible that in the future a similar approach could be used to measure the fluid flow directly in PVS.
Contrast-enhanced MRI with intrathecal administration of gadolinium-based contrast agents has been recently used to assess the glymphatic function and CSF flow in the rat and human brain. In rats, the MRI protocol employs a dynamic acquisition of 3D T1-weighted images acquired continuously for 4–6 h (1 image acquired approximately every 5 min) with 3 baseline pre-contrast scans followed by the slow infusion of 80 μl of the paramagnetic agent delivered intrathecally (infusion rate of 1.6 μl per min, total infusion time of 50 min). The time courses of signal intensity changes in the paravascular and parenchymal compartments (segmented via a k-means cluster algorithm) are subsequently used to estimate the contrast agent clearance rate constant as an estimate of the glymphatic CSF-ISF exchange and solute clearance (Iliff et al., 2013a; Jiang et al., 2017). This approach was able to show a lower clearance rate in type-2 diabetes mellitus rats compared with non-diabetic rats (Jiang et al., 2017).
In humans, recent studies adopted a semi-quantitative approach measuring the changes in T1-weighted signals after intrathecal administration of gadobutrol and MRI acquisitions at multiple timepoints, including pre-contrast and multiple post-contrast acquisitions in the following days. The glymphatic activity was estimated as the time required to clear the tracer from several regions in the brain, where a delayed clearance has been interpreted as lower glymphatic activity (Ringstad et al., 2017; Watts et al., 2019). So far, this technique has been used mainly in the context of idiopathic normal pressure hydrocephalus and idiopathic intracranial hypertension (Eide et al., 2021a; Eide and Ringstad, 2018), and a more widespread use of it is limited by the need of using a gadolinium-based contrast agent and performing an intrathecal injection.
Dynamic positron emission tomography (PET) with radionuclide injected intravenously or intrathecally has also been used to investigate the main clearance and drainage pathways of PVS fluid (Cogswell et al., 2020; de Leon et al., 2017), although the limited anatomic resolution of PET scans does not currently enable the visualization of the details of the perivascular system.
4.2. Diffusion imaging of PVS
Diffusion MRI (dMRI) is a non-invasive imaging method that is sensitive to the displacement pattern of diffusing water molecules. dMRI uses magnetic field gradients applied in multiple directions to sample the local micro-environment in the brain and, due to the structural barriers imposed by cell membranes within different tissues, possesses the unique ability to encode orientational information and differentiate microstructural tissue features. dMRI techniques are traditionally used to model white matter structure, owing to the structural coherence offered by white matter bundles; however, dMRI methods can also be used to evaluate PVS fluid dynamics. PVS possess a microscopic tubular geometry that encompasses the extra-vascular space (Akashi et al., 2017; Bouvy et al., 2014) and water molecules of the ISF diffuse freely along the length of the PVS. Information about ISF diffusion within the PVS can provide insight into PVS microstructure, including pathological enlargement of the PVS, or function, such as disruption of glymphatic flow due to presence of debris. Diffusion also occurs between PVS and the extra-cellular space of the surrounding parenchyma and can provide information regarding the efficacy of glymphatic influx and efflux mechanisms. Therefore, dMRI represents an ideal candidate for the analysis of PVS structure and function due to its sensitivity to patterns of water diffusion behaviors without the use of invasive contrast enhancement. Here, we highlight recent efforts towards the characterization of PVS fluid dynamics with the use of diffusion-weighted MRI utilizing single shell DTI acquisition, multi-compartment modeling, and novel acquisitions sensitized to water diffusion properties of PVS.
Diffusion tensor imaging (DTI) is the most commonly used dMRI model that quantifies the degree of anisotropic water diffusion within a voxel using an ellipsoid representation and generates indices sensitive to tissue microstructure, including fractional anisotropy (FA) and mean diffusivity (MD). DTI analysis along the perivascular space (DTI-ALPS) is a popular approach to infer diffusivity properties within PVS by leveraging the relative geometric organization of white matter tracts and vasculature (Taoka et al., 2017). DTI-ALPS isolates the contribution of PVS diffusivity by comparing the diffusion properties in the direction of medullary arterioles and veins to that in the direction of association and projection fibers perpendicular to the vasculature. Therefore, a given change in the diffusivity parallel to the PVS in both major fiber bundles, quantified as the ALPS index, likely reflects a significant contribution of PVS fluid flow to the diffusion signal and may be considered a measure of PVS diffusivity. Compared to controls, previous DTI-ALPS studies have found decreased ALPS index along the medullary vessels in patients with Alzheimer’s disease (AD) (Steward et al., 2021; Taoka et al., 2017), idiopathic normal pressure hydrocephalus (Bae et al., 2021; Yokota et al., 2019), type 2 diabetes mellitus (Yang et al., 2020) and Parkinson’s disease (PD) (Chen et al., 2021; McKnight et al., 2021). These findings point towards a significant influence of water diffusion and impaired fluid flow dynamics along the PVS in patients with neurological conditions; however, it is difficult to disentangle the diffusion effects of PVS from those that arise from water molecule motion in white matter tracts parallel to the PVS. Furthermore, mono-exponential models, such as DTI, reflect diffusion properties of both the tissue and fluid, thus further obscuring the precise contribution of the PVS to the measured diffusion signal.
An approach that overcomes the issue of non-specificity in DTI interpretations is multi-compartment modeling, which acquires diffusion-weighted images at multiple b-values, or gradient strengths, to probe separate tissue compartments characterized by different diffusion profiles. In comparison to the slow, hindered diffusion observed in the brain parenchyma, diffusivity within PVS is relatively fast in the direction parallel to the PVS, but is hindered by the barriers formed by the vessel walls and cerebral tissue. Therefore, multi-compartment models can be leveraged to quantify the characteristic diffusion profile of PVS. Indeed, several studies that utilize multi-compartment models have demonstrated how the presence of PVS in white matter can systematically bias the estimated DTI metrics. In separate studies using a bi-exponential model (Pierpaoli and Jones, 2004) to estimate the compartment diffusion signal contributions to DTI metrics, increases in MD and FA were driven by an increase in the CSF-like free water compartment, which may be due to homeostatic modulation of glymphatic CSF flow and the presence of enlarged PVS (Sepehrband et al., 2019c; Thomas et al., 2018). Furthermore, the influence of PVS presence on DTI estimates may have ramifications for the interpretation of findings. Significant differences in DTI metrics between cognitively unimpaired subjects and patients with MCI are rendered non-significant after considering the effects of the PVS signal fraction, suggesting diffusion alterations related to cognitive decline are due to alterations in PVS and not white matter integrity (Sepehrband et al., 2019b,c). Additional considerations for quantifying PVS diffusion properties with multi-compartment approaches include the manner in which the PVS fluid compartment is estimated. Thomas et al. (2018) models diffusion within the PVS as fast and isotropic, due to similarities with the CSF free water signal. However, Sepehrband et al. (2019c) found diffusivity within the PVS compartment, while greater than that of white matter, is anisotropic. Perivascular water diffusion is likely anisotropic because it is confined by tissue parenchyma and vessel walls, forming hindered fluid pathways that are aligned with white matter tracts (Doucette et al., 2019) and previous histological studies demonstrate vascular anisotropy (Cavaglia et al., 2001; Duvernoy et al., 1981). In addition, the “free water” model assumes a fixed diffusivity of 3 mm/mm3 for the fluid compartment, however, PVS fluid diffusivity is most likely not constant and could vary based on the macromolecule concentration in the fluid.
Multi-compartment models also provide a powerful tool to evaluate perivascular CSF-ISF fluid exchange with the brain parenchyma. Utilizing neurite orientation dispersion and density imaging (NODDI) (Zhang et al., 2012), authors found significantly greater free water in PVS and significantly reduced free water in the brain parenchyma adjacent to PVS compared to white matter regions with no MRI-visible PVS in healthy adults, but not in CSVD patients (Jiaerken et al., 2021). The reduced free water in the brain parenchyma may reflect the efficient elimination of ISF adjacent to the PVS, thus resulting in a smaller free water fraction compared to non-adjacent white matter regions. To understand the cellular mechanisms that give rise to dysfunctional CSF/ISF fluid exchange in the PVS, Debaker and colleagues explored how water diffusivity is altered following inhibition of aquaporin 4 (AQP4) (Debaker et al., 2020), Ca2+-dependent water channels that are located on the perivascular endfeet of astrocytes and facilitate the solute flux from PVS into the parenchyma (Iliff et al., 2012). AQP4 inhibition was accompanied by a significant reduction in the shifted water diffusion coefficient (sADC) and signature index (S-index), diffusion markers sensitive to hindrance effects in both Gaussian and non-Gaussian diffusion (Iima and Le Bihan, 2015; Pérès et al., 2018), which is consistent with an increase in parenchymal ISF. Currently, however, it remains unclear whether these metrics may be used to assess glymphatic function.
Several acquisition and modeling decisions should be considered for the quantification of diffusion characteristics in PVS (Table 3). Diffusion-weighted images acquired with a low b-value provides increased sensitivity to CSF dynamics and fast diffusion in PVS (Taoka et al., 2019). High b-values, on the other hand, are sensitized to non-gaussian diffusion behaviors that are dominant in restricted compartments of the intracellular space and provide reduced SNR to free water compartments (Assaf et al., 2004; Novikov et al., 2019; Sepehrband et al., 2017). However, diffusion signals acquired with low b-value are susceptible to physiological pulsations and perfusion effects, which can in turn affect PVS diffusivity (Harrison et al., 2018; Iliff et al., 2013b; Le Bihan, 1990; Le Bihan et al., 1988). For example, a recent study utilizing a low b-value and ultra-long echo time diffusion acquisition found diffusivity within the PVS was 300% greater during cerebral arterial pulsations relative to diastole, suggestive of the prominent role of vessel pulsatility on PVS fluid movement (Harrison et al., 2018). Additionally, intra-voxel incoherent motion (IVIM) of blood perfusion in the capillary networks can contribute to dMRI signal attenuation at low b-values because the pseudo diffusion coefficient of blood is larger than the water diffusion coefficient. Recently, methods have been developed to distinguish the diffusion signal contributions of water and blood. IVIM imaging is one such example that uses data collected at low b-values to model perfusion-related signals due to microvasculature and diffusion-related signals in parenchymal microstructure as separate compartments (Wong et al., 2017). Recently, this method has been extended using the non-negative least squares (NNLS) approach to model the intermediate diffusion volume fraction believed to reflect dilated PVS (Wong et al., 2020). Further studies are needed to better understand the robustness of these novel techniques in separating the perfusion-related signals to dMRI signal.
Table 3.
Suggested protocols for studying PVS with diffusion MRI in preclinical, clinical, and ultra-high field studies.
| Parameter | Ultra-high field MRI in animal models (Harrison et al., 2018) | Ultra-high field MRI in humans (Barisano et al., 2021a) | Clinical field IVIM scan (Wong et al., 2020) | Considerations |
|---|---|---|---|---|
| Pulse sequence | Fast spin echo (FSE) with 180° refocusing pulse | Pulsed gradient spin echo EPI | Single-shot spin echo EPI | FSE accommodates long effective TE; single-shot EPI enables IVIM imaging |
| Magnet strength | 9.4 T | 7 T | 3 T | UHF MRI provides better SNR and higher spatial resolution compared to high-field MRI |
| b-value | 107 s/mm2 | 0, 200, 400, 600, 800 s/mm2 | 0, 5, 7, 10, 15, 20, 30, 40, 50, 60, 100, 200, 400, 700*, 1000* s/mm2 | Several low b-values between 0 and 1000s/mm2 enables more precise measurement of PVS fluid flow |
| TR | 5000 ms | 4400 ms | 6800 ms | Long TR provides better weighting for signal derived from CSF and interstitial fluid |
| TE | 16 echoes per excitation with effective TE of 142 | 65 ms | 84 ms | Long effective TE is preferable to attenuate arterial blood signal |
| TI | NA | NA | 2230 ms | TI prior to acquisition suppresses CSF contamination |
| Voxel size | 0.2 × 0.2 × 0.8 mm3 | 1.3 mm isotropic | 2.4 mm isotropic | Small voxel sizes (<1 mm) are preferable to resolve the small structure of the PVS |
| Matrix size | 128×128 | 184×184 | 92×112 | |
| Diffusion-encoding directions | 3** | 30 | 1 | Multiple diffusion-encoding directions increase sensitivity to perivascular fluid flow |
High b-value scans were averaged to form one volume to increase SNR.
Phase encoding direction aligned with middle cerebral artery axis.
Other biological factors that can influence PVS diffusivity that should be considered in future analyses include vascular and axonal geometry (Doucette et al., 2019), PVS convective flow (Holter et al., 2017), and presence of pathological fluid-filled tissue in white matter, including cerebral microbleeds and lacunar infarcts (Bouvy et al., 2020). Furthermore, clinically feasible dMRI has reduced spatial resolution compared to structural MRI. Because the mean cross-sectional diameter of PVS is less than 2 mm, dMRI images of PVS are particularly susceptible to partial volume effects and necessitates the use of multi-modal approaches to spatially localize PVS. Lastly, the functional significance of perivascular flow with dMRI is not well defined, as dMRI measures cannot accurately detect glymphatic failure and it is unclear how perivascular diffusivity is influenced by pathology. Therefore, dMRI methods should be used in combination with other structural and functional imaging techniques to obtain a comprehensive understanding of fluid flow dynamics within the PVS.
5. Neuroimaging PVS in humans
5.1. MRI-visible PVS across the normative lifespan
Over the past decade, technological advancements in MR imaging have facilitated the study of PVS structure in health and disease. While previously considered a marker of neurological disease, the gain in SNR and/or spatial resolution achieved with novel MRI sequences and higher magnetic field scanners allowed the detection of a higher number of PVS compared with older studies. MRI-visible PVS are nowadays easily detectable also in healthy individuals and they do not necessarily indicate a pathological enlargement. Several neuroimaging studies have demonstrated that a greater number of PVS are observed in the elderly (Laveskog et al., 2018; Zhu et al., 2011) and increases with advancing age (Barisano et al., 2021b; Francis et al., 2019; Gutierrez et al., 2013; Huang et al., 2021; Laveskog et al., 2018; Ramirez et al., 2015; Yakushiji et al., 2014; Zhu et al., 2010b, 2011) (Fig. 4).
Fig. 4.
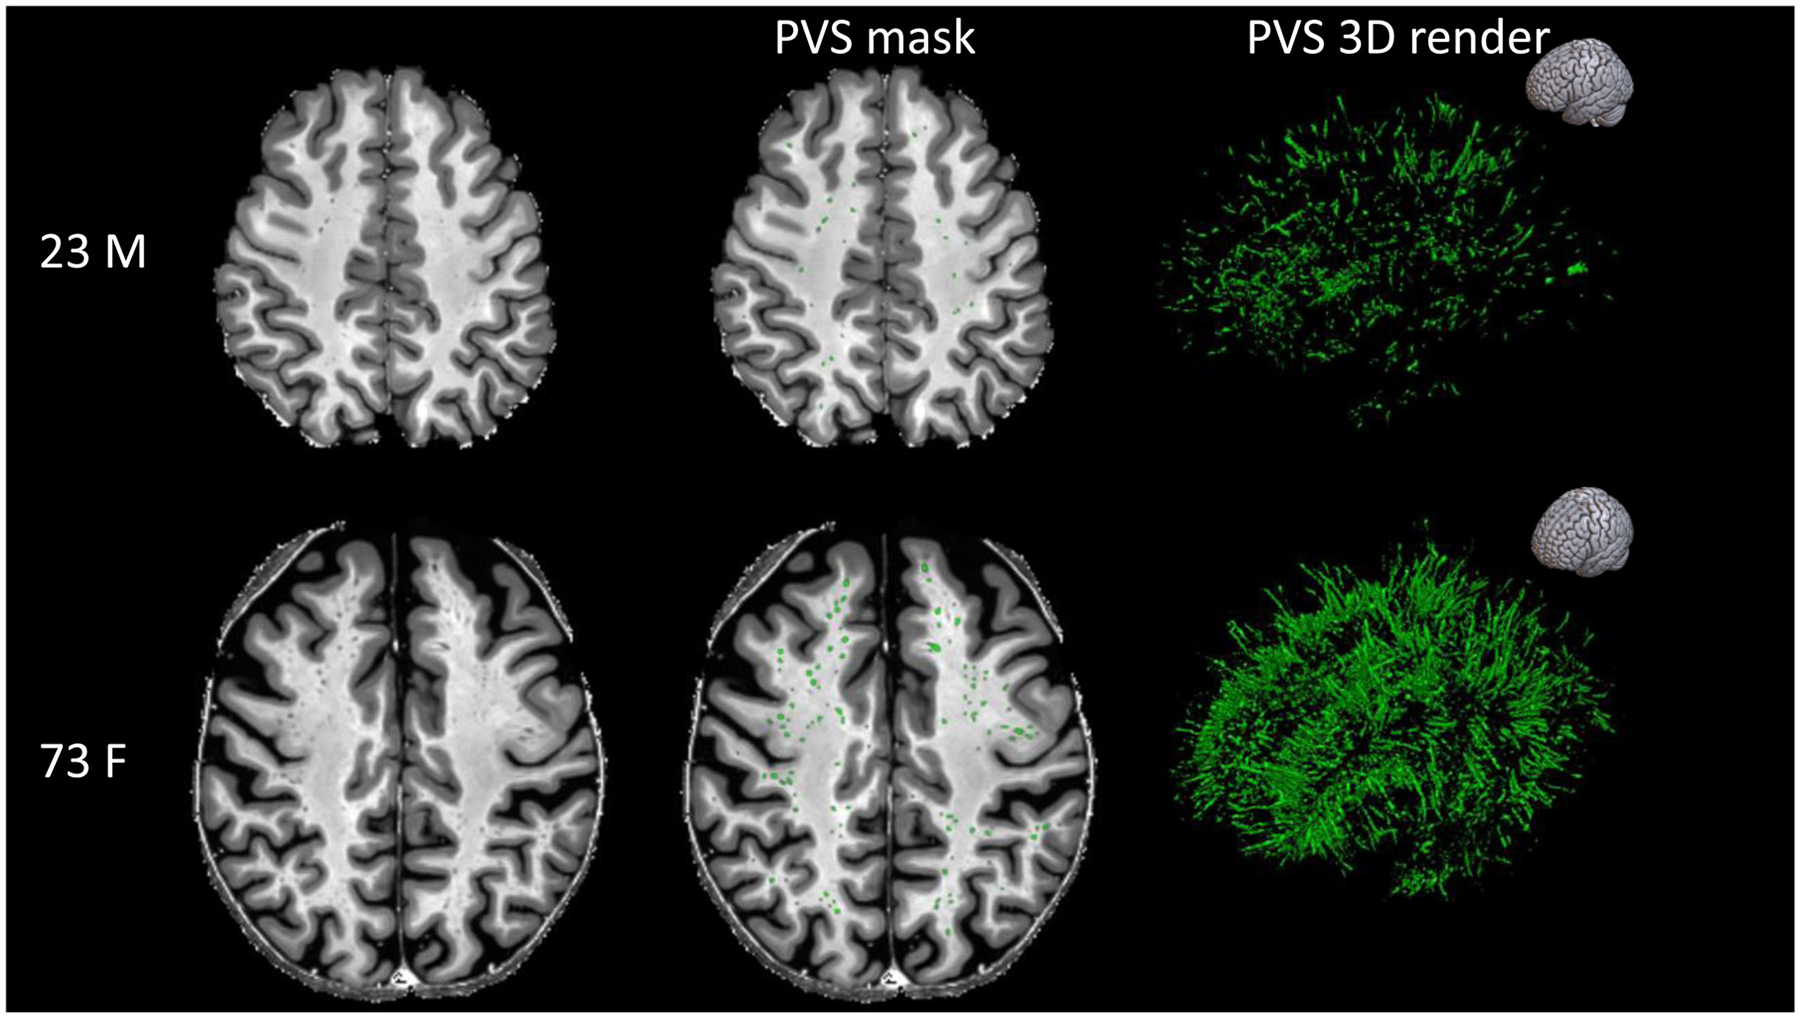
Examples showing the higher number and total volume of MRI-visible perivascular spaces (PVS) in healthy participants with different ages. The participant on the top is a 23-year-old male, while the participant on the bottom is a 73-year-old female. The MRI scans are shown on the left column and the PVS masks were overlaid in the center (green). The images on the right are the corresponding 3D maps of the PVS masks. The orientation of the 3D maps is reported on the top right corner.
MRI-visible PVS are detectable in considerable numbers in young adults (Barisano et al., 2021b) and were also observed in a much larger proportion of adolescents (Piantino et al., 2020) than previously described (Groeschel et al., 2006; Rollins et al., 1993), which may be attributed to improvements to the spatial resolution afforded with clinical MRI. A recent study sought to characterize the trajectory of PVS morphology from childhood through advancing age and found PVS increases nonlinearly with age across the lifespan. Furthermore, age-related changes to PVS morphological features in the white matter and basal ganglia follow different time courses, which suggests normative PVS trajectories are structure-specific (Lynch et al., 2020). In general, white matter regions with high PVS burden in childhood, such as cingulate regions, tend to change minimally over the lifespan, while regions with low PVS burden in childhood, including temporal white matter, undergo rapid enlargement. Together, these findings may indicate a preferential vulnerability of some brain regions to pathological PVS enlargement with age.
The relative distribution of MRI-visible PVS across the lifespan does not appear to change, with the highest PVS burden observed in frontal and parietal lobes in adolescents (Piantino et al., 2020), young adults (Barisano et al., 2021b), and aging (Laveskog et al., 2018). Additionally, the distribution of PVS between the hemispheres in adolescents (Piantino et al., 2020) and the elderly (Laveskog et al., 2018) is generally symmetric, although asymmetries in certain brain regions are possible (Barisano et al., 2021b). There is high inter-individual variability regarding the amount of MRI-visible PVS in the normative brain, which may be partly explained by sex, body mass index (BMI), systolic blood pressure, time of day and genetic factors (Barisano et al., 2021b; Zhu et al., 2010b). PVS burden is also significantly associated with larger intracranial volume (Barisano et al., 2021b; Huang et al., 2021). It has been suggested that larger craniums requires larger vasculature to supply blood to the brain, which would result in more and/or bigger MRI-visible PVS (van der Zwan et al., 1993); however, it is also possible that larger brain volumes can simply accommodate more PVS.
Recently, several groups looked at the association between personal lifestyle and MRI-visible PVS. For example, some studies found that sleep quality and sleep efficiency are associated with higher MRI-visible PVS burden (Aribisala et al., 2020; Berezuk et al., 2015; Del Brutto et al., 2019), which was also found associated with sleep disorders, such as obstructive sleep apnea (Song et al., 2017). The clinical implications of these findings are currently not known, but it is interesting to consider them in the context of other sleep-related results. For example, recent studies showed decrease in the clearance of a gadolinium-based contrast agent administered intrathecally in individuals with chronic poor sleep quality (Eide et al., 2022a) and even after a single night of total sleep deprivation (Eide et al., 2021b). Moreover, an increase in Aβ in PET imaging and higher Aβ in lumbar CSF were observed after one night of sleep deprivation or deep sleep interruption (Ju et al., 2017; Shokri-Kojori et al., 2018). The circadian dynamic nature of PVS has also been suggested by a recent study showing that the visibility of PVS on MRI is influenced by the time of day, where a higher amount of MRI-visible PVS was measured at later time of day (Barisano et al., 2021b). These observations point towards a critical role of sleep for an efficient glymphatic activity, which can result in morphological alterations of MRI-visible PVS.
Recently, BMI has also been found associated with PVS volume in healthy young adults, and this association was different based on the sex of the individuals (Barisano et al., 2021b). Similarly, Ozato et al. (2021) showed that visceral fat was associated with MRI-visible PVS and white matter lesions. The mechanistic link between BMI and PVS is not known, but it is possibly related to higher intracranial pressure (Barisano et al., 2021b), as linear positive relationship exists between CSF pressure and BMI (Berdahl et al., 2012), and/or to a reduced vascular contractility and vascular dysfunction, which is often found in obese people (Stapleton et al., 2008). That intracranial pressure might influence the burden of MRI-visible PVS has also been argued by a recent study in astronauts and cosmonauts showing enlargement of MRI-visible PVS after long-duration spaceflight on the International Space Station (Barisano et al., 2022), as prolonged spaceflight is associated with some radiological and clinical findings suggestive of high intracranial pressure, including pituitary gland deformity (Kramer et al., 2020), ventricular enlargement (Barisano et al., 2022; Jillings et al., 2020; Koppelmans et al., 2016; Kramer et al., 2020; Roberts et al., 2017; Van Ombergen et al., 2018, 2019), optic disk edema and posterior flattening of the optic globe (Mader et al., 2011). Further studies should investigate whether intracranial pressure affects the visibility of PVS on MRI and the flow of the PVS fluid, as it will provide a better understanding of the cerebrospinal fluid dynamics and clearance systems with important clinical implications for a number of neurological disorders.
5.2. MRI-visible PVS in disease populations
MRI-visible PVS burden is associated with several neurological conditions, including neurodegenerative, neurovascular, and neuroinflammatory diseases. Below, we discuss accumulating evidence from MRI studies that sought to understand the influence of PVS burden on neurological disorders and their associated symptoms. Despite the substantial variation in segmentation approaches, methodologies, and populations, converging evidence suggests the influence of PVS enlargement on neurological diseases differs across anatomical structures. For example, amyloidopathies and neuroinflammatory conditions are most strongly associated with PVS enlargement in the subcortical white matter, while neurovascular disease and neurodegenerative disorders such as PD predominantly affect PVS structure in the basal ganglia. These differences may suggest the pathophysiological mechanisms that give rise to PVS enlargement may differ according to their spatial location.
5.2.1. Vasculopathies
Enlarged PVS are traditionally considered MRI biomarkers of CSVD, that encompasses arteriole and venule vasculopathies that commonly accompany stroke or cognitive decline and has a high comorbidity with other neurodegenerative diseases (Wardlaw et al., 2013). The prevalence of severe MRI-visible PVS, especially in the basal ganglia, is significantly associated with lacunes, WMH load and progression, and cerebral microbleeds (Charidimou et al., 2013; Ding et al., 2017; Doubal et al., 2010b; Laveskog et al., 2018; Potter et al., 2015b). Several studies showed that hypertension is also associated with MRI-visible PVS preferentially in the basal ganglia, but not white matter (Dubost et al., 2019; Francis et al., 2019; Gutierrez et al., 2013, 2017; Martinez-Ramirez et al., 2013; Yakushiji et al., 2014; Zhu et al., 2010b).
That PVS enlargement in the BG, but not white matter, is associated with CSVD and hypertension may be attributed to structural and functional vascular differences. However, future studies should seek out the precise pathophysiological mechanisms that contribute to the unique vulnerability of PVS in the basal ganglia to CSVD.
5.2.2. Amyloidopathies and other proteinopathies
There is broad evidence to support amyloidopathies, which encompass a variety of neurodegenerative disorders characterized by atypical deposition of Aβ in the brain, are preferentially associated with PVS enlargement in the subcortical white matter. AD is significantly associated with higher MRI-visible PVS volume (Cai et al., 2015; Ramirez et al., 2015), count (Roher et al., 2003), and visually-rated severity (Banerjee et al., 2017; Chen et al., 2011) in the subcortical white matter. In a study that utilized an automated segmentation strategy, patients with MCI had a higher PVS volume fraction compared to cognitively unimpaired controls in the centrum semiovale of the white matter, but only in females, and a lower PVS volume fraction in the anterosuperior medial temporal lobe (Sepehrband et al., 2021). Furthermore, MRI-visible PVS burden increases with age in normal aging adults and patients with MCI, but not in patients with AD (Chen et al., 2011), which suggests PVS alterations associated with dementia arise prior to the clinical onset of symptoms. Nevertheless, the association between MRI-visible PVS and cognitive decline remains unclear. In fact, several studies did not find significant associations between MRI-visible PVS burden and cognition (Hilal et al., 2018; Hurford et al., 2014; Yao et al., 2014). Further investigation of the relationship between MRI-visible PVS and cognitive function is warranted to better understand the clinical significance and implications of the PVS burden on MRI.
CAA is a neurodegenerative CSVD characterized by Aβ deposition in cerebral arteries. Previous studies have demonstrated that, like AD, CAA is characterized by a significantly greater burden of PVS in white matter compared to controls (Charidimou et al., 2014; van Veluw et al., 2016). Strictly lobar microbleeds, which are more characteristic of CAA than vascular arteriopathy, are significantly associated with higher PVS severity in the white matter, but not the basal ganglia (Charidimou et al., 2017; Martinez-Ramirez et al., 2013).
A major undertaking of the glymphatic system is clearance of toxic metabolic waste from the brain, including Aβ. Therefore, Aβ deposition observed in amyloidopathies may be related, at least in part, to inefficient glymphatic drainage reflected by pathological enlargement of the PVS (Tarasoff-Conway et al., 2015). However, evidence of the relationship between Aβ deposition and PVS pathology in AD and CAA are less clear. In one study using a visual rating scale, PVS severity was not associated with PET-PiB (Banerjee et al., 2017). In another study, lower PVS volume fraction in the medial temporal lobe of MCI patients was not associated with amyloid-PET uptake, but was independently associated with Tau-PET uptake, a separate pathological feature of AD (Sepehrband et al., 2021). In a histological study, the frequency and severity of enlarged PVS was positively associated with cortical Aβ (Roher et al., 2003).
In patients with CAA, whole-cortex PET-PiB binding was positively associated with PVS burden in the white matter (Charidimou et al., 2015). Combined postmortem MRI and histological studies further demonstrated that PVS dilation was associated with cortical CAA severity (van Veluw et al., 2016) and vascular Aβ accumulation in the overlying cortex (Perosa et al., 2022), and was not significantly associated with the presence of parenchymal Aβ plaques (van Veluw et al., 2016). These findings suggest that vascular rather than parenchymal Aβ deposition might lead to PVS enlargement. Future studies should aim to further investigate the relationship between Aβ and PVS to better understand the perivascular clearance mechanisms and whether a failure of Aβ clearance along the vessel represents a cause or a consequence of the Aβ deposition, has any direct clinical implications, and could be repaired or prevented.
There is abundant evidence from histological and neuroimaging case studies that show pathological PVS dilation in the basal ganglia of patients with PD, particularly within the putamen and pallidum (Conforti et al., 2018; Duker and Espay, 2007; Fénelon et al., 1995; Lee et al., 2015; Mancardi et al., 1988; Mehta et al., 2013). Additionally, a recent study found that PVS in certain regions of the subcortical white matter is also associated with PD diagnosis (Donahue et al., 2021).
Several studies have demonstrated a relationship between PVS burden and symptom severity in patients with PD, including cognitive impairment (Lee et al., 2015; Park et al., 2019; Shibata et al., 2019) and motor symptoms (Laitinen et al., 2000; Mestre et al., 2014; Wan et al., 2019). However, there is limited evidence that suggests PVS enlargement is related to the pathophysiological mechanisms of PD. In one study utilizing PET, PVS severity in the basal ganglia was not significantly associated with dopamine transporter reuptake in patients with PD (Lee et al., 2015). Together, these results suggest enlarged PVS in the basal ganglia of patients with PD may play a more significant role in cognitive impairment instead of the etiological mechanisms of the disease.
5.2.3. Neuroinflammatory disease
Histopathological studies have shown that PVS are sites of inflammatory infiltrates in CSVD (Durand-Fardel, 1842). In a critical step for the evolution of inflammatory disease, perivascular macrophages regulate the entry of inflammatory cells, which can damage the extracellular matrix, degrade the integrity of the blood-brain barrier, and lead to neuronal death and demyelination (Wong et al., 2013). Multiple sclerosis (MS) is a neuroinflammatory disease of unknown etiology characterized by demyelinating white matter lesions. Previous studies have shown that patients with MS have significantly increased PVS burden in white matter compared to controls (Achiron and Faibel, 2002; Conforti et al., 2014; Etemadifar et al., 2011; Ge et al., 2005; Kilsdonk et al., 2015; Wuerfel et al., 2008). However, there is some disagreement regarding the morphological PVS features that characterize MS. In one study, patients with MS had significantly higher PVS volume, but not number, compared to controls that was not explained by brain atrophy (Wuerfel et al., 2008). However, in a study using UHF MRI, authors found that the number of PVS, but not the total volume, was significantly greater in patients with MS, particularly in supratentorial regions (Kilsdonk et al., 2015). These differences could be partially explained by the MR field strength: at 1.5 T, it is possible that partial volume effect and reduced SNR may have obscured smaller PVS that are more readily observed at 7 T. Additionally, Kilsdonk et al. (2015) explored PVS burden in different regions, while Wuerfel et al. (2008) considered the totality of PVS in the basal ganglia and white matter together. The association between PVS morphology and MS may therefore depend on the topographical distribution of PVS in the brain. Indeed, others have found significantly higher MRI-visible PVS count in localized white matter regions in patients with MS, including high convexity areas (Etemadifar et al., 2011), anterior perforating substance, and atypical anatomical regions (Conforti et al., 2018).
It is unclear if the presence of PVS coincides with MS lesions or disease severity. Previous studies have shown that PVS burden was not associated with conversion to moderate-severe disability in relapsing-remitting MS (Cavallari et al., 2018) or accrual of white matter lesions (Cavallari et al., 2018; Kilsdonk et al., 2015); however, one study found that MRI-visible PVS tend to be spatially aligned with MS lesions (Ge et al., 2005). Additionally, global brain atrophy does not appear to be correlated with PVS burden in patients with MS (Cavallari et al., 2018; Conforti et al., 2014; Wuerfel et al., 2008).
Table 4 summarizes the main results of this section.
Table 4.
Conditions associated with perivascular space (PVS) burden on MRI.
| Condition | Neuroimaging PVS analysis | Finding |
|---|---|---|
| Healthy Aging | Visual (Francis et al., 2019; Gutierrez et al., 2013; Huang et al., 2021; Laveskog et al., 2018; Yakushiji et al.. 2014; Zhu et al., 2010b, 2011) Quantitative (Barisano et al., 2021b; Ramirez et al., 2015) | Higher PVS burden is associated with aging |
| Gender | Visual (Zhu et al., 2010b, 2011) Quantitative (Barisano et al., 2021b; Ramirez et al., 2015) | Higher PVS burden is associated with male sex |
| BMI | Visual (Ozato et al., 2021) Quantitative (Barisano et al., 2021b) | Higher PVS burden is associated with higher BMI (Barisano et al., 2021b) and higher visceral fat (Ozato et al., 2021) |
| Time of day | Quantitative (Barisano et al., 2021b) | Higher PVS burden is visible on MRI at later time of day |
| Long-duration spaceflight | Quantitative (Barisano et al., 2022) | Increased PVS volume in the white matter (WM-PVS) and basal ganglia after long-duration spaceflight on the International Space Station, but not short-duration spaceflight on the Space Shuttle. Preflight and postflight WM-PVS volumes are associated with the spaceflight-associated neuro-ocular syndrome. |
| Genetics | Visual (Duperron et al., 2018) Quantitative (Barisano et al., 2021b; Choi et al., 2020) | Significant heritability estimates for PVS burden in older community-dwelling people. Healthy young twins show similar amount of PVS. |
| Sleep | Visual (Aribisala et al., 2020; Del Brutto et al., 2019; Song et al., 2017) Quantitative (Berezuk et al., 2015) | Higher PVS burden is associated with sleep dysfunction (Aribisala et al., 2020; Berezuk et al., 2015; Del Brutto et al., 2019) and obstructive sleep apnea (Song et al., 2017) |
| Hypertension | Visual (Gutierrez et al., 2013; Martinez-Ramirez et al., 2013; Yakushiji et al., 2014; Zhu et al., 2010b) Quantitative (Dubost et al., 2019; Sepehrband et al., 2021) Meta-analysis (Francis et al., 2019) | Hypertension is associated with higher PVS burden, especially in the basal ganglia |
| MCI | Quantitative (Sepehrband et al., 2021) | Female MCI subjects have higher PVS volume fraction in centrum semiovale. MCI subjects have lower PVS volume fraction in the anterosuperior medial temporal lobe. |
| AD | Visual (Banerjee et al., 2017; Chen et al., 2011; Roher et al., 2003) Quantitative (Cai et al., 2015; Ramirez et al., 2015) | AD is significantly associated with increased PVS volume (Cai et al., 2015; Ramirez et al., 2015), count (Roher et al., 2003), and visually-rated severity (Banerjee et al., 2017; Chen et al., 2011) in the subcortical white matter |
| CAA | Visual (Charidimou et al., 2014; van Veluw et al., 2016) | CAA is associated with greater burden of PVS in white matter (Charidimou et al., 2014; van Veluw et al., 2016) |
| MS | Visual (Achiron and Faibel, 2002; Conforti et al., 2014; Etemadifar et al., 2011; Ge et al., 2005; Kilsdonk et al., 2015) Quantitative (Wuerfel et al., 2008) | MS is associated with higher PVS burden in white matter |
| PD | Visual (Conforti et al., 2018; Duker and Espay, 2007; Fénelon et al., 1995; Lee et al., 2015; Mancardi et al., 1988; Mehta et al., 2013) Quantitative (Donahue et al., 2021) | PD is associated with higher PVS burden in the basal ganglia (Conforti et al., 2018; Duker and Espay, 2007; Fénelon et al., 1995; Lee et al., 2015; Mancardi et al., 1988; Mehta et al., 2013) and certain regions of the subcortical white matter (Donahue et al., 2021) |
Abbreviations: AD: Alzheimer’s Disease; BMI: body mass index; CAA: cerebral amyloid angiopathy; MCI: mild cognitive impairment; MS: multiple sclerosis; PD: Parkinson’s disease.
MRI-visible PVS burden and PVS enlargement are associated with several other conditions, including systemic lupus erythematosus (Miyata et al., 2017), amyotrophic lateral sclerosis (Månberg et al., 2021), myotonic dystrophy (Di Costanzo et al., 2001), traumatic brain injury (Duncan et al., 2018; Inglese et al., 2005; Opel et al., 2019), autism spectrum disorders (Taber et al., 2004) and pediatric idiopathic generalized epilepsy (Liu et al., 2020). Together, these findings suggest that higher MRI-visible PVS may be a non-specific indicator of impaired brain health. However, there is limited evidence across neurological conditions that PVS enlargement is associated with the molecular mechanisms that characterize disease pathology and may therefore represent a secondary consequence of neurological dysfunction.
The vast majority of neuroimaging studies discussed quantify PVS burden using severity scores based on a visual rating scale (Achiron and Faibel, 2002; Banerjee et al., 2017; Charidimou et al., 2013, 2014, 2015, 2017; Chen et al., 2011; Di Costanzo et al., 2001; Laveskog et al., 2018; Martinez-Ramirez et al., 2013; Miyata et al., 2017; Opel et al., 2019; Park et al., 2019; Potter et al., 2015b; Shibata et al., 2019; van Veluw et al., 2016; Zhang et al., 2016) or manual counts on a subset of the data (Ding et al., 2017; Doubal et al., 2010b; Kilsdonk et al., 2015; Wan et al., 2019). Therefore, future studies should aim to further investigate these findings using segmentation techniques with the ability to probe morphological characteristics in different brain regions (Donahue et al., 2021; Ramirez et al., 2015; Sepehrband et al., 2021).
Acknowledgments
Data were provided in part by the HCP, WU-Minn Consortium (1U54MH091657) and by the McDonnell Center for Systems Neuroscience at Washington University. This study was supported by grants RF1-MH123223–01, R01-AG070825–01, and S10OD025312. Author KML is supported by the NIH National Institute on Aging (NIA) Institutional Training Grant T32AG058507.
Abbreviations:
- Aβ
Amyloid-β
- AD
Alzheimer’s disease
- BMI
Body mass index
- CAA
Cerebral amyloid angiopathy
- CSF
Cerebrospinal fluid
- CNN
Convolutional neural network
- CSVD
Cerebral small vessel disease
- dMRI
Diffusion MRI
- DTI-ALPS
Diffusion tensor imaging along the perivascular space
- dWMH
White matter hyperintensities in the deep white matter
- FA
Fractional anisotropy
- FLAIR
Fluid-attenuated inversion recovery
- ISF
Interstitial fluid
- IPAD
Intramural periarterial drainage pathway
- IVIM
Intra-voxel incoherent motion
- MCI
Mild cognitive impairment
- MD
Mean diffusivity
- MS
Multiple sclerosis
- PD
Parkinson’s disease
- PET
Positron emission tomography
- PVS
Perivascular spaces
- UHF
Ultra-high field
- WMH
White matter hyperintensities
Footnotes
Ethics statement
The study protocol was approved by the Institutional Review Board at the University of Southern California conforming with the World Medical Association Declaration of Helsinki. Written consent was obtained from all participants included in this study.
Declaration of Competing Interest
The authors declare that they have no known competing financial interests or personal relationships that could have appeared to influence the work reported in this paper.
Data/code availability statement
MRI and clinical data can be accessed from https://www.humanconnectome.org.
Data and code availability statement
MRI data included in our manuscript can be accessed from https://www.humanconnectome.org.
References
- Absinta M, Ha SK, Nair G, Sati P, Luciano NJ, Palisoc M, Louveau A, Zaghloul KA, Pittaluga S, Kipnis J, Reich DS, 2017. Human and nonhuman primate meninges harbor lymphatic vessels that can be visualized noninvasively by MRI. Elife 6, 1–15. doi: 10.7554/eLife.29738.001. [DOI] [PMC free article] [PubMed] [Google Scholar]
- Achiron A, Faibel M, 2002. Sandlike appearance of Virchow-Robin spaces in early multiple sclerosis: a novel neuroradiologic marker. Am. J. Neuroradiol 23, 376–380. [PMC free article] [PubMed] [Google Scholar]
- Adachi M, Hosoya T, Haku T, Yamaguchi K, 1998. Dilated Virchow-Robin spaces: MRI pathological study. Neuroradiology 40, 27–31. doi: 10.1007/s002340050533. [DOI] [PubMed] [Google Scholar]
- Adams HHH, Cavalieri M, Verhaaren BFJ, Bos D, Van Der Lugt A, Enzinger C, Vernooij MW, Schmidt R, Ikram MA, 2013. Rating method for dilated virchow-robin spaces on magnetic resonance imaging. Stroke 44, 1732–1735. doi: 10.1161/STROKEAHA.111.000620. [DOI] [PubMed] [Google Scholar]
- Akashi T, Takahashi S, Mugikura S, Sato S, Murata T, Umetsu A, Takase K, 2017. Ischemic white matter lesions associated with medullary arteries: classification of MRI findings based on the anatomic arterial distributions. Am. J. Roentgenol 209, W160–W168. doi: 10.2214/AJR.16.17231. [DOI] [PubMed] [Google Scholar]
- Aldea R, Weller RO, Wilcock DM, Carare RO, Richardson G, 2019. Cerebrovascular smooth muscle cells as the drivers of intramural periarterial drainage of the brain. Front. Aging Neurosci 11. doi: 10.3389/FNAGI.2019.00001. [DOI] [PMC free article] [PubMed] [Google Scholar]
- Aribisala BS, Riha RL, Valdes Hernandez M, Muñoz Maniega S, Cox S, Radakovic R, Taylor A, Pattie A, Corley J, Redmond P, Bastin ME, Starr J, Deary I, Wardlaw JM, 2020. Sleep and brain morphological changes in the eighth decade of life. Sleep Med 65, 152–158. doi: 10.1016/J.SLEEP.2019.07.015. [DOI] [PubMed] [Google Scholar]
- Asgari M, De Zélicourt D, Kurtcuoglu V, 2016. Glymphatic solute transport does not require bulk flow. Sci. Rep 6. doi: 10.1038/SREP38635. [DOI] [PMC free article] [PubMed] [Google Scholar]
- Aspelund A, Antila S, Proulx ST, Karlsen TV, Karaman S, Detmar M, Wiig H, Alitalo K, 2015. A dural lymphatic vascular system that drains brain interstitial fluid and macromolecules. J. Exp. Med 212, 991–999. doi: 10.1084/jem.20142290. [DOI] [PMC free article] [PubMed] [Google Scholar]
- Assaf Y, Freidlin RZ, Rohde GK, Basser PJ, 2004. New modeling and experimental framework to characterize hindered and restricted water diffusion in brain white matter. Magn. Reson. Med 52, 965–978. doi: 10.1002/mrm.20274. [DOI] [PubMed] [Google Scholar]
- Bae YJ, Choi BS, Kim J−M, Choi J−H, Cho SJ, Kim JH, 2021. Altered glymphatic system in idiopathic normal pressure hydrocephalus. Parkinsonism Relat. Disord 82, 56–60. doi: 10.1016/j.parkreldis.2020.11.009. [DOI] [PubMed] [Google Scholar]
- Bakker ENTP, Bacskai BJ, Arbel-Ornath M, Aldea R, Bedussi B, Morris AWJ, Weller RO, Carare RO, 2016. Lymphatic clearance of the brain: perivascular, paravascular and significance for neurodegenerative diseases. Cell. Mol. Neurobiol 36, 181–194. doi: 10.1007/s10571-015-0273-8. [DOI] [PMC free article] [PubMed] [Google Scholar]
- Ballerini L, Lovreglio R, Valdés Hernández MDC, Ramirez J, MacIntosh BJ, Black SE, Wardlaw JM, 2018. Perivascular spaces segmentation in brain MRI using optimal 3D filtering. Sci. Rep 8, 1–11. doi: 10.1038/s41598-018-19781-5. [DOI] [PMC free article] [PubMed] [Google Scholar]
- Banerjee G, Kim HJ, Fox Z, Jäger HR, Wilson D, Charidimou A, Na HK, Na DL, Seo SW, Werring DJ, 2017. MRI-visible perivascular space location is associated with Alzheimer’s disease independently of amyloid burden. Brain 140, 1107–1116. doi: 10.1093/brain/awx003. [DOI] [PubMed] [Google Scholar]
- Barisano G, Law M, Custer RM, Toga AW, Sepehrband F, 2021a. Perivascular space imaging at ultrahigh field MR imaging. Magn. Reson. Imaging Clin. N. Am doi: 10.1016/j.mric.2020.09.005. [DOI] [PMC free article] [PubMed] [Google Scholar]
- Barisano G, Sepehrband F, Collins HR, Jillings S, Jeurissen B, Taylor JA, Schoenmaekers C, De Laet C, Rukavishnikov I, Nosikova I, Litvinova L, Rumshiskaya A, Annen J, Sijbers J, Laureys S, Van Ombergen A, Petrovichev V, Sinitsyn V, Pechenkova E, Grishin A, zu Eulenburg P, Law M, Sunaert S, Parizel PM, Tomilovskaya E, Roberts DR, Wuyts FL, 2022. The effect of prolonged spaceflight on cerebrospinal fluid and perivascular spaces of astronauts and cosmonauts. Proc. Natl. Acad. Sci 119, e2120439119. doi: 10.1073/pnas.2120439119. [DOI] [PMC free article] [PubMed] [Google Scholar]
- Barisano G, Sepehrband F, Ma S, Jann K, Cabeen R, Wang DJ, Toga AW, Law M, 2019. Clinical 7 T MRI: are we there yet? A review about magnetic resonance imaging at ultra-high field. Br. J. Radiol 92, 20180492. doi: 10.1259/bjr.20180492. [DOI] [PMC free article] [PubMed] [Google Scholar]
- Barisano G, Sheikh-Bahaei N, Law M, Toga AW, Sepehrband F, 2021b. Body mass index, time of day and genetics affect perivascular spaces in the white matter. J. Cereb. Blood Flow Metab 41, 1563–1578. doi: 10.1177/0271678x20972856. [DOI] [PMC free article] [PubMed] [Google Scholar]
- Bastos-Leite AJ, Van Waesberghe JH, Oen AL, Van Der Flier WM, Scheltens P, Barkhof F, 2006. Hippocampal sulcus width and cavities: comparison between patients with Alzheimer disease and nondemented elderly subjects. AJNR Am. J. Neuroradiol 27, 2141. [PMC free article] [PubMed] [Google Scholar]
- Benjamin P, Trippier S, Lawrence AJ, Lambert C, Zeestraten E, Williams OA, Patel B, Morris RG, Barrick TR, MacKinnon AD, Markus HS, 2018. Lacunar infarcts, but not perivascular spaces, are predictors of cognitive decline in cerebral small-vessel disease. Stroke 49, 586–593. doi: 10.1161/STROKEAHA.117.017526. [DOI] [PMC free article] [PubMed] [Google Scholar]
- Berdahl JP, Fleischman D, Zaydlarova J, Stinnett S, Rand Allingham R, Fautsch MP, 2012. Body mass index has a linear relationship with cerebrospinal fluid pressure. Investig. Ophthalmol. Vis. Sci doi: 10.1167/iovs.11-8220. [DOI] [PMC free article] [PubMed] [Google Scholar]
- Berezuk C, Ramirez J, Gao F, Scott CJM, Huroy M, Swartz RH, Murray BJ, Black SE, Boulos MI, 2015. Virchow-Robin spaces: correlations with polysomnography-derived sleep parameters. Sleep 38, 853–858. doi: 10.5665/sleep.4726. [DOI] [PMC free article] [PubMed] [Google Scholar]
- Blair GW, Thrippleton MJ, Shi Y, Hamilton I, Stringer M, Chappell F, Dickie DA, Andrews P, Marshall I, Doubal FN, Wardlaw JM, 2020. Intracranial hemodynamic relationships in patients with cerebral small vessel disease. Neurology doi: 10.1212/WNL.0000000000009483.10.1212/WNL.0000000000009483. [DOI] [PMC free article] [PubMed] [Google Scholar]
- Boespflug EL, Schwartz DL, Lahna D, Pollock J, Iliff JJ, Kaye JA, Rooney W, Silbert LC, 2018. MR Imaging–based multimodal autoidentification of perivascular spaces (mMAPS): automated morphologic segmentation of enlarged perivascular spaces at clinical field strength. Radiology 286, 632–642. doi: 10.1148/radiol.2017170205. [DOI] [PMC free article] [PubMed] [Google Scholar]
- Bouvy WH, Biessels GJ, Kuijf HJ, Kappelle LJ, Luijten PR, Zwanenburg JJM, 2014. Visualization of perivascular spaces and perforating arteries with 7 T magnetic resonance imaging. Invest. Radiol 49, 307–313. doi: 10.1097/RLI.0000000000000027. [DOI] [PubMed] [Google Scholar]
- Bouvy WH, van Veluw SJ, Kuijf HJ, Zwanenburg JJ, Kappelle JL, Luijten PR, Koek HL, Geerlings MI, Biessels GJ, 2020. Microbleeds colocalize with enlarged juxtacortical perivascular spaces in amnestic mild cognitive impairment and early Alzheimer’s disease: a 7 Tesla MRI study. J. Cereb. Blood Flow Metab 40, 739–746. doi: 10.1177/0271678x19838087. [DOI] [PMC free article] [PubMed] [Google Scholar]
- Bradbury MW, Cserr HF, Westrop RJ, 1981. Drainage of cerebral interstitial fluid into deep cervical lymph of the rabbit. Am. J. Physiol. Physiol 240, F329–F336. doi: 10.1152/ajprenal.1981.240.4.F329. [DOI] [PubMed] [Google Scholar]
- Bradbury MW, Westrop RJ, 1983. Factors influencing exit of substances from cerebrospinal fluid into deep cervical lymph of the rabbit. J. Physiol 339, 519–534. doi: 10.1113/JPHYSIOL.1983.SP014731. [DOI] [PMC free article] [PubMed] [Google Scholar]
- Cai K, Tain R, Das S, Damen FC, Sui Y, Valyi-Nagy T, Elliott MA, Zhou XJ, 2015. The feasibility of quantitative MRI of perivascular spaces at 7 T. J. Neurosci. Methods 256, 151–156. doi: 10.1016/j.jneumeth.2015.09.001. [DOI] [PMC free article] [PubMed] [Google Scholar]
- Carare RO, Bernardes-Silva M, Newman TA, Page AM, Nicoll JAR, Perry VH, Weller RO, 2008. Solutes, but not cells, drain from the brain parenchyma along basement membranes of capillaries and arteries: significance for cerebral amyloid angiopathy and neuroimmunology. Neuropathol. Appl. Neurobiol 34, 131–144. doi: 10.1111/j.1365-2990.2007.00926.x. [DOI] [PubMed] [Google Scholar]
- Cavaglia M, Dombrowski SM, Drazba J, Vasanji A, Bokesch PM, Janigro D, 2001. Regional variation in brain capillary density and vascular response to ischemia. Brain Res 910, 81–93. doi: 10.1016/S0006-8993(01)02637-3. [DOI] [PubMed] [Google Scholar]
- Cavallari M, Egorova S, Healy BC, Palotai M, Prieto JC, Polgar-Turcsanyi M, Tauhid S, Anderson M, Glanz B, Chitnis T, Guttmann CRG, 2018. Evaluating the association between enlarged perivascular spaces and disease worsening in multiple sclerosis. J. Neuroimaging 28, 273–277. doi: 10.1111/jon.12490. [DOI] [PubMed] [Google Scholar]
- Charidimou A, Boulouis G, Pasi M, Auriel E, Van Etten ES, Haley K, Ayres A, Schwab KM, Martinez-Ramirez S, Goldstein JN, Rosand J, Viswanathan A, Greenberg SM, Gurol ME, 2017. MRI-visible perivascular spaces in cerebral amyloid angiopathy and hypertensive arteriopathy. Neurology 88, 1157–1164. doi: 10.1212/WNL.0000000000003746. [DOI] [PMC free article] [PubMed] [Google Scholar]
- Charidimou A, Hong YT, Jäger HR, Fox Z, Aigbirhio FI, Fryer TD, Menon DK, Warburton EA, Werring DJ, Baron JC, 2015. White matter perivascular spaces on magnetic resonance imaging. Stroke 46, 1707–1709. doi: 10.1161/STROKEAHA.115.009090. [DOI] [PubMed] [Google Scholar]
- Charidimou A, Jaunmuktane Z, Baron JC, Burnell M, Varlet P, Peeters A, Xuereb J, Jäger R, Brandner S, Werring DJ, 2014. White matter perivascular spaces: an MRI marker in pathology-proven cerebral amyloid angiopathy? Neurology 82, 57–62. doi: 10.1212/01.wnl.0000438225.02729.04. [DOI] [PMC free article] [PubMed] [Google Scholar]
- Charidimou A, Meegahage R, Fox Z, Peeters A, Vandermeeren Y, Laloux P, Baron J, Jäger HR, Werring DJ, 2013. Enlarged perivascular spaces as a marker of underlying arteriopathy in intracerebral haemorrhage: a multicentre MRI cohort study. J. Neurol. Neurosurg. Psychiatry 84, 624–629. doi: 10.1136/jnnp-2012-304434. [DOI] [PMC free article] [PubMed] [Google Scholar]
- Chen HL, Chen P−C, Lu C−H, Tsai N−W, Yu C−C, Chou K−H, Lai Y−R, Taoka T, Lin W−C, 2021. Associations among cognitive functions, plasma DNA, and diffusion tensor image along the perivascular space (DTI-ALPS) in patients with Parkinson’s disease. Oxid. Med. Cell. Longev 2021, 1–10. doi: 10.1155/2021/4034509. [DOI] [PMC free article] [PubMed] [Google Scholar]
- Chen W, Song X, Zhang Y, 2011. Assessment of the Virchow-Robin spaces in Alzheimer disease, mild cognitive impairment, and normal aging, using high-field MR imaging. Am. J. Neuroradiol 32, 1490–1495. doi: 10.3174/ajnr.A2541. [DOI] [PMC free article] [PubMed] [Google Scholar]
- Choi Y, Nam Y, Choi Y, Kim J, Jang J, Ahn KJ, Kim B, Shin NY, 2020. MRI-visible dilated perivascular spaces in healthy young adults: a twin heritability study. Hum. Brain Mapp 41, 5313–5324. doi: 10.1002/hbm.25194. [DOI] [PMC free article] [PubMed] [Google Scholar]
- Cogswell PM, Graff-Radford J, Wurtz LI, Graff-Radford NR, Johnson DR, Hunt CH, Gunter JL, Cutsforth-Gregory JK, Jones DT, Elder BD, Huston III J, Jack CR Jr, 2020. CSF dynamics disorders: association of brain MRI and nuclear medicine cisternogram findings. NeuroImage Clin 28. doi: 10.1016/j.nicl.2020.102481. [DOI] [PMC free article] [PubMed] [Google Scholar]
- Conforti R, Cirillo M, Saturnino PP, Gallo A, Sacco R, Negro A, Paccone A, Caiazzo G, Bisecco A, Bonavita S, Cirillo S, 2014. Dilated Virchow-Robin spaces and multiple sclerosis: 3 T magnetic resonance study. Radiol. Med 119, 408–414. doi: 10.1007/s11547-013-0357-9. [DOI] [PubMed] [Google Scholar]
- Conforti R, Sardaro A, Negro A, Caiazzo G, Paccone A, De Micco R, Cirillo S, Tessitore A, 2018. Dilated Virchow-Robin space and Parkinson’s disease: a case report of combined MRI and diffusion tensor imaging. Radiol. Case Rep 13, 871–877. doi: 10.1016/j.radcr.2018.05.011. [DOI] [PMC free article] [PubMed] [Google Scholar]
- de Leon MJ, Li Y, Okamura N, Tsui WH, Saint-Louis LA, Glodzik L, Osorio RS, Fortea J, Butler T, Pirraglia E, Fossati S, Kim H−J, Carare RO, Nedergaard M, Benveniste H, Rusinek H, 2017. Cerebrospinal fluid clearance in Alzheimer disease measured with dynamic PET. J. Nucl. Med 58. doi: 10.2967/jnumed.116.187211. [DOI] [PMC free article] [PubMed] [Google Scholar]
- Debaker C, Djemai B, Ciobanu L, Tsurugizawa T, Le Bihan D, 2020. Diffusion MRI reveals in vivo and non-invasively changes in astrocyte function induced by an aquaporin-4 inhibitor. PLoS One 15, 1–14. doi: 10.1371/journal.pone.0229702. [DOI] [PMC free article] [PubMed] [Google Scholar]
- Del Brutto OH, Mera RM, Del Brutto VJ, Castillo PR, 2019. Enlarged basal ganglia perivascular spaces and sleep parameters. A population-based study. Clin. Neurol. Neurosurg 182, 53–57. doi: 10.1016/j.clineuro.2019.05.002. [DOI] [PubMed] [Google Scholar]
- Descombes X, Kruggel F, Wollny G, Gertz HJ, 2004. An object-based approach for detecting small brain lesions: application to Virchow-Robin spaces. IEEE Trans. Med. Imaging 23, 246–255. doi: 10.1109/TMI.2003.823061. [DOI] [PubMed] [Google Scholar]
- Di Costanzo A, Di Salle F, Santoro L, Bonavita V, Tedeschi G, 2001. Dilated Virchow-Robin spaces in myotonic dystrophy: frequency, extent and significance. Eur. Neurol 46, 131–139. doi: 10.1159/000050786. [DOI] [PubMed] [Google Scholar]
- Dickson JM, Weavers HM, Mitchell N, Winter EM, Wilkinson ID, Van Beek EJR, Wild JM, Griffiths PD, 2005. The effects of dehydration on brain volume - preliminary results. Int. J. Sports Med 26, 481–485. doi: 10.1055/s-2004-821318. [DOI] [PubMed] [Google Scholar]
- Ding J, Sigurðsson S, Jónsson PV, Eiriksdottir G, Charidimou A, Lopez OL, van Buchem MA, Guðnason V, Launer LJ, 2017. Large perivascular spaces visible on magnetic resonance imaging, cerebral small vessel disease progression, and risk of dementia. JAMA Neurol 74, 1105. doi: 10.1001/jamaneurol.2017.1397. [DOI] [PMC free article] [PubMed] [Google Scholar]
- Donahue EK, Murdos A, Jakowec MW, Sheikh-Bahaei N, Toga AW, Petzinger GM, Sepehrband F, 2021. Global and regional changes in perivascular space in idiopathic and familial Parkinson’s disease. Mov. Disord 28473. doi: 10.1002/mds.28473. [DOI] [PMC free article] [PubMed] [Google Scholar]
- Doubal FN, MacLullich AMJ, Ferguson KJ, Dennis MS, Wardlaw JM, 2010a. Enlarged perivascular spaces on MRI are a feature of cerebral small vessel disease. Stroke 41, 450–454. doi: 10.1161/STROKEAHA.109.564914. [DOI] [PubMed] [Google Scholar]
- Doubal FN, MacLullich AMJ, Ferguson KJ, Dennis MS, Wardlaw JM, 2010b. Enlarged perivascular spaces on MRI are a feature of cerebral small vessel disease. Stroke 41, 450–454. doi: 10.1161/STROKEAHA.109.564914. [DOI] [PubMed] [Google Scholar]
- Doucette J, Wei L, Hernández-Torres E, Kames C, Forkert ND, Aamand R, Lund TE, Hansen B, Rauscher A, 2019. Rapid solution of the bloch-torrey equation in anisotropic tissue: application to dynamic susceptibility contrast MRI of cerebral white matter. Neuroimage 185, 198–207. doi: 10.1016/j.neuroimage.2018.10.035. [DOI] [PubMed] [Google Scholar]
- Dreha-Kulaczewski S, Joseph AA, Merboldt KD, Ludwig HC, Gärtner J, Frahm J, 2015. Inspiration is the major regulator of human CSF flow. J. Neurosci 35, 2485–2491. doi: 10.1523/JNEUROSCI.3246-14.2015. [DOI] [PMC free article] [PubMed] [Google Scholar]
- Dubost F, Yilmaz P, Adams H, Bortsova G, Ikram MA, Niessen W, Vernooij M, de Bruijne M, 2019. Enlarged perivascular spaces in brain MRI: automated quantification in four regions. Neuroimage 185, 534–544. doi: 10.1016/j.neuroimage.2018.10.026. [DOI] [PubMed] [Google Scholar]
- Duker AP, Espay AJ, 2007. Parkinsonism associated with striatal perivascular space dilation. Neurology 68, 1540. doi: 10.1212/01.wnl.0000261483.49248.b8. [DOI] [PubMed] [Google Scholar]
- Duncan D, Barisano G, Cabeen R, Sepehrband F, Garner R, Braimah A, Vespa P, Pitkänen A, Law M, Toga AW, 2018. Analytic tools for post-traumatic epileptogenesis biomarker search in multimodal dataset of an animal model and human patients. Front. Neuroinform 12, 86. doi: 10.3389/fninf.2018.00086. [DOI] [PMC free article] [PubMed] [Google Scholar]
- Duperron M−G, Tzourio C, Sargurupremraj M, Mazoyer B, Soumaré A, Schilling S, Amouyel P, Chauhan G, Zhu Y−C, Debette S, 2018. Burden of dilated perivascular spaces, an emerging marker of cerebral small vessel disease, is highly heritable. Stroke 49, 282–287. doi: 10.1161/STROKEAHA.117.019309. [DOI] [PubMed] [Google Scholar]
- Durand-Fardel M, 1843. Traite Du Ramollissement Du Cerveau Baillier, Paris. [Google Scholar]
- Durand-Fardel M, 1842. Memoire sur une alteration particuliere de la substance cerebrale. Gaz. Med. Paris 10, 23–38. [Google Scholar]
- Duvernoy HM, Delon S, Vannson JL, 1981. Cortical blood vessels of the human brain. Brain Res. Bull 7, 519–579. doi: 10.1016/0361-9230(81)90007-1. [DOI] [PubMed] [Google Scholar]
- Eide PK, Pripp AH, Berge B, Hrubos-Strøm H, Ringstad G, Valnes LM, 2022. Altered glymphatic enhancement of cerebrospinal fluid tracer in individuals with chronic poor sleep quality. J. Cereb. Blood Flow Metab doi: 10.1177/0271678x221090747. [DOI] [PMC free article] [PubMed] [Google Scholar]
- Eide PK, Pripp AH, Ringstad G, Valnes LM, 2021a. Impaired glymphatic function in idiopathic intracranial hypertension. Brain Commun 3. doi: 10.1093/braincomms/fcab043. [DOI] [PMC free article] [PubMed] [Google Scholar]
- Eide PK, Ringstad G, 2018. Delayed clearance of cerebrospinal fluid tracer from entorhinal cortex in idiopathic normal pressure hydrocephalus: a glymphatic magnetic resonance imaging study. J. Cereb. Blood Flow Metab doi: 10.1177/0271678x18760974. [DOI] [PMC free article] [PubMed] [Google Scholar]
- Eide PK, Vinje V, Pripp AH, Mardal KA, Ringstad G, 2021b. Sleep deprivation impairs molecular clearance from the human brain. Brain 144, 863–874. doi: 10.1093/BRAIN/AWAA443. [DOI] [PubMed] [Google Scholar]
- Etemadifar M, Hekmatnia A, Tayari N, Kazemi M, Ghazavi A, Akbari M, Maghzi A−H, 2011. Features of Virchow-Robin spaces in newly diagnosed multiple sclerosis patients. Eur. J. Radiol 80, e104–e108. doi: 10.1016/J.EJRAD.2010.05.018. [DOI] [PubMed] [Google Scholar]
- Fénelon G, Gray F, Wallays C, Poirier J, Guillard A, 1995. Parkinsonism and dilatation of the perivascular spaces (État Criblé) of the striatum: a clinical, magnetic resonance imaging, and pathological study. Mov. Disord 10, 754–760. doi: 10.1002/mds.870100609. [DOI] [PubMed] [Google Scholar]
- Francis F, Ballerini L, Wardlaw JM, 2019. Perivascular spaces and their associations with risk factors, clinical disorders and neuroimaging features: a systematic review and meta-analysis. Int. J. Stroke 14, 359–371. doi: 10.1177/1747493019830321. [DOI] [PubMed] [Google Scholar]
- Frangi AF, Niessen WJ, Vincken KL, Viergever MA, 1998. Multiscale vessel enhancement filtering. In: Medical Image Computing and Computer-Assisted Intervention— Miccai’98. Springer, Berlin, Heidelberg, pp. 130–137. doi: 10.1007/BFb0056195. [DOI] [Google Scholar]
- Ge Y, Law M, Herbert J, Grossman RI, 2005. Prominent perivenular spaces in multiple sclerosis as a sign of perivascular inflammation in primary demyelination. Am. J. Neuroradiol 26, 2316–2319. [PMC free article] [PubMed] [Google Scholar]
- George IC, Arrighi-Allisan A, Delman BN, Balchandani P, Horng S, Feldman R, 2021. A novel method to measure venular perivascular spaces in patients with MS on 7T MRI. Am. J. Neuroradiol 42, 1069–1072. doi: 10.3174/AJNR.A7144. [DOI] [PMC free article] [PubMed] [Google Scholar]
- González-Castro V, Valdés Hernández MC, Chappell FM, Armitage PA, Makin S, Wardlaw JM, 2017. Reliability of an automatic classifier for brain enlarged perivascular spaces burden and comparison with human performance. Clin. Sci 131, 1465–1481. doi: 10.1042/CS20170051. [DOI] [PubMed] [Google Scholar]
- Groeschel S, Chong WK, Surtees R, Hanefeld F, 2006. Virchow-Robin spaces on magnetic resonance images: normative data, their dilatation, and a review of the literature. Neuroradiology 48, 745–754. doi: 10.1007/s00234-006-0112-1. [DOI] [PubMed] [Google Scholar]
- Gutierrez J, Elkind MSV, Dong C, Di Tullio M, Rundek T, Sacco RL, Wright CB, 2017. Brain perivascular spaces as biomarkers of vascular risk: results from the northern manhattan study. Am. J. Neuroradiol 38, 862–867. doi: 10.3174/ajnr.A5129. [DOI] [PMC free article] [PubMed] [Google Scholar]
- Gutierrez J, Rundek T, Ekind MSV, Sacco RL, Wright CB, 2013. Perivascular spaces are associated with atherosclerosis: an insight from the northern manhattan study. AJNR. Am. J. Neuroradiol 34, 1711–1716. doi: 10.3174/ajnr.A3498. [DOI] [PMC free article] [PubMed] [Google Scholar]
- Hall S, Smedley A, Sparrow O, Mathad N, Waters R, Chakraborty A, Tsitouras V, 2019. Natural history of intracranial arachnoid cysts. World Neurosurg 126, e1315–e1320. doi: 10.1016/j.wneu.2019.03.087. [DOI] [PubMed] [Google Scholar]
- Harrison IF, Siow B, Akilo AB, Evans PG, Ismail O, Ohene Y, Nahavandi P, Thomas DL, Lythgoe MF, Wells JA, 2018. Non-invasive imaging of CSF-mediated brain clearance pathways via assessment of perivascular fluid movement with diffusion tensor MRI. Elife 7, 1–14. doi: 10.7554/eLife.34028. [DOI] [PMC free article] [PubMed] [Google Scholar]
- He Y, Wang M, Chen X, Pohmann R, Polimeni JR, Scheffler K, Rosen BR, Kleinfeld D, Yu X, 2018. Ultra-slow single-vessel BOLD and CBV-Based fMRI spatiotemporal dynamics and their correlation with neuronal intracellular calcium signals. Neuron 97, 925–939. doi: 10.1016/J.NEURON.2018.01.025. [DOI] [PMC free article] [PubMed] [Google Scholar]
- Heier LA, Bauer CJ, Schwartz L, Zimmerman RD, Morgello S, Deck MD, 1989. Large Virchow-Robin spaces: mR-clinical correlation. AJNR. Am. J. Neuroradiol 10, 929–936. [PMC free article] [PubMed] [Google Scholar]
- Hendrikse J, Zwanenburg JJ, Visser F, Takahara T, Luijten P, 2008. Noninvasive depiction of the lenticulostriate arteries with time-of-flight MR angiography at 7.0 T. Cerebrovasc. Dis 26, 624–629. doi: 10.1159/000166838. [DOI] [PubMed] [Google Scholar]
- Hilal S, Tan CS, Adams HHH, Habes M, Mok V, Venketasubramanian N, Hofer E, Ikram MK, Abrigo J, Vernooij MW, Chen C, Hosten N, Volzke H, Grabe HJ, Schmidt R, Ikram MA, 2018. Enlarged perivascular spaces and cognition: a meta-analysis of 5 population-based studies. Neurology 91, e832–e842. doi: 10.1212/WNL.0000000000006079. [DOI] [PMC free article] [PubMed] [Google Scholar]
- Holter KE, Kehlet B, Devor A, Sejnowski TJ, Dale AM, Omholt SW, Ottersen OP, Nagelhus EA, Mardal KA, Pettersen KH, 2017. Interstitial solute transport in 3D reconstructed neuropil occurs by diffusion rather than bulk flow. Proc. Natl. Acad. Sci. U. S. A 114, 9894–9899. doi: 10.1073/pnas.1706942114. [DOI] [PMC free article] [PubMed] [Google Scholar]
- Hou Y, Park SH, Wang Q, Zhang J, Zong X, Lin W, Shen D, 2017. Enhancement of perivascular spaces in 7 T MR image using haar transform of non-local cubes and block-matching filtering. Sci. Rep 7, 8569. doi: 10.1038/s41598-017-09336-5. [DOI] [PMC free article] [PubMed] [Google Scholar]
- Huang P, Zhu Z, Zhang R, Wu X, Jiaerken Y, Wang S, Yu W, Hong H, Lian C, Li K, Zeng Q, Luo X, Xu X, Yu X, Yang Y, Zhang M, 2021. Factors associated with the dilation of perivascular space in healthy elderly subjects. Front. Aging Neurosci 13, 624732. doi: 10.3389/fnagi.2021.624732. [DOI] [PMC free article] [PubMed] [Google Scholar]
- Hurford R, Charidimou A, Fox Z, Cipolotti L, Jager R, Werring DJ, 2014. MRI-visible perivascular spaces: relationship to cognition and small vessel disease MRI markers in ischaemic stroke and TIA. J. Neurol. Neurosurg. Psychiatry 85, 522–525. doi: 10.1136/JNNP-2013-305815. [DOI] [PMC free article] [PubMed] [Google Scholar]
- Iima M, Le Bihan D, 2015. Clinical intravoxel incoherent motion and diffusion MR. Radiology 278, 13–32. [DOI] [PubMed] [Google Scholar]
- Iliff JJ, Lee H, Yu M, Feng T, Logan J, Nedergaard M, Benveniste H, 2013a. Brain-wide pathway for waste clearance captured by contrast-enhanced MRI. J. Clin. Invest 123, 1299–1309. doi: 10.1172/JCI67677. [DOI] [PMC free article] [PubMed] [Google Scholar]
- Iliff JJ, Wang M, Liao Y, Plogg BA, Peng W, Gundersen GA, Benveniste H, Vates GE, Deane R, Goldman SA, Nagelhus EA, Nedergaard M, 2012. A paravascular pathway facilitates CSF flow through the brain parenchyma and the clearance of interstitial solutes, including amyloid β. Sci. Transl. Med 4, 1–11. doi: 10.1126/scitranslmed.3003748. [DOI] [PMC free article] [PubMed] [Google Scholar]
- Iliff JJ, Wang M, Zeppenfeld DM, Venkataraman A, Plog BA, Liao Y, Deane R, Nedergaard M, 2013b. Cerebral arterial pulsation drives paravascular CSF-interstitial fluid exchange in the murine brain. J. Neurosci 33, 18190–18199. doi: 10.1523/JNEUROSCI.1592-13.2013. [DOI] [PMC free article] [PubMed] [Google Scholar]
- Inglese M, Bomsztyk E, Gonen O, Mannon LJ, Grossman RI, Rusinek H, 2005. Dilated perivascular spaces: hallmarks of mild traumatic brain injury. Am. J. Neuroradiol 26. [PMC free article] [PubMed] [Google Scholar]
- Jiaerken Y, Lian C, Huang P, Yu X, Zhang R, Wang S, Hong H, Luo X, Yap P−T, Shen D, Zhang M, 2021. Dilated perivascular space is related to reduced free-water in surrounding white matter among healthy adults and elderlies but not in patients with severe cerebral small vessel disease. J. Cereb. Blood Flow Metab 41, 2561–2570. doi: 10.1177/0271678x211005875. [DOI] [PMC free article] [PubMed] [Google Scholar]
- Jiang Q, Zhang L, Ding G, Davoodi-Bojd E, Li Q, Li L, Sadry N, Nedergaard M, Chopp M, Zhang Z, 2017. Impairment of the glymphatic system after diabetes. J. Cereb. Blood Flow Metab 37, 1326–1337. doi: 10.1177/0271678x16654702. [DOI] [PMC free article] [PubMed] [Google Scholar]
- Jillings S, Van Ombergen A, Tomilovskaya E, Rumshiskaya A, Litvinova L, Nosikova I, Pechenkova E, Rukavishnikov I, Kozlovskaya IB, Manko O, Danilichev S, Sunaert S, Parizel PM, Sinitsyn V, Petrovichev V, Laureys S, zu Eulenburg P, Sijbers J, Wuyts FL, Jeurissen B, 2020. Macro- and microstructural changes in cosmonauts’ brains after long-duration spaceflight. Sci. Adv 6, eaaz9488. doi: 10.1126/sciadv.aaz9488. [DOI] [PMC free article] [PubMed] [Google Scholar]
- Jin BJ, Smith AJ, Verkman AS, 2016. Spatial model of convective solute transport in brain extracellular space does not support a “glymphatic” mechanism. J. Gen. Physiol 148, 489–501. doi: 10.1085/JGP.201611684. [DOI] [PMC free article] [PubMed] [Google Scholar]
- Jochems ACC, Blair GW, Stringer MS, Thrippleton MJ, Clancy U, Chappell FM, Brown R, Jaime Garcia D, Hamilton OKL, Morgan AG, Marshall I, Hetherington K, Wiseman S, MacGillivray T, Valdés-Hernández MC, Doubal FN, Wardlaw JM, 2020. Relationship between venules and perivascular spaces in sporadic small vessel diseases. Stroke doi: 10.1161/STROKEAHA.120.029163. [DOI] [PMC free article] [PubMed] [Google Scholar]
- Ju Y-ES, Ooms SJ, Sutphen C, Macauley SL, Zangrilli MA, Jerome G, Fagan AM, Mignot E, Zempel JM, Claassen JAHR, Holtzman DM, 2017. Slow wave sleep disruption increases cerebrospinal fluid amyloid-β levels. Brain 140, 2104–2111. doi: 10.1093/brain/awx148. [DOI] [PMC free article] [PubMed] [Google Scholar]
- Jung E, Chikontwe P, Zong X, Lin W, Shen D, Park SH, 2019. Enhancement of perivascular spaces using densely connected deep convolutional neural network. IEEE Access 7, 18382–18391. doi: 10.1109/ACCESS.2019.2896911. [DOI] [PMC free article] [PubMed] [Google Scholar]
- Jungreis CA, Kanal E, Hirsch WL, Martinez AJ, Moossy J, 1988. Normal perivascular spaces mimicking lacunar infarction: MR imaging. Radiology 169, 101–104. doi: 10.1148/radiology.169.1.3420242. [DOI] [PubMed] [Google Scholar]
- Kaminski M, Bechmann I, Kiwit J, Glumm J, 2012a. Migration of monocytes after intracerebral injection. Cell Adhes. Migr 6, 164–167. doi: 10.4161/cam.20281. [DOI] [PMC free article] [PubMed] [Google Scholar]
- Kaminski M, Bechmann I, Pohland M, Kiwit J, Nitsch R, Glumm J, 2012b. Migration of monocytes after intracerebral injection at entorhinal cortex lesion site. J. Leukoc. Biol 92, 31–39. doi: 10.1189/JLB.0511241. [DOI] [PubMed] [Google Scholar]
- Kang CK, Park CACW, Han JY, Kim SH, Park CACW, Kim KN, Hong SM, Kim YB, Lee KH, Cho ZH, 2009. Imaging and analysis of lenticulostriate arteries using 7.0-tesla magnetic resonance angiography. Magn. Reson. Med 61, 136–144. doi: 10.1002/mrm.21786. [DOI] [PubMed] [Google Scholar]
- Kempton MJ, Ettinger U, Schmechtig A, Winter EM, Smith L, McMorris T, Wilkinson ID, Williams SCR, Smith MS, 2009. Effects of acute dehydration on brain morphology in healthy humans. Hum. Brain Mapp 30, 291–298. doi: 10.1002/HBM.20500. [DOI] [PMC free article] [PubMed] [Google Scholar]
- Kerschnitzki M, Kollmannsberger P, Burghammer M, Duda GN, Weinkamer R, Wagermaier W, Fratzl P, 2013. Architecture of the osteocyte network correlates with bone material quality. J. Bone Miner. Res 28, 1837–1845. doi: 10.1002/jbmr.1927. [DOI] [PubMed] [Google Scholar]
- Kilsdonk I, Steenwijk M, Pouwels P, Zwanenburg J, Visser F, Luijten P, Geurts J, Barkhof F, Wattjes M, 2015. Perivascular spaces in MS patients at 7 tesla MRI: a marker of neurodegeneration? Mult. Scler. J 21, 155–162. doi: 10.1177/1352458514540358. [DOI] [PubMed] [Google Scholar]
- Kim JS, Singh V, Lee JK, Lerch J, Ad-Dab’bagh Y, MacDonald D, Lee JM, Kim SI, Evans AC, 2005. Automated 3-D extraction and evaluation of the inner and outer cortical surfaces using a laplacian map and partial volume effect classification. Neuroimage 27, 210–221. doi: 10.1016/j.neuroimage.2005.03.036. [DOI] [PubMed] [Google Scholar]
- Koppelmans V, Bloomberg JJ, Mulavara AP, Seidler RD, 2016. Brain structural plasticity with spaceflight. NPJ Microgravity 2. doi: 10.1038/s41526-016-0001-9. [DOI] [PMC free article] [PubMed] [Google Scholar]
- Kramer LA, Hasan KM, Stenger MB, Sargsyan A, Laurie SS, Otto C, PloutzSnyder RJ, Marshall-Goebel K, Riascos RF, Macias BR, 2020. Intracranial effects of microgravity: a prospective longitudinal MRI study. Radiology 295, 640–648. doi: 10.1148/radiol.2020191413. [DOI] [PubMed] [Google Scholar]
- Kwee RM, Kwee TC, 2007. Virchow-Robin spaces at MR imaging. Radiographics 27, 1071–1086. doi: 10.1148/rg.274065722. [DOI] [PubMed] [Google Scholar]
- Laitinen LV, Chudy D, Tengvar M, Hariz MI, Tommy Bergenheim A, 2000. Dilated perivascular spaces in the putamen and pallidum in patients with Parkinson’s disease scheduled for pallidotomy: a comparison between MRI findings and clinical symptoms and signs. Mov. Disord 15, 1139–1144. doi:. [DOI] [PubMed] [Google Scholar]
- Lan H, Sepehrband F, 2021. UPSS - unsupervised perivascular spaces segmentation method with salient guidance of frangi filter. In: Proceedings of the International Society for Magnetic Resonance in Medicine, p. 2377. [DOI] [PMC free article] [PubMed] [Google Scholar]
- Laveskog A, Wang R, Bronge L, Wahlund LO, Qiu C, 2018. Perivascular spaces in old age: assessment, distribution, and correlation with white matter hyperintensities. Am. J. Neuroradiol 39, 70–76. doi: 10.3174/ajnr.A5455. [DOI] [PMC free article] [PubMed] [Google Scholar]
- Le Bihan D, 1990. IVIM method measures diffusion and perfusion. Diagn. Imaging 12 (133), 36. [PubMed] [Google Scholar]
- Le Bihan D, Breton E, Lallemand D, Aubin M−L, Vignaud J, Laval-Jeantet M, 1988. Separation of diffusion nad perfusion in intravoxel incoherent motion MR imaging. Radiology 168, 497–505. doi: 10.1148/radiology.168.2.3393671. [DOI] [PubMed] [Google Scholar]
- Lee D, Hong IK, Ahn TB, 2015. Dilated Virchow-Robin space and dopamine transporter imaging in the striatum of patients with parkinsonism. Can. J. Neurol. Sci 42, 248–254. doi: 10.1017/cjn.2015.43. [DOI] [PubMed] [Google Scholar]
- Lee TC, Kashyap RL, Chu CN, 1994. Building Skeleton models via 3-D medial surface axis thinning algorithms. CVGIP Graph. Model. Image Process 56, 462–478. doi: 10.1006/cgip.1994.1042. [DOI] [Google Scholar]
- Li Y, Li J, Segal S, Wegiel J, De Santi S, Zhan J, De Leon MJ, 2006. Hippocampal cerebrospinal fluid spaces on MR imaging: relationship to aging and Alzheimer disease. AJNR Am. J. Neuroradiol 27, 912. [PMC free article] [PubMed] [Google Scholar]
- Lian C, Zhang J, Liu M, Zong X, Hung SC, Lin W, Shen D, 2018. Multi-channel multi-scale fully convolutional network for 3D perivascular spaces segmentation in 7T MR images. Med. Image Anal 46, 106–117. doi: 10.1016/J.MEDIA.2018.02.009. [DOI] [PMC free article] [PubMed] [Google Scholar]
- Liang D, Bhatta S, Gerzanich V, Simard JM, 2007. Cytotoxic edema: mechanisms of pathological cell swelling. Neurosurg. Focus 22, 1–9. doi: 10.3171/FOC.2007.22.5.3. [DOI] [PMC free article] [PubMed] [Google Scholar]
- Liu C, Habib T, Salimeen M, Pradhan A, Singh M, Wang M, Wu F, Zhang Y, Gao L, Yang G, Li X, Yang J, 2020. Quantification of visible Virchow–Robin spaces for detecting the functional status of the glymphatic system in children with newly diagnosed idiopathic generalized epilepsy. Seizure 78, 12–17. doi: 10.1016/j.seizure.2020.02.015. [DOI] [PubMed] [Google Scholar]
- Lynch KM, Barisano G, Toga AW, Sepehrband F, 2020. Perivascular space imaging across the lifespan. In: Proceedingsof the International Society for Magnetic Resonance in Medicine [Google Scholar]
- Mader TH, Gibson CR, Pass AF, Kramer LA, Lee AG, Fogarty J, Tarver WJ, Dervay JP, Hamilton DR, Sargsyan A, Phillips JL, Tran D, Lipsky W, Choi J, Stern C, Kuyumjian R, Polk JD, 2011. Optic disc edema, globe flattening, choroidal folds, and hyperopic shifts observed in astronauts after long-duration space flight. Ophthalmology 118, 2058–2069. doi: 10.1016/j.ophtha.2011.06.021. [DOI] [PubMed] [Google Scholar]
- Makale M, Solomon J, Patronas NJ, Danek A, Butman JA, Grafman J, 2002. Quantification of brain lesions using interactive automated software. Behav. Res. Methods Instrum. Comput 34, 6–18. doi: 10.3758/BF03195419. [DOI] [PubMed] [Google Scholar]
- Månberg A, Skene N, Sanders F, Trusohamn M, Remnestål J, Szczepińska A, Aksoylu IS, Lönnerberg P, Ebarasi L, Wouters S, Lehmann M, Olofsson J, von Gohren Antequera I, Domaniku A, De Schaepdryver M, De Vocht J, Poesen K, Uhlén M, Anink J, Mijnsbergen C, Vergunst-Bosch H, Hübers A, Kläppe U, Rodriguez-Vieitez E, Gilthorpe JD, Hedlund E, Harris RA, Aronica E, Van Damme P, Ludolph A, Veldink J, Ingre C, Nilsson P, Lewandowski SA, 2021. Altered perivascular fibroblast activity precedes ALS disease onset. Nat. Med 27, 640–646. doi: 10.1038/s41591-021-01295-9. [DOI] [PMC free article] [PubMed] [Google Scholar]
- Mancardi GL, Romagnoli P, Tassinari T, Gandolfo C, Primavera A, Loeb C, 1988. Lacunae and cribriform cavities of the brain: correlations with pseudobulbar palsy and parkinsonism. Eur. Neurol 28, 11–17. doi: 10.1159/000116220. [DOI] [PubMed] [Google Scholar]
- Martinez-Ramirez S, Pontes-Neto OM, Dumas AP, Auriel E, Halpin A, Quimby M, Gurol ME, Greenberg SM, Viswanathan A, 2013. Topography of dilated perivascular spaces in subjects from a memory clinic cohort. Neurology 80, 1551–1556. doi: 10.1212/WNL.0b013e31828f1876. [DOI] [PMC free article] [PubMed] [Google Scholar]
- Mateo C, Knutsen PM, Tsai PS, Shih AY, Kleinfeld D, 2017. Entrainment of arteriole vasomotor fluctuations by neural activity is a basis of blood-oxygenation-level-dependent “resting-state” connectivity. Neuron 96, 936–948. doi: 10.1016/J.NEURON.2017.10.012. [DOI] [PMC free article] [PubMed] [Google Scholar]
- Mawuenyega KG, Sigurdson W, Ovod V, Munsell L, Kasten T, Morris JC, Yarasheski KE, Bateman RJ, 2010. Decreased clearance of CNS β-amyloid in Alzheimer’s disease. Science 330, 1774. doi: 10.1126/science.1197623. [DOI] [PMC free article] [PubMed] [Google Scholar]
- McKnight CD, Trujillo P, Lopez AM, Petersen K, Considine C, Lin Y−C, Yan Y, Kang H, Donahue MJ, Claassen DO, 2021. Diffusion along perivascular spaces reveals evidence supportive of glymphatic function impairment in Parkinson’s disease. Parkinsonism Relat. Disord 89, 98–104. doi: 10.1016/j.parkreldis.2021.06.004. [DOI] [PMC free article] [PubMed] [Google Scholar]
- Mehta SH, Nichols FT, Espay AJ, Duker AP, Morgan JC, Sethi KD, 2013. Dilated Virchow-Robin spaces and parkinsonism. Mov. Disord 28, 589–590. doi: 10.1002/mds.25474. [DOI] [PubMed] [Google Scholar]
- Mestre H, Du T, Sweeney AM, Liu G, Samson AJ, Peng W, Mortensen KN, Stæger FF, Bork PAR, Bashford L, Toro ER, Tithof J, Kelley DH, Thomas JH, Hjorth PG, Martens EA, Mehta RI, Solis O, Blinder P, Kleinfeld D, Hirase H, Mori Y, Nedergaard M, 2020. Cerebrospinal fluid influx drives acute ischemic tissue swelling. Science 367. doi: 10.1126/science.aax7171. [DOI] [PMC free article] [PubMed] [Google Scholar]
- Mestre H, Tithof J, Du T, Song W, Peng W, Sweeney AM, Olveda G, Thomas JH, Nedergaard M, Kelley DH, 2018. Flow of cerebrospinal fluid is driven by arterial pulsations and is reduced in hypertension. Nat. Commun 9, 4878. doi: 10.1038/s41467-018-07318-3. [DOI] [PMC free article] [PubMed] [Google Scholar]
- Mestre TA, Armstrong MJ, Walsh R, Al Dakheel A, Moro E, Stoessl AJ, Lang AE, 2014. Can isolated enlarged Virchow-Robin spaces influence the clinical manifestations of Parkinson’s disease? Mov. Disord. Clin. Pract 1, 67–69. doi: 10.1002/mdc3.12009. [DOI] [PMC free article] [PubMed] [Google Scholar]
- Miyata M, Kakeda S, Iwata S, Nakayamada S, Ide S, Watanabe K, Moriya J, Tanaka Y, Korogi Y, 2017. Enlarged perivascular spaces are associated with the disease activity in systemic lupus erythematosus. Sci. Rep 7, 1–10. doi: 10.1038/s41598-017-12966-4. [DOI] [PMC free article] [PubMed] [Google Scholar]
- Montagne A, Nikolakopoulou AM, Zhao Z, Sagare AP, Si G, Lazic D, Barnes SR, Daianu M, Ramanathan A, Go A, Lawson EJ, Wang Y, Mack WJ, Thompson PM, Schneider JA, Varkey J, Langen R, Mullins E, Jacobs RE, Zlokovic BV, 2018. Pericyte degeneration causes white matter dysfunction in the mouse central nervous system. Nat. Med 24, 326–337. doi: 10.1038/nm.4482. [DOI] [PMC free article] [PubMed] [Google Scholar] [Retracted]
- Novikov DS, Fieremans E, Jespersen SN, Kiselev VG, 2019. Quantifying brain microstructure with diffusion MRI: theory and parameter estimation. NMR Biomed 32, 1–53. doi: 10.1002/nbm.3998. [DOI] [PMC free article] [PubMed] [Google Scholar]
- Opel RA, Christy A, Boespflug EL, Weymann KB, Case B, Pollock JM, Silbert LC, Lim MM, 2019. Effects of traumatic brain injury on sleep and enlarged perivascular spaces. J. Cereb. Blood Flow Metab 39, 2258–2267. doi: 10.1177/0271678x18791632. [DOI] [PMC free article] [PubMed] [Google Scholar]
- Osborn AG, Barisano G, Osborn AG, Salzman K, Anderson JS, Toga AW, Law M, Ross JS, Moore KR, 2020. Scalp, skull, and meninges. In: Imaging Anatomy Brain and Spine Elsevier Health Sciences, pp. 18–25. [Google Scholar]
- Ozato N, Saitou S, Yamaguchi T, Katashima M, Misawa M, Jung S, Mori K, Kawada H, Katsuragi Y, Mikami T, Nakaji S, 2021. Association between visceral fat and brain structural changes or cognitive function. Brain Sci 11, 1036. doi: 10.3390/brainsci11081036. [DOI] [PMC free article] [PubMed] [Google Scholar]
- Park SH, Zong X, Gao Y, Lin W, Shen D, 2016. Segmentation of perivascular spaces in 7 T MR image using auto-context model with orientation-normalized features. Neuroimage 134, 223–235. doi: 10.1016/j.neuroimage.2016.03.076. [DOI] [PMC free article] [PubMed] [Google Scholar]
- Park YW, Shin NY, Chung SJ, Kim J, Lim SM, Lee PH, Lee SK, Ahn KJ, 2019. Magnetic resonance imaging–visible perivascular spaces in basal ganglia predict cognitive decline in Parkinson’s disease. Mov. Disord 34, 1672–1679. doi: 10.1002/mds.27798. [DOI] [PubMed] [Google Scholar]
- Patankar TF, Mitra D, Varma A, Snowden J, Neary D, Jackson A, 2005. Dilatation of the Virchow-Robin space is a sensitive indicator of cerebral microvascular disease: study in elderly patients with dementia. AJNR Am. J. Neuroradiol 26, 1512–1520. [PMC free article] [PubMed] [Google Scholar]
- Pérès EA, Etienne O, Grigis A, Boumezbeur F, Boussin D, Le Bihan D, 2018. Longitudinal study of irradiation-induced brain microstructural alterations with S-index, a diffusion MRI biomarker, and MR spectroscopy. Int. J. Radiat. Oncol. Biol. Phys 102, 1244–1254. doi: 10.1016/j.ijrobp.2018.01.070. [DOI] [PubMed] [Google Scholar]
- Perosa V, Oltmer J, Munting LP, Freeze WM, Auger CA, Scherlek AA, van der Kouwe AJ, Iglesias JE, Atzeni A, Bacskai BJ, Viswanathan A, Frosch MP, Greenberg SM, van Veluw SJ, 2022. Perivascular space dilation is associated with vascular amyloid-β accumulation in the overlying cortex. Acta Neuropathol 143, 331–348. doi: 10.1007/s00401-021-02393-1. [DOI] [PMC free article] [PubMed] [Google Scholar]
- Piantino J, Boespflug EL, Schwartz DL, Luther M, Morales AM, Lin A, Fossen RV, Silbert L, Nagel BJ, 2020. Characterization of MR imaging-visible perivascular spaces in the white matter of healthy adolescents at 3T. Am. J. Neuroradiol 41, 2139–2145. doi: 10.3174/ajnr.A6789. [DOI] [PMC free article] [PubMed] [Google Scholar]
- Pierpaoli C, Jones DK, 2004. Removing CSF contamination in brain DT-MRIs by using a two-compartment tensor model. In: Proceedings of the 12th Annual Meeting ISMRM, Kyoto c, p. 1215. [Google Scholar]
- Pollock H, Hutchings M, Weller RO, Zhang ET, 1997. Perivascular spaces in the basal ganglia of the human brain: their relationship to lacunes. J. Anat 191, 337–346. doi: 10.1017/S0021878297002458. [DOI] [PMC free article] [PubMed] [Google Scholar]
- Potter GM, Chappell FM, Morris Z, Wardlaw JM, 2015a. Cerebral perivascular spaces visible on magnetic resonance imaging: development of a qualitative rating scale and its observer reliability. Cerebrovasc. Dis 39, 224–231. doi: 10.1159/000375153. [DOI] [PMC free article] [PubMed] [Google Scholar]
- Potter GM, Doubal FN, Jackson CA, Chappell FM, Sudlow CL, Dennis MS, Wardlaw JM, 2015b. Enlarged perivascular spaces and cerebral small vessel disease. Int. J. Stroke 10, 376–381. doi: 10.1111/ijs.12054. [DOI] [PMC free article] [PubMed] [Google Scholar]
- Ramirez J, Berezuk C, Mcneely AA, Scott CJM, Gao F, Black SE, 2015. Visible Virchow-Robin spaces on magnetic resonance imaging of Alzheimer’s disease patients and normal elderly from the sunnybrook dementia study. J. Alzheimer Dis 43, 415–424. doi: 10.3233/JAD-132528. [DOI] [PubMed] [Google Scholar]
- Ramirez J, Gibson E, Quddus A, Lobaugh NJ, Feinstein A, Levine B, Scott CJM, Levy-Cooperman N, Gao FQ, Black SE, 2011. Lesion explorer: a comprehensive segmentation and parcellation package to obtain regional volumetrics for subcortical hyperintensities and intracranial tissue. Neuroimage 54, 963–973. doi: 10.1016/J.NEUROIMAGE.2010.09.013. [DOI] [PubMed] [Google Scholar]
- Ringstad G, Vatnehol SAS, Eide PK, 2017. Glymphatic MRI in idiopathic normal pressure hydrocephalus. Brain 140, 2691–2705. doi: 10.1093/brain/awx191. [DOI] [PMC free article] [PubMed] [Google Scholar]
- Roberts DR, Albrecht MH, Collins HR, Asemani D, Chatterjee AR, Spampinato MV, Zhu X, Chimowitz MI, Antonucci MU, 2017. Effects of spaceflight on astronaut brain structure as indicated on MRI. N. Engl. J. Med 377, 1746–1753. doi: 10.1056/NEJMoa1705129. [DOI] [PubMed] [Google Scholar]
- Robin F, 1859. Recherches sur quelques particularites de la structure des capillaires de l’encephale. J. Physiol. Homme Animaux 2, 537–548. [Google Scholar]
- Roher AE, Kuo Y−M, Esh C, Knebel C, Weiss N, Kalback W, Luehrs DC, Childress JL, Beach TG, Weller, Kokjohn TA, 2003. Cortical and leptomeningeal cerebrovascular amyloid and white matter pathology in Alzheimer’s disease. Mol. Med 9, 112–122. [PMC free article] [PubMed] [Google Scholar]
- Rollins NK, Deline C, Morriss MC, 1993. Prevalence and clinical significance of dilated Virchow-Robin spaces in childhood. Radiology 189, 53–57. [DOI] [PubMed] [Google Scholar]
- Rouhl RPW, van Oostenbrugge RJ, Knottnerus ILH, Staals JEA, Lodder J, 2008. Virchow-Robin spaces relate to cerebral small vessel disease severity. J. Neurol 255, 692–696. doi: 10.1007/s00415-008-0777-y. [DOI] [PubMed] [Google Scholar]
- Rudie JD, Rauschecker AM, Nabavizadeh SA, Mohan S, 2018. Neuroimaging of dilated perivascular spaces: from benign and pathologic causes to mimics. J. Neuroimaging 28, 139–149. doi: 10.1111/jon.12493. [DOI] [PMC free article] [PubMed] [Google Scholar]
- Sakhare AR, Barisano G, Pa J, 2019. Assessing test–retest reliability of phase contrast MRI for measuring cerebrospinal fluid and cerebral blood flow dynamics. Magn. Reson. Med 82, 658–670. doi: 10.1002/mrm.27752. [DOI] [PMC free article] [PubMed] [Google Scholar]
- Schwartz DL, Boespflug EL, Lahna DL, Pollock J, Roese NE, Silbert LC, 2019. Autoidentification of perivascular spaces in white matter using clinical field strength T1 and FLAIR MR imaging. Neuroimage 202, 116126. doi: 10.1016/j.neuroimage.2019.116126. [DOI] [PMC free article] [PubMed] [Google Scholar]
- Sepehrband F, Barisano G, Sheikh-Bahaei N, Cabeen RP, Choupan J, Law M, Toga AW, 2019a. Image processing approaches to enhance perivascular space visibility and quantification using MRI. Sci. Rep 9, 12351. doi: 10.1038/s41598-019-48910-x. [DOI] [PMC free article] [PubMed] [Google Scholar]
- Sepehrband F, Barisano G, Sheikh-Bahaei N, Choupan J, Cabeen RP, Lynch KM, Crawford MS, Lan H, Mack WJ, Chui HC, Ringman JM, Toga AW, 2021. Volumetric distribution of perivascular space in relation to mild cognitive impairment. Neurobiol. Aging 99, 28–43. doi: 10.1016/j.neurobiolaging.2020.12.010. [DOI] [PMC free article] [PubMed] [Google Scholar]
- Sepehrband F, Cabeen RP, Barisano G, Sheikh-Bahaei N, Choupan J, Law M, Toga AW, 2019b. Nonparenchymal fluid is the source of increased mean diffusivity in preclinical Alzheimer’s disease. Alzheimer Dement. Diagn. Assess. Dis. Monit 11, 348–354. doi: 10.1016/j.dadm.2019.03.002. [DOI] [PMC free article] [PubMed] [Google Scholar]
- Sepehrband F, Cabeen RP, Choupan J, Barisano G, Law M, Toga AW, 2019c. Perivascular space fluid contributes to diffusion tensor imaging changes in white matter. Neuroimage 197, 243–254. doi: 10.1016/j.neuroimage.2019.04.070. [DOI] [PMC free article] [PubMed] [Google Scholar]
- Sepehrband F, O’Brien K, Barth M, 2017. A time-efficient acquisition protocol for multipurpose diffusion-weighted microstructural imaging at 7 tesla. Magn. Reson. Med 78, 2170–2184. doi: 10.1002/mrm.26608. [DOI] [PubMed] [Google Scholar]
- Shi Y, Thrippleton MJ, Blair GW, Dickie DA, Marshall I, Hamilton I, Doubal FN, Chappell F, Wardlaw JM, 2020. Small vessel disease is associated with altered cerebrovascular pulsatility but not resting cerebral blood flow. J. Cereb. Blood Flow Metab 40, 85–99. doi: 10.1177/0271678x18803956. [DOI] [PMC free article] [PubMed] [Google Scholar]
- Shibata K, Sugiura M, Nishimura Y, Sakura H, 2019. The effect of small vessel disease on motor and cognitive function in Parkinson’s disease. Clin. Neurol. Neurosurg 182, 58–62. doi: 10.1016/j.clineuro.2019.04.029. [DOI] [PubMed] [Google Scholar]
- Shokri-Kojori E, Wang GJ, Wiers CE, Demiral SB, Guo M, Kim SW, Lindgren E, Ramirez V, Zehra A, Freeman C, Miller G, Manza P, Srivastava T, De Santi S, Tomasi D, Benveniste H, Volkow ND, 2018. β-Amyloid accumulation in the human brain after one night of sleep deprivation. Proc. Natl. Acad. Sci. U. S. A 115, 4483–4488. doi: 10.1073/pnas.1721694115. [DOI] [PMC free article] [PubMed] [Google Scholar]
- Song TJ, Park JH, Choi K, Chang Y, Moon J, Kim JH, Choi Y, Kim YJ, Lee HW, 2017. Moderate-to-severe obstructive sleep apnea is associated with cerebral small vessel disease. Sleep Med 30, 36–42. doi: 10.1016/j.sleep.2016.03.006. [DOI] [PubMed] [Google Scholar]
- Stapleton PA, James ME, Goodwill AG, Frisbee JC, 2008. Obesity and vascular dysfunction. Pathophysiology 15, 79–89. doi: 10.1016/j.pathophys.2008.04.007. [DOI] [PMC free article] [PubMed] [Google Scholar]
- Steward CE, Venkatraman VK, Lui E, Malpas CB, Ellis KA, Cyarto EV, Vivash L, O’Brien TJ, Velakoulis D, Ames D, Masters CL, Lautenschlager NT, Bammer R, Desmond PM, 2021. Assessment of the DTI-ALPS parameter along the perivascular space in older adults at risk of dementia. J. Neuroimaging 31, 569–578. doi: 10.1111/jon.12837. [DOI] [PubMed] [Google Scholar]
- Stokum JA, Gerzanich V, Simard JM, 2016. Molecular pathophysiology of cerebral edema. J. Cereb. Blood Flow Metab 36, 513–538. doi: 10.1177/0271678x15617172. [DOI] [PMC free article] [PubMed] [Google Scholar]
- Sudre CH, Anson BG, Ingala S, Lane CD, Jimenez D, Haider L, Varsavsky T, Smith L, Jäger HR, Cardoso MJ, 2018. 3D multirater RCNN for multimodal multiclass detection and characterisation of extremely small objects. Proc. Mach. Learn. Res. Rev 1–10. [Google Scholar]
- Sweeney MD, Sagare AP, Zlokovic BV, 2018. Blood-brain barrier breakdown in Alzheimer disease and other neurodegenerative disorders. Nat. Rev. Neurol doi: 10.1038/nrneurol.2017.188. [DOI] [PMC free article] [PubMed] [Google Scholar]
- Taber KH, Shaw JB, Loveland KA, Pearson DA, Lane DM, Hayman LA, 2004. Accentuated Virchow-Robin spaces in the centrum semiovale in children with autistic disorder. J. Comput. Assist. Tomogr 28, 263–268. doi: 10.1097/00004728-200403000-00017. [DOI] [PubMed] [Google Scholar]
- Taoka T, Masutani Y, Kawai H, Nakane T, Matsuoka K, Yasuno F, Kishimoto T, Naganawa S, 2017. Evaluation of glymphatic system activity with the diffusion MR technique: diffusion tensor image analysis along the perivascular space (DTI-ALPS) in Alzheimer’s disease cases. Jpn. J. Radiol 35, 172–178. doi: 10.1007/s11604-017-0617-z. [DOI] [PubMed] [Google Scholar]
- Taoka T, Naganawa S, Kawai H, Nakane T, Murata K, 2019. Can low b value diffusion weighted imaging evaluate the character of cerebrospinal fluid dynamics? Jpn. J. Radiol 37, 135–144. doi: 10.1007/s11604-018-0790-8. [DOI] [PubMed] [Google Scholar]
- Tarasoff-Conway JM, Carare RO, Osorio RS, Glodzik L, Butler T, Fieremans E, Axel L, Rusinek H, Nicholson C, Zlokovic BV, Frangione B, Blennow K, Ménard J, Zetterberg H, Wisniewski T, de Leon MJ, 2015. Clearance systems in the brain—Implications for Alzheimer disease. Nat. Rev. Neurol 11, 457–470. doi: 10.1038/nrneurol.2015.119. [DOI] [PMC free article] [PubMed] [Google Scholar]
- Thomas C, Sadeghi N, Nayak A, Trefler A, Sarlls J, Baker CI, Pierpaoli C, 2018. Impact of time-of-day on diffusivity measures of brain tissue derived from diffusion tensor imaging. Neuroimage 173, 25–34. doi: 10.1016/j.neuroimage.2018.02.026. [DOI] [PubMed] [Google Scholar]
- Trefler A, Sadeghi N, Thomas AG, Pierpaoli C, Baker CI, Thomas C, 2016. Impact of time-of-day on brain morphometric measures derived from T1-weighted magnetic resonance imaging. Neuroimage 133, 41–52. doi: 10.1016/j.neuroimage.2016.02.034. [DOI] [PMC free article] [PubMed] [Google Scholar]
- Troili F, Cipollini V, Moci M, Morena E, Palotai M, Rinaldi V, Romano C, Ristori G, Giubilei F, Salvetti M, Orzi F, Guttmann CRG, Cavallari M, 2020. Perivascular unit: this must Be the place. The anatomical crossroad between the immune, vascular and nervous system. Front. Neuroanat 14, 17. doi: 10.3389/fnana.2020.00017. [DOI] [PMC free article] [PubMed] [Google Scholar]
- Uchiyama Y, Kunieda T, Asano T, Kato H, Hara T, Kanematsu M, Iwama T, Hoshi H, Kinosada Y, Fujita H, 2008. Computer-aided diagnosis scheme for classification of lacunar infarcts and enlarged Virchow-Robin spaces in brain MR images. In: Proceedings of the 30th Annual International Conference of the IEEE Engineering in Medicine and Biology Society. IEEE, pp. 3908–3911. doi: 10.1109/iembs.2008.4650064.. [DOI] [PubMed] [Google Scholar]
- Valdés Hernández MC, Piper RJ, Wang X, Deary IJ, Wardlaw JM, 2013. Towards the automatic computational assessment of enlarged perivascular spaces on brain magnetic resonance images: a systematic review. J. Magn. Reson. Imaging 38, 774–785. doi: 10.1002/jmri.24047. [DOI] [PubMed] [Google Scholar]
- van der Zwan A, Hillen B, Tulleken CAF, Dujovny M, 1993. A quantitative investigation of the variability of the major cerebral arterial territories. Stroke 24, 1951–1959. doi: 10.1161/01.STR.24.12.1951. [DOI] [PubMed] [Google Scholar]
- Van Ombergen A, Jillings S, Jeurissen B, Tomilovskaya E, Rühl RM, Rumshiskaya A, Nosikova I, Litvinova L, Annen J, Pechenkova EV, Kozlovskaya IB, Sunaert S, Parizel PM, Sinitsyn V, Laureys S, Sijbers J, zu Eulenburg P, Wuyts FL, 2018. Brain tissue–volume changes in cosmonauts. N. Engl. J. Med 379, 1678–1680. doi: 10.1056/NEJMc1809011. [DOI] [PubMed] [Google Scholar]
- Van Ombergen A, Jillings S, Jeurissen B, Tomilovskaya E, Rumshiskaya A, Litvinova L, Nosikova I, Pechenkova E, Rukavishnikov I, Manko O, Danylichev S, Rühl RM, Kozlovskaya IB, Sunaert S, Parizel PM, Sinitsyn V, Laureys S, Sijbers J, Zu Eulenburg P, Wuyts FL, 2019. Brain ventricular volume changes induced by long-duration spaceflight. Proc. Natl. Acad. Sci. U. S. A 116, 10531–10536. doi: 10.1073/pnas.1820354116. [DOI] [PMC free article] [PubMed] [Google Scholar]
- van Veluw SJ, Biessels GJ, Bouvy WH, Spliet WG, Zwanenburg JJ, Luijten PR, Macklin EA, Rozemuller AJ, Gurol ME, Greenberg SM, Viswanathan A, Martinez-Ramirez S, 2016. Cerebral amyloid angiopathy severity is linked to dilation of juxtacortical perivascular spaces. J. Cereb. Blood Flow Metab 36, 576–580. doi: 10.1177/0271678x15620434. [DOI] [PMC free article] [PubMed] [Google Scholar]
- van Veluw SJ, Hou SS, Calvo-Rodriguez M, Arbel-Ornath M, Snyder AC, Frosch MP, Greenberg SM, Bacskai BJ, 2020. Vasomotion as a driving force for paravascular clearance in the awake mouse brain. Neuron 105, 549–561. doi: 10.1016/J.NEURON.2019.10.033. [DOI] [PMC free article] [PubMed] [Google Scholar]
- Virchow R, 1851. Ueber die erweiterung kleinerer gefäfse - hierzu tab. IV. Arch. Pathol. Anat. Physiol. Klin. Med 3, 427–462. doi: 10.1007/BF01960918. [DOI] [Google Scholar]
- von Morze C, Xu D, Purcell DD, Hess CP, Mukherjee P, Saloner D, Kelley DAC, Vigneron DB, 2007. Intracranial time-of-flight MR angiography at 7T with comparison to 3T. J. Magn. Reson. Imaging 904, 900–904. doi: 10.1002/jmri.21097. [DOI] [PubMed] [Google Scholar]
- Wan Y, Hu W, Gan J, Song L, Wu N, Chen Y, Liu Z, 2019. Exploring the association between cerebral small-vessel diseases and motor symptoms in Parkinson’s disease. Brain Behav 9, 1–8. doi: 10.1002/brb3.1219. [DOI] [PMC free article] [PubMed] [Google Scholar]
- Wang X, Valdés Hernández M, Doubal F, Chappell FM, Piper RJ, Deary IJ, Wardlaw JM, 2016. Development and initial evaluation of a semi-automatic approach to assess perivascular spaces on conventional magnetic resonance images. J. Neurosci. Methods 257, 34–44. doi: 10.1016/j.jneumeth.2015.09.010. [DOI] [PMC free article] [PubMed] [Google Scholar]
- Wardlaw JM, Smith EE, Biessels GJ, Cordonnier C, Fazekas F, Frayne R, Lindley RI, O’Brien JT, Barkhof F, Benavente OR, Black SE, Brayne C, Breteler M, Chabriat H, Decarli C, de Leeuw F−E, Doubal F, Duering M, Fox NC, Greenberg S, Hachinski V, Kilimann I, Mok V, Oostenbrugge R, Pantoni L, Speck O, Stephan BCM, Teipel S, Viswanathan A, Werring D, Chen C, Smith C, van Buchem M, Norrving B, Gorelick PB, Dichgans M, 2013. STandards for reporting vascular changes on neuroimaging (STRIVE v1), St. for R.V. changes on neuroimaging (STRIVE, 2013. Neuroimaging standards for research into small vessel disease and its contribution to ageing and neurodegeneration. Lancet Neurol 12, 822–838. doi: 10.1016/S1474-4422(13)70124-8. [DOI] [PMC free article] [PubMed] [Google Scholar]
- Watts R, Steinklein J, Waldman L, Zhou X, Filippi C, 2019. Measuring glymphatic flow in man using quantitative contrast-enhanced MRI. AJNR. Am. J. Neuroradiol 40, 648–651. doi: 10.3174/AJNR.A5931. [DOI] [PMC free article] [PubMed] [Google Scholar]
- Wong AD, Ye M, Levy AF, Rothstein JD, Bergles DE, Searson PC, 2013. The blood-brain barrier: an engineering perspective. Front. Neuroeng 6, 1–22. doi: 10.3389/fneng.2013.00007. [DOI] [PMC free article] [PubMed] [Google Scholar]
- Wong SM, Backes WH, Drenthen GS, Zhang CE, Voorter PHM, Staals J, van Oostenbrugge RJ, Jansen JFA, 2020. Spectral diffusion analysis of intravoxel incoherent motion MRI in cerebral small vessel disease. J. Magn. Reson. Imaging 51, 1170–1180. doi: 10.1002/jmri.26920. [DOI] [PMC free article] [PubMed] [Google Scholar]
- Wong SM, Zhang CE, van Bussel FCG, Staals J, Jeukens CRLPN, Hofman PAM, van Oostenbrugge RJ, Backes WH, Jansen JFA, 2017. Simultaneous investigation of microvasculature and parenchyma in cerebral small vessel disease using intravoxel incoherent motion imaging. NeuroImage Clin 14, 216–221. doi: 10.1016/j.nicl.2017.01.017. [DOI] [PMC free article] [PubMed] [Google Scholar]
- Woollam DH, Millen JW, 1955. The perivascular spaces of the mammalian central nervous system and their relation to the perineuronal and subarachnoid spaces. J. Anat 89, 193–200. [PMC free article] [PubMed] [Google Scholar]
- Wuerfel J, Haertle M, Waiczies H, Tysiak E, Bechmann I, Wernecke KD, Zipp F, Paul F, 2008. Perivascular spaces - MRI marker of inflammatory activity in the brain? Brain 131, 2332–2340. doi: 10.1093/brain/awn171. [DOI] [PubMed] [Google Scholar]
- Xie L, Kang H, Xu Q, Chen MJ, Liao Y, Thiyagarajan M, O’Donnell J, Christensen DJ, Nicholson C, Iliff JJ, Takano T, Deane R, Nedergaard M, 2013. Sleep drives metabolite clearance from the adult brain. Science 342, 373–377. doi: 10.1126/science.1241224. [DOI] [PMC free article] [PubMed] [Google Scholar]
- Xu Z, Xiao N, Chen Y, Huang H, Marshall C, Gao J, Cai Z, Wu T, Hu G, Xiao M, 2015. Deletion of aquaporin-4 in APP/PS1 mice exacerbates brain Aβ accumulation and memory deficits. Mol. Neurodegener 10, 58. [DOI] [PMC free article] [PubMed] [Google Scholar]
- Yakushiji Y, Charidimou A, Hara M, Noguchi T, Nishihara M, Eriguchi M, Nanri Y, Nishiyama M, Werring DJ, Hara H, 2014. Topography and associations of perivascular spaces in healthy adults: the kashima scan study. Neurology 83, 2116–2123. doi: 10.1212/WNL.0000000000001054. [DOI] [PubMed] [Google Scholar]
- Yang G, Deng N, Liu Y, Gu Y, Yao X, 2020. Evaluation of glymphatic system using diffusion MR technique in T2DM cases. Front. Hum. Neurosci 14. doi: 10.3389/fnhum.2020.00300. [DOI] [PMC free article] [PubMed] [Google Scholar]
- Yao M, Zhu Y, Soumaré A, Dufouil C, Mazoyer B, Tzourio C, Chabriat H, 2014. Hippocampal perivascular spaces are related to aging and blood pressure but not to cognition. Neurobiol. Aging 35, 2118–2125. doi: 10.1016/J.NEUROBIOLAGING.2014.03.021. [DOI] [PubMed] [Google Scholar]
- Yokota H, Vijayasarathi A, Cekic M, Hirata Y, Linetsky M, Ho M, Kim W, Salamon N, 2019. Diagnostic performance of glymphatic system evaluation using diffusion tensor imaging in idiopathic normal pressure hydrocephalus and mimickers. Curr. Gerontol. Geriatr. Res doi: 10.1155/2019/5675014. [DOI] [PMC free article] [PubMed] [Google Scholar]
- Zhang ET, Inman CB, Weller RO, 1990. Interrelationships of the pia mater and the perivascular (Virchow-Robin) spaces in the human cerebrum. J. Anat 170, 111–123. [PMC free article] [PubMed] [Google Scholar]
- Zhang H, Schneider T, Wheeler-Kingshott CA, Alexander DC, 2012. NODDI: practical in vivo neurite orientation dispersion and density imaging of the human brain. Neuroimage 61, 1000–1016. doi: 10.1016/J.NEUROIMAGE.2012.03.072. [DOI] [PubMed] [Google Scholar]
- Zhang J, Gao Y, Park SH, Zong X, Lin W, Shen D, 2017. Structured learning for 3-D perivascular space segmentation using vascular features. IEEE Trans. Biomed. Eng 64, 2803–2812. doi: 10.1109/TBME.2016.2638918. [DOI] [PMC free article] [PubMed] [Google Scholar]
- Zhang X, Ding L, Yang L, Qin W, Yuan J, Li S, Hu W, 2016. Brain atrophy correlates with severe enlarged perivascular spaces in basal ganglia among lacunar stroke patients. PLoS One 11, 1–9. doi: 10.1371/journal.pone.0149593. [DOI] [PMC free article] [PubMed] [Google Scholar]
- Zhu Y−C, Dufouil C, Mazoyer B, Soumaré A, Ricolfi F, Tzourio C, Chabriat H, 2011. Frequency and location of dilated Virchow-Robin spaces in elderly people: a population-based 3D MR imaging study. Am. J. Neuroradiol 32, 709–713. doi: 10.3174/ajnr.A2366. [DOI] [PMC free article] [PubMed] [Google Scholar]
- Zhu Y−C, Dufouil C, Soumaré A, Mazoyer B, Chabriat H, Tzourio C, 2010a. High degree of dilated Virchow-Robin spaces on MRI is associated with increased risk of dementia. J. Alzheimer Dis 22, 663–672. doi: 10.3233/JAD-2010-100378. [DOI] [PubMed] [Google Scholar]
- Zhu Y−C, Tzourio C, Soumaré A, Mazoyer B, Dufouil C, Chabriat H, 2010b. Severity of dilated Virchow-Robin spaces is associated with age, blood pressure, and MRI markers of small vessel disease: a population-based study. Stroke 41, 2483–2490. doi: 10.1161/STROKEAHA.110.591586. [DOI] [PubMed] [Google Scholar]
- Zong X, Lian C, Jimenez J, Yamashita K, Shen D, Lin W, 2020. Morphology of perivascular spaces and enclosed blood vessels in young to middle-aged healthy adults at 7T: dependences on age, brain region, and breathing gas. Neuroimage 218, 116978. doi: 10.1016/j.neuroimage.2020.116978. [DOI] [PMC free article] [PubMed] [Google Scholar]
- Zong X, Park SH, Shen D, Lin W, 2016. Visualization of perivascular spaces in the human brain at 7T: sequence optimization and morphology characterization. Neuroimage 125, 895–902. doi: 10.1016/j.neuroimage.2015.10.078. [DOI] [PubMed] [Google Scholar]
Associated Data
This section collects any data citations, data availability statements, or supplementary materials included in this article.
Data Availability Statement
MRI and clinical data can be accessed from https://www.humanconnectome.org.
MRI data included in our manuscript can be accessed from https://www.humanconnectome.org.