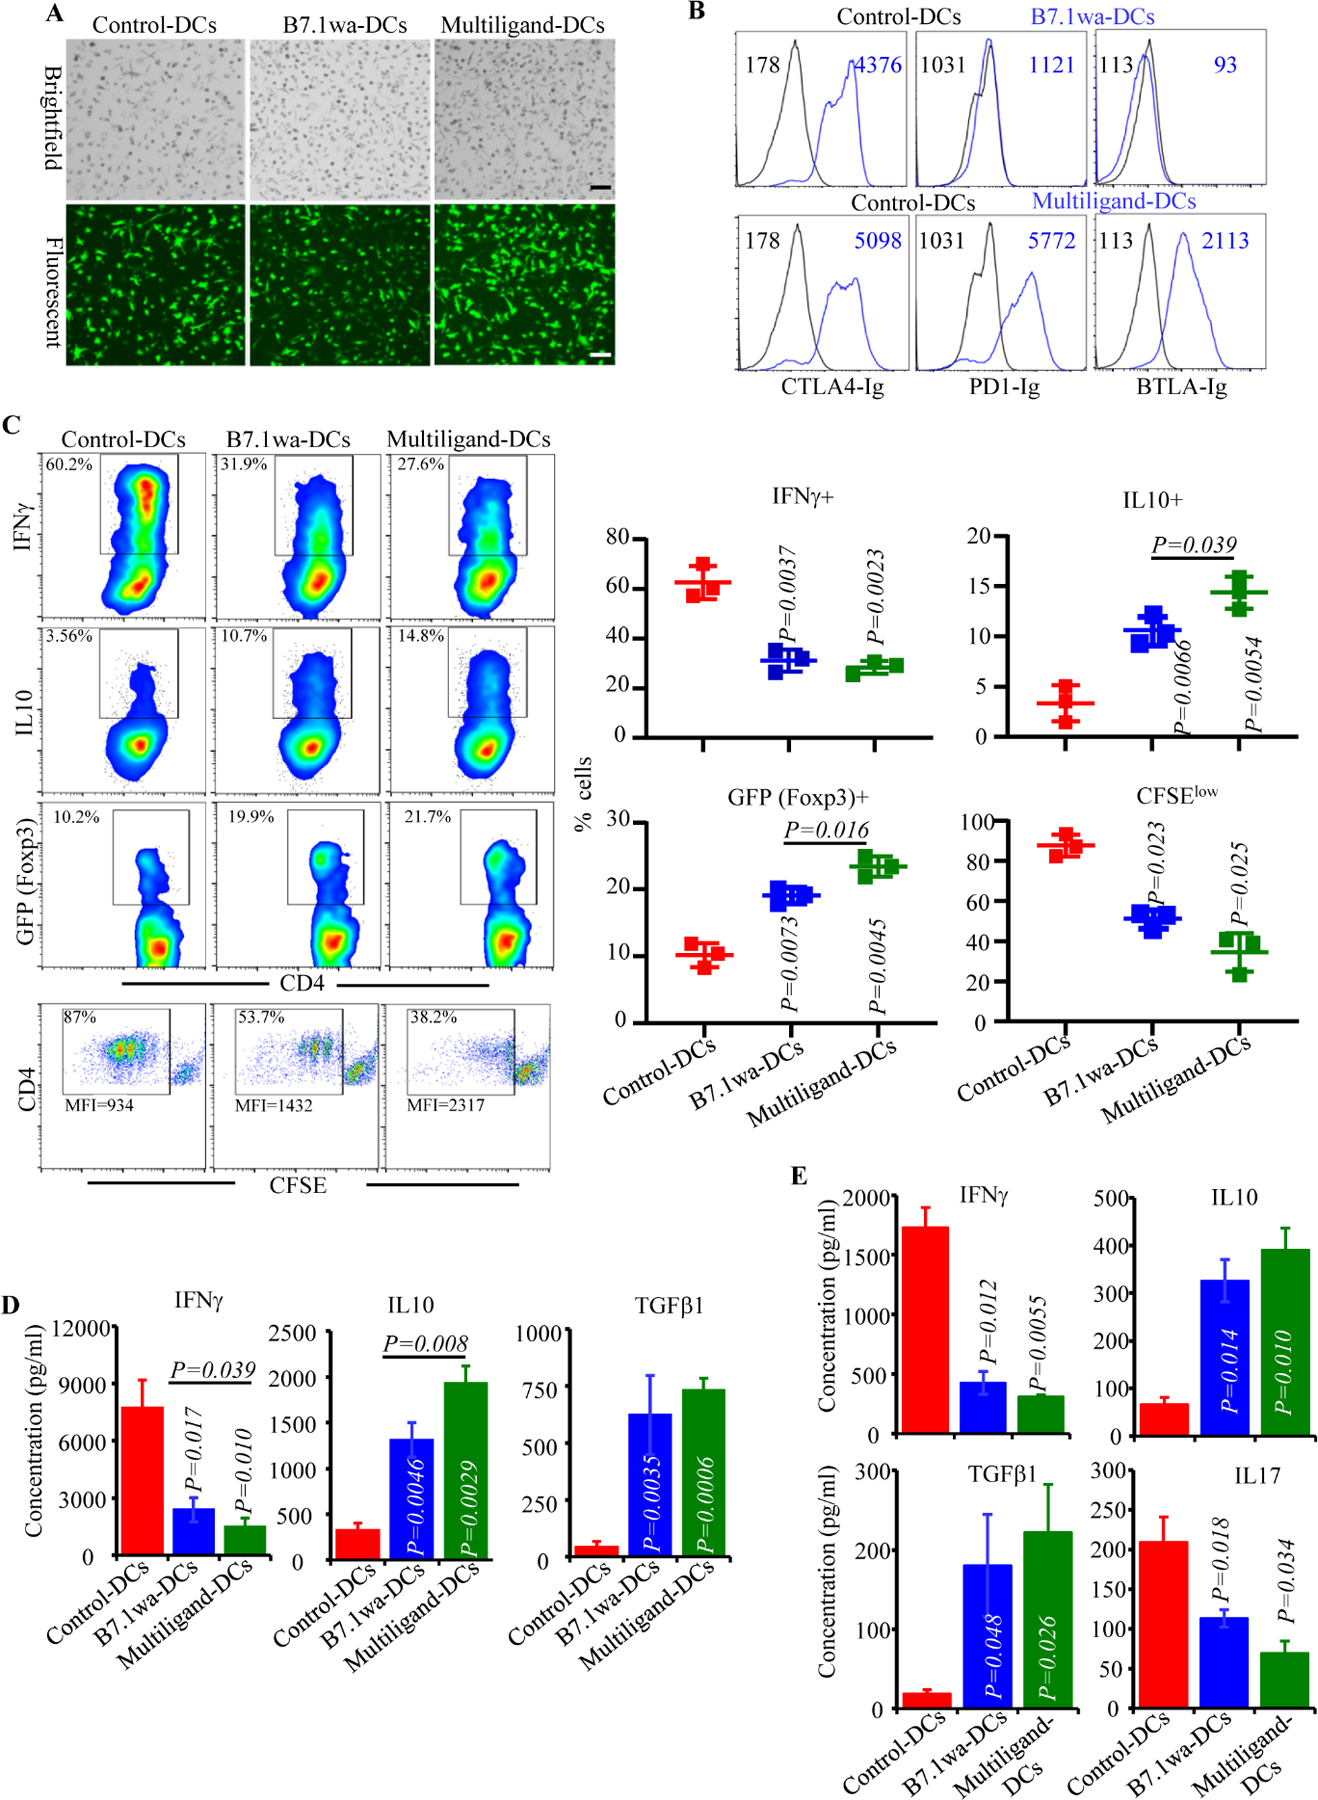
FIGURE 1: Characterization of the antigen presenting properties of engineered NOD mouse DCs.

NOD mouse BM DCs were transduced with lentiviral vectors as described in Materials and methods. A) Examples of transduction of DCs using various preparations of virus with GFP reporter are shown. B) Functional ligand expression levels on DCs were determined after incubating with soluble receptors (CTLA4-Ig, PD1-Ig or BTLA-Ig), followed by PE-labeled Fab(2) fragment of anti-IgG (Fc specific) Ab and testing by FACS. Histogram overlay graphs (representative of 3 independent experiments) showing ligand specific staining of control virus transduced and ligand virus transduced DCs along with mean fluorescence intensity (MFI) values are shown. Both control and ligand DCs were also stained using control Ig reagents to assess the background staining (not shown). C) BDC2.5-peptide pulsed engineered DCs were used in antigen presentation assays by culturing them with CD4+ cells isolated from BDC2.5 mouse spleens. After 4 days, cells from the primary cultures were stimulated using PMA and ionomycin, in the presence of Brefeldin A for 4h, stained for intracellular cytokines IFNγ and IL10, and subjected to FACS analysis. CD4+ T cells from BDC2.5-Foxp3-GFP mice were also used in primary cultures for 4 days and subjected to FACS to determine GFP+ CD4+ cell frequencies by FACS. In addition, CFSE labeled CD4+ T cells from BDC2.5 mice were used in primary culture for 4 days and examined for percentage of cells with CFSE dilution and their MFI by FACS. CD4+ cells were gated and representative FACS plots (left) and Mean±SD values of 3 independent experiments (transduction using three preparations of lentivirus), each done in triplicate (right), are shown. D) Equal number of live BDC2.5 T cells isolated from primary cultures, by negative selection magnetic sorting, were cultured with BDC2.5 peptide pulsed fresh splenic DCs for 48h, and supernatants were subjected to Luminex multiplex assay or ELISA. E) PnLN cells from early hyperglycemic NOD mice were cultured with BcAg-pulsed engineered-DCs for 4 days, equal number of T cells isolated from these primary cultures were challenged using BcAg-pulsed fresh splenic DCs, and supernatants were tested for cytokine levels as done for BDC2.5 T cells. pCDH1-multiligand vector, instead of individual ligand vectors, was used for generating multiligand-DCs for panel E. Mean±SD values of 3 independent experiments (transduction using three preparations of lentivirus), each done in triplicate, are shown for panels D and E. P-value by paired t-test for panels C-E. All P-values are in comparison with control-DC group unless indicated (for B7.1wa group vs multiligand-DC group). All in vitro experiments were repeated multiple times and comparable results were obtained at least thrice. In some experiments, two to three batches of viral preparations were tested in parallel and results from one such representative experiment are shown.
