

Abstract
While females can suffer serious complications of Fabry disease, most studies are limited to males to avoid confounding by mosaicism. Here, we developed a novel unbiased method for quantifying globotriaosylceramide (GL3) inclusion volume in affected podocytes (F+) in females with Fabry disease independent of mosaicism leading to important new observations. All podocytes in male patients with Fabry are F+. The probability of observing random profiles from F+ podocytes without GL3 inclusions (estimation error) was modeled from electron microscopic studies of 99 glomeruli from 40 treatment-naïve males and this model was applied to 28 treatment-naïve females. Also, podocyte structural parameters were compared in 16 age-matched treatment-naïve males and females with classic Fabry disease and 11 normal individuals. A 4th degree polynomial equation best described the relationship between podocyte GL3 volume density and the estimation error (R2 =0.94) and was confirmed by k-fold cross-validation. In females, this model showed that age related directly to F+ podocyte GL3 volume (correlation coefficient (r = 0.54) and podocyte volume (r = 0.48) and inversely to podocyte number density (r = −0.56), (all significant). F+ podocyte GL3 volume was significantly inversely related to podocyte number density (r = −0.79) and directly to proteinuria. There was no difference in F+ podocyte GL3 volume or volume fraction between age-matched males and females. Thus, in females with Fabry disease GL3 accumulation in F+ podocytes progresses with age in association with podocyte loss and proteinuria, and F+ podocyte GL3 accumulation in females with Fabry is similar to males, consistent with insignificant cross-correction between affected and non-affected podocytes. Hence, these findings have important pathophysiological and clinical implications.
Keywords: Fabry, podocyte, globotriaosylceramide, GL3, mosaicism, biopsy, pathology
INTRODUCTION
Deficiency of the α-galactosidase-A (α-Gal-A) enzyme in Fabry disease leads to accumulation of its substrates, predominately globotriaosylceramide (GL3), in multiple cell types and organs with risks of life limiting complications including strokes, cardiac arrhythmias and cardiac and renal failure.1 α-Gal-A is encoded by the GLA gene on the X-chromosome. Similar to other X-linked diseases, clinical severity varies more in females,2–4 but can be as severe as in males.5, 6 Although overall risks of significant vital organ injury is lower in females, they are much higher than in the general population, about 15% with serious renal events and similar or higher risks of stroke and cardiac events4 resulting in reduced life expectancy in both sexes.7 Since there are approximately twice as many females than males with Fabry disease8 these percentages underestimate the number of seriously affected females. Random X-chromosome inactivation in females produces admixtures of Fabry phenotype (F+) and non-Fabry phenotype (F−) cells and skewing of X-chromosome inactivation impacts the natural history of Fabry disease.
Podocytes are terminally differentiated cells, critical in maintaining glomerular structure and function.8, 9 Podocyte GL3 accumulation play an important role in Fabry nephropathy. Podocytes are relatively resistant to enzyme replacement therapy (ERT).10, 11 Podocytes don’t readily regenerate following injury10 and their progressive loss from disease12 or aging13 can reach critical levels associated with glomerular scarring. We described podocyte mosaicism in females with Fabry disease14 and reported that the percent of podocytes without GL3 inclusions increased with age, suggesting survival disadvantage for Fabry podocytes. We also noted an inverse relationship between age-adjusted percent of podocytes without GL3 inclusions and foot process width, a sensitive indicator of podocyte injury,15 supporting relationships between X-inactivation and podocyte injury and loss. Podocytes in males with Fabry disease enlarge parallel to the increase in their volume of GL3 inclusions.16, 17 The benefits of ERT17 or chaperone therapy16 in treatment naïve males manifested as decreases in volume of GL3 inclusions per podocyte with a proportional decrease in mean podocyte volume resulting in no change in podocyte GL3 volume fraction. Herein, we describe an unbiased quantitative method to determine podocyte GL3 burden in females.
METHODS
Subjects
Studies were performed in accordance with principles of the Declaration of Helsinki. Written informed consent was obtained from each subject (or the designees for children). Kidney biopsies from sixty-eight (M/F=40/28) treatment naïve Fabry patients were included. Fabry disease was confirmed by leukocyte α-Gal-A activity measurement and/or GLA sequencing. Kidney biopsies were performed as part of clinical trials or as standard of care. Eleven living kidney donor biopsies were studied as controls.
Clinical Information
Age at biopsy, blood pressure, serum creatinine, urinary protein creatinine ratio, Fabry-related symptoms, GLA mutation, α-Gal-A activity, and plasma globotriaosylsphingosine (lyso-GL3) values were extracted from medical records or clinical trial databases. Since leukocyte and plasma α-Gal-A activity levels are strongly correlated,18 in order to make values from different laboratories and different times comparable, we expressed α-Gal-A activity as a percentage of the lower limit of the laboratory’s normal range (Table 1). Protein changes were checked with MutationTaster software (http://www.mutationtaster.org/cgi-bin/MutationTaster/MutationTaster69.cgi). Human Genome Variation Society cDNA and protein mutation descriptions were followed.20 GFR was measured by the plasma disappearance of iohexol or estimated using serum creatinine values and the CKD Epidemiology Collaboration equation for ages ≥1821 or the modified Schwartz equation for ages <18.22 Urine protein/creatinine ratio (UPCR) values were from samples obtained close to the time of the biopsy.
Table 1.
Clinical characteristics of females with Fabry disease.
| # | Age (year) | Protein Change | cDNA Mutation | Mutation Category | α-Gal-A Activity (%LNL) | Plasma Lyso-GL3 (nmol/L) | GFR (ml/min/1.73 m2) | UPER (g/g) | RAAS Blockade | Nonrenal Fabry Features |
|---|---|---|---|---|---|---|---|---|---|---|
| *1 | 4 | p.Tyr216Asp | c.646T>G | missense | NK | NK | 137 | 0.16 | NK | CO |
| *2 | 8 | p.Cys52Ser | c.155G>C | missense | NK | NK | 136 | 0.1 | NK | GI |
| 3 | 9 | p.Trp236Ter | c.707G>A | nonsense | NK | NK | 106 | 0.04 | NK | GI, PN |
| 4 | 11 | p.Met267Arg | c.800T>G | missense | NK | NK | 105 | NK | N | CO, GI, PN, HP |
| *5 | 12 | p.Trp236Ter | c.707G>A | nonsense | NK | NK | NK | NK | NK | NK |
| *6 | 12 | p.Leu19Pro | c.56T>C | missense | NK | NK | NK | NK | NK | NK |
| *7 | 13 | p.Tyr216Asp | c.646T>G | missense | NK | NK | 97 | NK | NK | AR |
| 8 | 27 | p.Leu36Trp | c.107T>G | missense | 61% | 9.65 | 116 | 0.1 | N | CO, GI, PN, HP |
| *9 | 30 | p.Pro259Arg | c.776C>G | missense | 63% | 11.27 | 85 | 0.06 | N | GI, PN |
| *10 | 33 | p.Tyr216Asp | c.646T>G | missense | NK | NK | 87 | 0.08 | NK | CO, GI, PN |
| *11 | 33 | p.Tyr216Cys | c.647A>G | missense | 44% | 16.8 | 114 | 0.2 | N | CO, GI, PN, HP, AK |
| *12 | 36 | p.Asp264Tyr | c.790G>T | missense | 44% | 14.13 | 115 | 0.29 | N | CO, GI, PN, HP |
| 13 | 37 | p.Tyr216Cys | c.647A>G | missense | 62% | 16.8 | 114 | 0.2 | N | CO, PN, HP, AK |
| *14 | 37 | p.Asp322Glu | c.966C>A | missense | 97% | 13.43 | 91 | 0.1 | N | AR, PN, GI |
| 15 | 39 | p.Asp313Tyr+p.Gly271Cys | c.937G>T+c.811G>T** | missense | 33% | 12.57 | 109 | 0.13 | N | PN, GI, HP |
| 16 | 42 | p.Arg112Cys | c.334C>T | missense | NK | NK | 106 | 0.02 | NK | N |
| 17 | 42 | p.Arg227Ter | c.679C>T | nonsense | NK | NK | 118 | 0.09 | N | CO, LVH, PN, GI, HP |
| *18 | 44 | p.Gly325Arg | c.973G>C | missense | 52% | 23.27 | 99 | 0.91 | N | GI |
| *19 | 46 | p.Pro293Thr | c.877C>A | missense | 51% | 16.23 | 88 | 0.06 | N | CO, AK, IH, GI, HP |
| 20 | 46 | p.Asp266Ala | c.[797A>C] | missense | 33% | 10.7 | 82 | 0 | N | AK, PN |
| 21 | 48 | p.Met187Ile | c.561G>A | missense | 74% | 5.65 | 108 | 0.25 | N | AR, PN, GI, HP |
| 22 | 48 | p.Ala156Thr | c.466G>A | missense | 100% | 16.73 | 102 | 0.2 | N | AK, LVH, AR, PN |
| *23 | 49 | p.Gly260Ala | c.779G>C | missense | 18% | 29.93 | 69 | 1.5 | Y | AR, PN, GI |
| *24 | 50 | p.Pro205Thr | c.613C>A | missense | 47% | 8.72 | 83 | 0.52 | Y | AR, PN, GI |
| *25 | 53 | p.Pro293Thr | c.877C>A | missense | 47% | 18.17 | 79 | 0.11 | N | CO, AK, LVH, AR, IH, PN, GI, HP |
| 26 | 53 | p.Phe295Cys | c.884T>G | missense | 28% | NK | 110 | 0.31 | Y | CO, AK, LVH, PN, HP |
| 27 | 55 | NK | c.[1224del66] | deletion | 83% | 7.6 | 55 | 1.1 | Y | LVH, AR |
| *28 | 68 | p.Arg112His | c.335G>A | missense | 73% | 1.19 | 45 | 0.04 | N | PN, HP |
ml/min per 1.73 m2; UPER, urine protein excretion rate, used for both urine protein excretion per day and urine protein creatinine ratio assuming interchangeability of these two values19 and expressed g/g creatinine. LNL, lower laboratory normal limit; RAAS, renin-angiotensin aldosterone system; NK, not known; N, no; Y, yes; CO, corneal opacity; PN, peripheral neuropathy; GI, gastrointestinal; AK, angiokeratoma; AR, arrhythmia; LVH, left ventricular hypertrophy; IH, ischemic heart disease; HP, hearing problems; ST, stroke.
Cases used for age-matched comparisons with males and controls.
While c.811G>T is associated with classic Fabry phenotype, c.937G>T is a polymorphism. Therefore, this patient’s phenotype is compatible with a simple heterozygous, and not a compound heterozygous female.
Renal Biopsy Studies
Methods for renal biopsy tissue fixation, embedding, sectioning, and unbiased electron microscopic imaging and quantitation of several of the structural parameters are detailed elsewhere.14, 16, 17, 23 In brief, biopsies fixed in 2.5% glutaraldehyde were embedded in Poly/Bed®; 1 μm sections were stained with toluidine blue for selection of glomeruli for imaging as described previously.16, 17, 23 Overlapping low magnification digital images of entire glomerular profiles (~8,000 x) were obtained using a JEOL-1010 transmission electron microscope for masked review by two observers (B.N. and M.M.) to select nonsclerosed glomeruli with minimal or no artifacts for stereological studies. Podocyte nuclei were numbered in Adobe Photoshop CS3 and the presence or absence of GL3 inclusions in cytoplasmic profiles was noted.
High magnification images (~30,000 x) were obtained by systematic uniform random sampling for estimation of podocyte GL3 volume fraction (fraction of podocyte cytoplasm occupied by GL3 inclusions) and similarly for glomerular endothelial and mesangial cell parameters.23 Point counting was performed separately for cytoplasm and GL3 inclusions for cellular profiles with and without visible podocyte GL3 inclusions. The fraction of podocytes volume occupied by nuclei and the glomerular volume occupied by podocytes was estimated using point counting. Average volume of podocyte nuclei was estimated by point-sampled intercept method.16, 17 Average foot process width (FPW) was estimated as the reciprocal of podocyte slit pore-length density.23 All measurements were done by masked observers.
Developing an Unbiased Model for Estimation of Volume of GL3 Inclusions in Podocytes Independent of Mosaicism
In contrast to ERT-naïve male Fabry patients where all podocytes are Fabry phenotype (F+) and expected to contain GL3 inclusions, in females the presence of F+ podocytes is heterogeneous due to random X-inactivation, making it impossible to accurately quantify GL3 in F+ podocytes in females using previous methods.14 Since all podocytes are F+ in ERT-naïve males, estimation of the volume fraction of GL3 inclusions can be accurately done by point counting on all podocyte profiles in a glomerular section. In contrast, female patients’ glomeruli contain both F+ and F− (no Fabry phenotype or GL3 inclusions) podocytes (Figure 1A–C).14 Thus, inclusion of all their visible podocyte profiles would lead to underestimation of the GL3 inclusion volume fraction in F+ podocytes, since some podocyte profiles without visible GL3 inclusions may belong to F− podocytes. On the other hand, exclusion of podocyte profiles without visible GL3 inclusions would lead to overestimation of the volume fraction of GL3 inclusions in F+ podocytes, since some podocyte profiles without visible inclusions belong to F+ podocytes. We therefore developed an unbiased approach for GL3 volume fraction and GL3 volume estimation in F+ podocytes independent of mosaicism in females. In brief, the method involves three steps. First, quantification of the proportion of podocyte profile areas which have visible GL3 inclusions and therefore belong to F+ cells. Second, estimation of the proportion of podocyte profile areas without visible GL3 that belong to F+ cells. Third, knowing the latter, correcting for the overestimation error. We hypothesized that the probability of obtaining cell profiles without visible GL3 in F+ cells is inversely related to the volume fraction of GL3 inclusions and can be explained through a mathematical model that works for a wide range of GL3 volume fractions. Such a model could only be developed where all cells are F+ (i.e. males), but will be applicable to both males and females since the quantifications only include podocyte profiles with visible GL3 inclusions. Details are provided in Supplemental Materials.
Figure 1. Podocyte involvement by Fabry phenotype in male and female patients.

(A) A glomerulus from a male patient with Fabry disease. All podocytes contain numerous GL3 inclusions (podocyte nuclei is colored blue). (B) A glomerulus from a female patient with Fabry disease demonstrating mosaicism for Fabry phenotype. Some podocytes contain numerous GL3 inclusions (blue nuclei), while others contain none (red nuclei). (C) Magnified view of the white square in B. As a result of GL3 accumulation, Fabry podocytes (blue nuclei) are remarkably bigger than non-Fabry podocytes (red nuclei). (D) A schematic representation defining the problem dealt with in this work. Random profiles from podocytes of a male Fabry patient are known to belong to a Fabry (F+) cell regardless if GL3 inclusions (dark blue circles) are visible (red arrow) or not (green arrow) on that profile, while in females, a random profile without GL3 inclusions (green arrow) may be from a F+ or F− podocyte. (E) Relationship between GL3 volume fraction in podocytes with visible GL3 inclusions [Vv(Inc/PCVGL3)] and the probability of obtaining random profiles without GL3.
Statistics
Statistica 13.0 (Statsoft, Inc.) software was used for statistical analysis. Microsoft Excel 2010 was used for model fitting (the LINEST function and the least squares method), and k-fold cross-validation. Graphpad Prism 7.0 and Microsoft Excel 2010 generated the graphs. UPCRs were log transformed because of their skewed distribution. Group comparisons were done using t-test or ANOVA, followed by the least squared distance post-hoc analysis. Relationships between variables were evaluated using Pearson correlation. Multiple regression analysis was performed to identify independent predictors when several independent variables correlated with one dependent variable. Piecewise linear regression analysis was used to find the breakpoint of relationship between podocyte number density GL3 volume in F+ podocytes. P≤0.05 was considered statistically significant.
RESULTS
Model development and validation
A detailed version of this section is provided in Supplemental Materials. In brief, to derive a mathematical model explaining the relationship between the probability of encountering profiles without visible GL3 in F+ podocytes and the proportion of profile areas with visible GL3 inclusions occupied by GL3, we studied 91 glomeruli from 40 ERT-naïve male patients, age 36 [4–60] (median [range]) years (clinical characteristics in Suppl. Table S1). Montages of complete glomerular profiles were prepared at ~8,000 X magnification. Several models, including linear, exponential, logarithmic, 2nd, 3rd, and 4th degree polynomial were generated (Suppl. Table S2).
The best fit model, the 4th degree polynomial, (R2=0.94), was chosen (Figure 1E), although the difference between this model and the 2nd and 3rd degree polynomial and logarithmic models was trivial. Two independent methods of validation were applied. First, the model was examined using the k-fold cross-validation method with k=10. The average error was 0.0028 with a root mean square deviation (RMSD) of 0.046 as a measure of model accuracy. This confirmed that the model was sufficiently accurate with low variance. Second, an independent validation was performed by correlating volume fraction of GL3 inclusions observed in the same biopsies based on measurements done on all podocyte profiles, given that they are all F+ in males and the values predicted by our model with measurements limited to podocyte profiles with visible GL3. There was a remarkably strong relationship between predicted and observed values in the great majority of biopsies with most points falling on or very close to the line of identity, confirming the absence of bias and the minimal error in the model. Four data points were somewhat further distanced from the line of identity (Suppl. Figure S2). Images from those biopsies revealed mechanical artifacts with breakage of Bowman’s capsule and presence of floating tubular epithelial cells in the Bowman’s space. Thus, the model was not applied to glomeruli affected by significant artifacts.
Podocyte GL3 accumulation progressively increases with age and is associated with podocyte loss in females with Fabry disease
The model was applied to biopsies from 28 females with Fabry disease with classical mutations age 38 [4–68] years. Their clinical characteristics are in Table 1. GFR was 98±22 [45–137] ml/min/1.73 m2. There was an inverse relationship between GFR and age (r=−0.66; p=0.0003). UPCR was 0.27±0.38 [0–1.50 g/g]. There was a direct trend of association between UPCR and plasma lyso-GL3 (r=0.45; p=0.08; n=16).
The relationships between age, podocyte GL3 accumulation and podocyte number density were similar that reported in males.24 Thus, age correlated directly with average F+ podocyte GL3 volume (r=0.54; p=0.006) and podocyte volume (r=0.48; p=0.018), but not with volume fraction of inclusions in F+ podocyte (Figure 2A–C). F+ podocyte GL3 volume and average F+ podocyte volume correlated tightly (r=0.98; p<10−5), suggesting that podocyte enlargement in F+ podocytes in females was almost exclusively due to GL3 accumulation. Age was inversely related to podocyte number density, suggesting podocyte loss with increasing age (r=−0.56; p=0.006; Figure 2D). By linear regression analysis, podocyte number density was inversely related to average F+ podocyte GL3 volume (r=−0.79; p=0.00001) and cell volume (r=−0.79; p=0.00001) suggesting that podocyte survival was negatively impacted by GL3 inclusion accumulation. However, similar to our previous studies in males,24 the relationship between podocyte number density and F+ podocyte GL3 volume was more consistent with a two-phase exponential decay function (Figure 3A). Thus, F+ podocyte GL3 volume in females explained ~75% of podocyte number density variability through piecewise linear regression analysis (vs. 62% for linear regression) with a breakpoint of 2,205 μm3 for F+ podocyte GL3 volume. Podocyte number density was inversely related to the systolic blood pressure (r=−0.45; p=0.032). However, by multiple regression analysis, among F+ podocyte GL3 volume, age and systolic blood pressure, F+ podocyte GL3 volume was the only independent predictor of podocyte number density (adjusted r2=0.59; p=0.0005). There was no relationship between %F+ podocytes and age. Volume fraction of GL3 inclusions in mesangial cells correlated directly with age (r=0.40; p=0.042; Figure 2E); while there was no relationship between age and endothelial cell GL3 volume fraction (Figure 2F).
Figure 2. Relationships between age and glomerular structural parameters.

(A) Age was directly related to F+ podocyte GL3 volume [V(Inc/PCF+); (B) Age was directly related to F+ podocyte volume [VPCF+]; (C) There was no statistically significant relationship between age and F+ podocyte GL3 volume fraction [Vv(Inc/PCF+)]; (D) Age was inversely related to podocyte number density [Nv(PC/glom)]; (E) Age was directly related to mesangial cell GL3 volume fraction [Vv(Inc/Mes)]; (F) There was no statistically significant relationship between age and glomerular endothelial cell GL3 volume fraction [Vv(Inc/Endo)].
Figure 3. Relationships between F+ podocyte GL3 volume and number density and between proteinuria and glomerular structural parameters in female patients with Fabry disease.
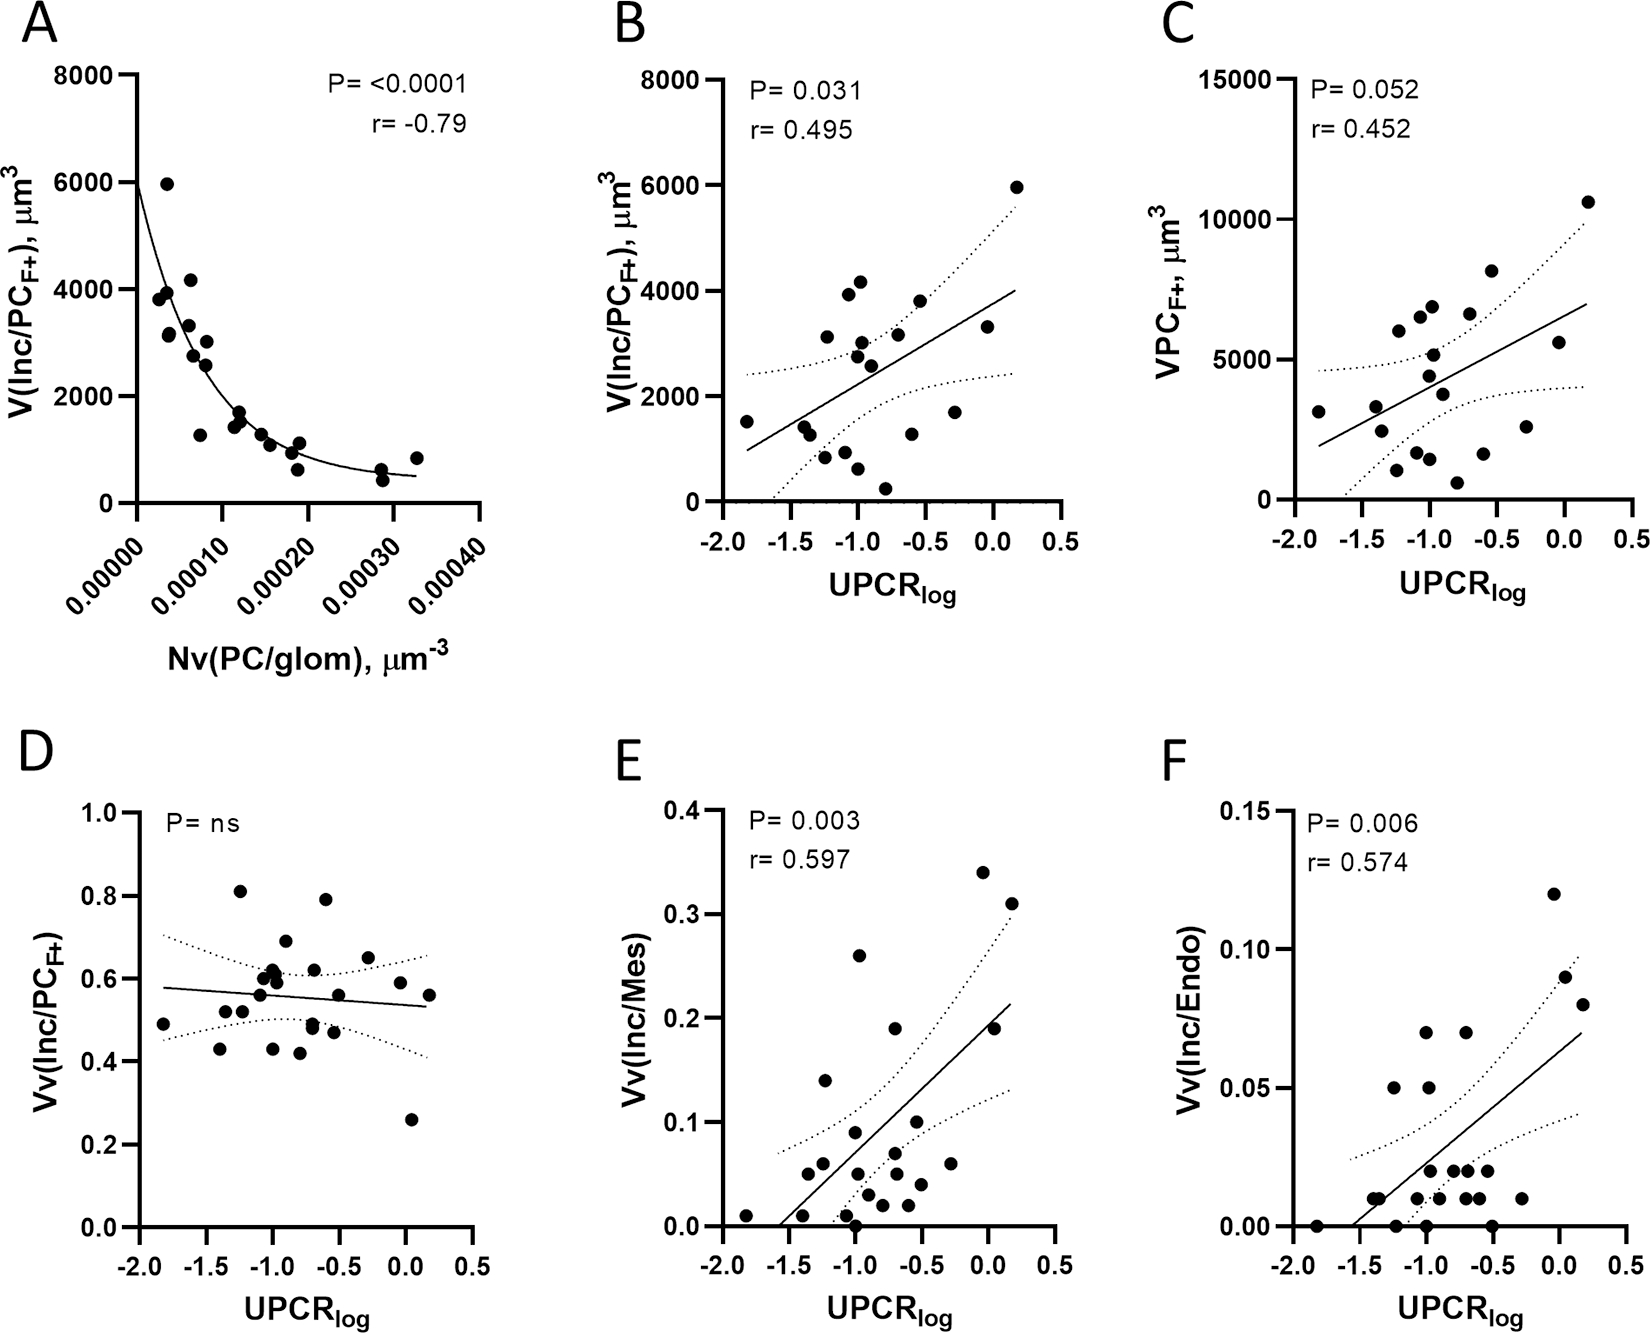
(A) Inverse relationship between F+ podocyte GL3 volume and number density best explained through a two-phase exponential decay model. (B) Direct relationship between urine protein excretion and F+ podocyte GL3 volume. (C) Direct relationship between urine protein excretion and F+ podocyte volume. (D) There was no relationship between urine protein excretion and F+ podocyte GL3 volume fraction. (E) Direct relationship between urine protein excretion and mesangial cell GL3 volume fraction. (F) Direct relationship between urine protein excretion and endothelial cell GL3 volume fraction. Abbreviations: V(Inc/PCF+) = F+ podocyte GL3 volume; Nv(PC/glom) = podocyte number density; UPERlog = urine protein excretion rate on logarithmic scale; VPCF+ = F+ podocyte volume; Vv(Inc/PCF+) = F+ podocyte GL3 volume fraction; Vv(Inc/Mes) = mesangial cell GL3 volume fraction; Vv(Inc/Endo) = endothelial cell GL3 volume fraction.
UPCR in females correlated directly related with F+ podocyte GL3 volume (r=0.50; p=0.031), average F+ podocyte volume (r=0.45; p=0.05), volume fractions of GL3 inclusions in mesangial cells (r=0.60; p=0.003) and endothelial cells (r=0.57; p=0.006) (Figure 3A–D).
Plasma lyso-GL3 which was available in 17 female patients correlated directly with F+ podocyte volume (r=0.75; p=0.002) and GL3 volume (r=0.77; p=0.001) and volume fraction of inclusions in mesangial cells (r=0.72; p=0.002) but not endothelial cells (Figure 4A–D).
Figure 4. Relationships between plasma globotriaosylsphingosine and glomerular structural parameters.

(A-C) Direct relationships between plasma globotriaosylsphingosine concentration and (A) F+ podocyte volume, (B) F+ podocyte GL3 volume, and (C) mesangial cell GL3 volume fraction. (D) There was no relationship between endothelial cell GL3 volume fraction and plasma globotriaosylsphingosine. Abbreviations: Lyso-GL3 = globotriaosylsphingosine; VPCF+ = F+ podocyte volume; V(Inc/PCF+) = F+ podocyte GL3 volume; Vv(Inc/PCF+) = F+ podocyte GL3 volume fraction; Vv(Inc/Mes) = mesangial cell GL3 volume fraction; Vv(Inc/Endo) = endothelial cell GL3 volume fraction.
Comparison of Fabry podocytes in age-matched male and female patients and controls
Sixteen age-matched male (denoted by asterisks in Supplement Table S1) and female (denoted by asterisks in Table 1) pairs with Fabry disease and classic GLA mutations were compared for multiple variables. Eleven biopsies from living kidney donors with similar ages (37 ± 19 [7–63] years) were studied for podocyte structural parameters.
Among the Fabry disease patients, α-Gal-A activity was greater in females (p=0.000001). Neither GFR nor UPCR differed between the sexes. While volume fraction of GL3 inclusions in endothelial cells was less in females (p=0.000002; Figure 5A), none of the measures related to GL3 accumulation in F+ podocytes, including volume fraction of GL3 inclusions, volume of GL3 inclusions, and average podocyte volume were statistically different from males (Figures 5B–D). On the other hand, average F+ podocyte volume in male and female Fabry patients was more than 2 fold greater than in controls (Figure 5D). FPW was ~1.5 fold greater in male (605 ± 95 nm) than female patients (394 ± 233 nm) (p=0.002; Figure 5E), indicative of more severe podocyte injury in males. FPW in controls (408 ± 131 nm) was less than in male (p=0.007), but not different from female Fabry patients. Compared with the controls (0.000236 ± 0.000214), podocyte number density was reduced in male patients (0.000112 ± 0.000066) (p=0.02) and showed a trend towards reduction in female patients (0.000133 ± 0.000103) (p=0.057); however, podocyte number density was not different between the Fabry sexes (Figure 5F). Average F+ podocyte volume was directly (r=0.70, p=0.003; and r=0.51, p=0.043) and podocyte number density was inversely (r=−0.71, p=0.002; and r=−0.67, p=0.007) related with age in both male and female Fabry patients, respectively. These relationships were not present in control subjects.
Figure 5. Comparison of podocyte structural parameters in age-matched male and female patients with Fabry disease and living kidney donors (normal control subjects).

(A) Endothelial cell GL3 volume fraction was significantly greater in male patients (0.10 ± 0.03; mean ± SD) than in females (0.03 ± 0.03); (B) F+ podocyte GL3 volume fraction was not different between male (0.54 ± 0.10) and female (0.53 ± 0.11) patients; (C) F+ podocyte GL3 volume was not different between male (2302 ± 2149) and female (2147 ± 1672) patients; (D) F+ podocyte volume was not different between male (4390 ± 3533) and female (3989 ± 3032) patients. However, F+ podocyte volume in male Fabry patients was greater than in controls (1782 ± 1625) and in female patients showed a trend of increase compared with controls. (E) Foot process width was greater in male Fabry patients (605 ± 95 nm) compared with female patients (394 ± 233 nm) or normal controls (408 ± 131 nm). (F) Podocyte number density was lesser in male Fabry patients (0.000112 ± 0.000066) and showed a trend of reduction in female patients (0.000133 ± 0.000103) compared with normal controls (0.000236 ± 0.000214). The thick dashed lines in the violin plots show the median values and the fine dotted lines above and below the median represent the quartiles. Abbreviations: Vv(Inc/Endo) = endothelial cell GL3 volume fraction; Vv(Inc/PCF+) = F+ podocyte GL3 volume fraction; V(Inc/PCF+) = F+ podocyte GL3 volume; VPCF+ = F+ podocyte volume; FPW = foot process width; Nv(PC/glom) = podocyte number density; F = female; M = male; C = control. Scatterplot markers: circle = female; square = male; black = Fabry; white = control.
DISCUSSION
Despite presence of residual plasma α-Gal-A activity in most females with Fabry disease, according to the Fabry Registry, 20% of females over 40 years of age suffer from stage 3–5 chronic kidney disease (CKD), suggesting that this residual plasma enzyme activity is not sufficient to eliminate CKD progression 4. We developed and validated a novel method for measuring mean GL3 inclusion volume in podocytes independent of mosaicism in females with Fabry disease and classic mutations. We found that GL3 accumulation and injury in Fabry podocytes in females progresses with age. Importantly, GL3 accumulation in F+ podocytes in females was similar to that in males, confirming previous observations using less accurate methodology 14 and consistent with the absence of significant podocyte cross-correction or effectiveness of residual circulating enzyme.
Using qualitative assessments, Gubler et al. first reported25 and Valbuena et al 26 confirmed variable podocyte GL3 accumulation in a few females with Fabry disease. Similarly, we previously reported a clear distinction between Fabry and non-Fabry phenotype podocytes, consistent with these cells carrying a mutant or wild-type GLA.14 We also reported that this distinction was not easily made in other renal cells in female patients either because of less distinct cell borders or because podocytes, being long lived27 likely retain GL3 inclusions for years while other cell types with more rapid turnover may lose GL3 inclusions in the mitotic process. Importantly, we previously documented that a greater % of Fabry phenotype podocytes in females was associated with greater podocyte foot process width (FPW), i.e., greater podocyte injury, and that these increases in FPW extended to glomerular basement membrane areas covered by non-Fabry podocytes.14 This is consistent with experimental studies in mice chimeric for an immunotoxin receptor on podocytes where foot process widening on immunotoxin administration extended to podocytes without this receptor.12 We also reported, in 12 female patients, that the percent of non-Fabry phenotype podocytes increased with increasing age, and interpreted this as consistent with diminished viability of the F+ vs. the F− phenotype podocytes.14 However, the present study with 28 patients, including 4 of the original cohort, could not confirm this observation. This discrepancy may in part be related to the heterogeneity of mosaicism among females. In addition, since podocyte number density was strongly inversely related to the volume of inclusions per podocyte with no significant change in the ratio of F+ vs. the F− phenotype podocytes this suggests that F− podocytes were also being lost. An analogous observation has been made in females with Fabry disease where enlargement of F− cardiomyocytes correlated with cardiomyopathy severity.28 If correct, this concept could help to explain why, despite a large complement of F− cells and significant residual circulating α-Gal-A levels, females are susceptible to life threatening Fabry complications.
Given the generally slower development of renal disease in Fabry females, 4 the progressive loss of podocytes with aging leading to glomerular scarring13 is also of concern. The current study showed that male Fabry patients had ~53% and females had ~44% lower podocyte number densities than age-matched controls, suggesting that females risk losing critical numbers of podocytes from both Fabry disease and aging, potentially leading to glomerulosclerosis and a vicious cycle of further podocyte stress and further glomerulosclerosis.12, 13, 27 This could explain the continued progression to renal events in females with Fabry disease in their later decades of life.4 Importantly, similar to our report in males24 F+ podocyte GL3 volume was the only independent predictor of podocyte number density and explained ~60% of the variability in this parameter in females, signifying the key role of podocyte GL3 accumulation Fabry nephropathy pathophysiology. Also similar to males, the relationship between F+ podocyte GL3 volume and number density was best explained through two phases,24 where beyond a breakpoint (2009 μm3 in males24 and 2205 μm3 in females for F+ podocyte GL3 volume and ~0.00012 μm−3 for number density) the slope of this relationship becomes much steeper. These observations in males24 and females suggests a threshold for podocyte number density below with nephron cannot survive and, keeping the F+ podocyte GL3 volume below a certain threshold may keep the glomerulus away from that critical point. The present study extended our initial observations in females in other important ways. Firstly, we documented the bias induced by the increased likelihood of falsely labelling an F+ as an F− podocytes based on lower GL3 volume fractions and developed a correction for this bias. We also extended our initial studies to measuring F+ podocyte volume, allowing estimation of GL3 volume per podocyte. In fact, this parameter was much more closely related to age, podocyte number density and mean FPW than F+ podocyte GL3 volume fraction.
The data in the present study are consistent with the concept that cross-correction is minimal or does not occur between F− and F+ podocytes in female heterozygotes. Studies of cultured fibroblasts suggest that very limited amounts of GLA are released from F− fibroblasts for correction of co-cultured F+ fibroblasts.29 Moreover, the released GLA was the mature 46 kDa rather than the mannose 6-phosphorylated 52 kDa form which is more readily taken up by cells with mannose 6-phosphorylated receptors.29 If the fibroblast culture results relate to in vivo circumstances, this would also help explain why the higher plasma levels of α-Gal-A in females vs. males are not helpful to the Fabry phenotype podocytes. Additionally, some and perhaps most of the secreted α-Gal-A from the normal podocytes in females probably enters the urinary space, becoming unavailable to the mutant cells.
Given the possibility that podocyte GL3 volume fraction may not accurately reflect early treatment effects in podocytes 16 17 and given the low amounts or absence of GL3 inclusions in glomerular endothelial and mesangial cells in females, this study provides a meaningful renal biopsy endpoint for clinical trials in females with Fabry disease. Our study clearly documents that podocyte GL3 volume correlates with decreased podocyte number density and increased proteinuria, and that this parameter can be measured in an unbiased manner independent from mosaicism, thereby allowing for clinical trial designs incorporating this important structural parameter as an indicator of treatment efficacy.
The current study has some limitations. There were only 3 females with Fabry disease under age 10 years, so the data cannot be considered robust in this younger age group. The methods utilized in these studies, albeit necessary for obtaining the important observations made here, are time consuming and require considerable technical expertise which may limit the performance of these techniques to research studies and clinical trials. Thus, they are unlikely to be routinely available unless they become amenable to machine learning algorithms. The residual plasma α-Gal-A activity in our female cohort suggests that a bias might have been involved in selecting females with lower enzyme activity than usual; however, such a bias would not have any impact on study method or outcome.
Supplementary Material
1. Supplemental Methods S1: Developing an Unbiased Model for Estimation of Volume of GL3 Inclusions in Podocytes Independent of Mosaicism (detailed version)
2. Supplemental Results S1: Model development and validation (detailed version)
3. Supplemental material references
4. Supplemental Table S1. Clinical characteristics of male patients whose kidney biopsies were used for model development.
5. Supplemental Table S2. Models of relationships between the probability of obtaining random profiles without GL3 inclusions from an F+ podocyte shown as “y” and podocyte GL3 volume fraction estimated based on profiles with visible GL3 [Vv(Inc/PCVGL3)], shown as “x”.
6. Supplemental Figure S1. Comparison of podocyte nuclear volume in F+ and F− podocytes in 10 biopsies from females with Fabry disease using paired t-test.
7. Supplemental Figure S2. Scatterplot of observed vs. predicted values of podocyte GL3 volume fraction [Vv(Inc/PC)] (using the 4th degree polynomial model) in the biopsies from male patients with Fabry disease.
ACKNOWLEDGEMENTS
We would like to thank Ms. Frida Maiers, Zour Yang, Karen Zaruba, and Ann Palmer for electron microscopy studies and Ms. Cathy Bagne for research coordination. This work was supported by an investigator-initiated grant (BN) from Amicus Therapeutics and a grant (MM and BN) from the National Institutes of Health Lysosomal Disease Network [(U54NS065768), a part of the NCATS Rare Diseases Clinical Research Network (RDCRN). RDCRN is an initiative of the Office of Rare Diseases Research (ORDR), NCATS, funded through a collaboration between NCATS and the National Institute of Neurological Disorders and Stroke (NINDS), and the National Institute of Diabetes and Digestive and Kidney Diseases.
DISCLOSURE STATEMENT
BN is a recipient of investigator-initiated grants from Amicus Therapeutics and Sanofi Genzyme; has research contracts with Avrobio, Sanofi Genzyme, Freeline, and 4DMT; and is a consultant to Amicus Therapeutics, Freeline Therapeutics, Sanofi Genzyme, Sangamo, Avrobio, and 4DMT; and has received honoraria for speaking at non-promotional educational meetings sponsored by Amicus Therapeutics and Sanofi. CT is consultant for Sanofi Genzyme, Amicus, Chiesi, Freeline Therapeutics and Avrobio, participates as investigator in clinical Fabry studies initiated from Sanofi Genzyme, Protalix, Idorsia and Freeline Therapeutics and has received speakers honoraria from Sanofi Genzyme, Amicus, Takeda and Chiesi. All honoraria received goes to Haukeland University Hospital. ES received speaker’s fees from Amicus, Sanofi Genzyme and Takeda. MH received speaker-related fees from Protalix and Chiesi. BO and IG have no relevant financial disclosure. AS has no relevant financial disclosure. MM: Recipient of investigator-initiated research grants from Sanofi/Genzyme and Amicus.* Research kidney biopsy lab studies for Sanofi/Genzyme, Freeline, and Amicus. Consultant to Genzyme, Amicus, Freeline Therapeutics, Avrobio and Sangamo for clinical trial design in Fabry disease.* Speaker at Sanofi/Genzyme and Amicus non-promotional educational meetings. *These interests have been reviewed and managed by the University of Minnesota in according to its conflict of interest policies. AS, AS, BO, and GI have no relevant financial disclosure.
Footnotes
Publisher's Disclaimer: This is a PDF file of an unedited manuscript that has been accepted for publication. As a service to our customers we are providing this early version of the manuscript. The manuscript will undergo copyediting, typesetting, and review of the resulting proof before it is published in its final form. Please note that during the production process errors may be discovered which could affect the content, and all legal disclaimers that apply to the journal pertain.
REFERENCES
- 1.Zarate YA, Hopkin RJ. Fabry’s disease. Lancet 2008; 372: 1427–1435. [DOI] [PubMed] [Google Scholar]
- 2.MacDermot KD, Holmes A, Miners AH. Anderson-Fabry disease: clinical manifestations and impact of disease in a cohort of 60 obligate carrier females. J Med Genet 2001; 38: 769–775. [DOI] [PMC free article] [PubMed] [Google Scholar]
- 3.Maier EM, Osterrieder S, Whybra C, et al. Disease manifestations and X inactivation in heterozygous females with Fabry disease. Acta Paediatr Suppl 2006; 95: 30–38. [DOI] [PubMed] [Google Scholar]
- 4.Wilcox WR, Oliveira JP, Hopkin RJ, et al. Females with Fabry disease frequently have major organ involvement: lessons from the Fabry Registry. Mol Genet Metab 2008; 93: 112–128. [DOI] [PubMed] [Google Scholar]
- 5.Gibas AL, Klatt R, Johnson J, et al. Disease rarity, carrier status, and gender: a triple disadvantage for women with Fabry disease. J Genet Couns 2008; 17: 528–537. [DOI] [PubMed] [Google Scholar]
- 6.Wang RY, Lelis A, Mirocha J, et al. Heterozygous Fabry women are not just carriers, but have a significant burden of disease and impaired quality of life. Genet Med 2007; 9: 34–45. [DOI] [PubMed] [Google Scholar]
- 7.Mehta A, Ricci R, Widmer U, et al. Fabry disease defined: baseline clinical manifestations of 366 patients in the Fabry Outcome Survey. Eur J Clin Invest 2004; 34: 236–242. [DOI] [PubMed] [Google Scholar]
- 8.Reiser J, Sever S. Podocyte biology and pathogenesis of kidney disease. Annu Rev Med 2013; 64: 357–366. [DOI] [PMC free article] [PubMed] [Google Scholar]
- 9.Kriz W, LeHir M. Pathways to nephron loss starting from glomerular diseases-insights from animal models. Kidney Int 2005; 67: 404–419. [DOI] [PubMed] [Google Scholar]
- 10.Germain DP, Waldek S, Banikazemi M, et al. Sustained, long-term renal stabilization after 54 months of agalsidase beta therapy in patients with Fabry disease. J Am Soc Nephrol 2007; 18: 1547–1557. [DOI] [PubMed] [Google Scholar]
- 11.Thurberg BL, Rennke H, Colvin RB, et al. Globotriaosylceramide accumulation in the Fabry kidney is cleared from multiple cell types after enzyme replacement therapy. Kidney Int 2002; 62: 1933–1946. [DOI] [PubMed] [Google Scholar]
- 12.Matsusaka T, Sandgren E, Shintani A, et al. Podocyte injury damages other podocytes. J Am Soc Nephrol 2011; 22: 1275–1285. [DOI] [PMC free article] [PubMed] [Google Scholar]
- 13.Hodgin JB, Bitzer M, Wickman L, et al. Glomerular Aging and Focal Global Glomerulosclerosis: A Podometric Perspective. J Am Soc Nephrol 2015; 26: 3162–3178. [DOI] [PMC free article] [PubMed] [Google Scholar]
- 14.Mauer M, Glynn E, Svarstad E, et al. Mosaicism of podocyte involvement is related to podocyte injury in females with Fabry disease. PLoS One 2014; 9: e112188. [DOI] [PMC free article] [PubMed] [Google Scholar]
- 15.Kriz W, Shirato I, Nagata M, et al. The podocyte’s response to stress: the enigma of foot process effacement. Am J Physiol Renal Physiol 2013; 304: F333–347. [DOI] [PubMed] [Google Scholar]
- 16.Mauer M, Sokolovskiy A, Barth JA, et al. Reduction of podocyte globotriaosylceramide content in adult male patients with Fabry disease with amenable GLA mutations following 6 months of migalastat treatment. J Med Genet 2017; 54: 781–786. [DOI] [PMC free article] [PubMed] [Google Scholar]
- 17.Najafian B, Tondel C, Svarstad E, et al. One Year of Enzyme Replacement Therapy Reduces Globotriaosylceramide Inclusions in Podocytes in Male Adult Patients with Fabry Disease. PLoS One 2016; 11: e0152812. [DOI] [PMC free article] [PubMed] [Google Scholar]
- 18.Spence MW, Goldbloom AL, Burgess JK, et al. Heterozygote detection in angiokeratoma corporis diffusum (Anderson-Fabry disease). Studies on plasma, leucocytes, and hair follicles. J Med Genet 1977; 14: 91–99. [DOI] [PMC free article] [PubMed] [Google Scholar]
- 19.Gaspari F, Perico N, Remuzzi G. Timed urine collections are not needed to measure urine protein excretion in clinical practice. Am J Kidney Dis. 20016; 47: 1–7. [DOI] [PubMed] [Google Scholar]
- 20.den Dunnen JT, Dalgleish R, Maglott DR, et al. HGVS Recommendations for the Description of Sequence Variants: 2016 Update. Hum Mutat 2016; 37: 564–569. [DOI] [PubMed] [Google Scholar]
- 21.Levey AS, Inker LA, Coresh J. GFR estimation: from physiology to public health. Am J Kidney Dis 2014; 63: 820–834. [DOI] [PMC free article] [PubMed] [Google Scholar]
- 22.Schwartz GJ, Munoz A, Schneider MF, et al. New equations to estimate GFR in children with CKD. J Am Soc Nephrol 2009; 20: 629–637. [DOI] [PMC free article] [PubMed] [Google Scholar]
- 23.Najafian B, Svarstad E, Bostad L, et al. Progressive podocyte injury and globotriaosylceramide (GL-3) accumulation in young patients with Fabry disease. Kidney Int 2011; 79: 663–670. [DOI] [PMC free article] [PubMed] [Google Scholar]
- 24.Najafian B, Tondel C, Svarstad E, et al. Accumulation of Globotriaosylceramide in Podocytes in Fabry Nephropathy Is Associated with Progressive Podocyte Loss. J Am Soc Nephrol 2020; 31: 865–875. [DOI] [PMC free article] [PubMed] [Google Scholar]
- 25.Gubler MC, Lenoir G, Grunfeld JP, et al. Early renal changes in hemizygous and heterozygous patients with Fabry’s disease. Kidney Int 1978; 13: 223–235. [DOI] [PubMed] [Google Scholar]
- 26.Valbuena C, Carvalho E, Bustorff M, et al. Kidney biopsy findings in heterozygous Fabry disease females with early nephropathy. Virchows Arch 2008; 453: 329–338. [DOI] [PubMed] [Google Scholar]
- 27.Wolf G, Chen S, Ziyadeh FN. From the periphery of the glomerular capillary wall toward the center of disease: podocyte injury comes of age in diabetic nephropathy. Diabetes 2005; 54: 1626–1634. [DOI] [PubMed] [Google Scholar]
- 28.Chimenti C, Verardo R, Frustaci A. Hypertrophy of unaffected cardiomyocytes correlates with severity of cardiomyopathy in female patients with Fabry disease. Orphanet J Rare Dis 2021; 16: 169. [DOI] [PMC free article] [PubMed] [Google Scholar]
- 29.Fuller M, Mellett N, Hein LK, et al. Absence of alpha-galactosidase cross-correction in Fabry heterozygote cultured skin fibroblasts. Mol Genet Metab 2015; 114: 268–273. [DOI] [PubMed] [Google Scholar]
Associated Data
This section collects any data citations, data availability statements, or supplementary materials included in this article.
Supplementary Materials
1. Supplemental Methods S1: Developing an Unbiased Model for Estimation of Volume of GL3 Inclusions in Podocytes Independent of Mosaicism (detailed version)
2. Supplemental Results S1: Model development and validation (detailed version)
3. Supplemental material references
4. Supplemental Table S1. Clinical characteristics of male patients whose kidney biopsies were used for model development.
5. Supplemental Table S2. Models of relationships between the probability of obtaining random profiles without GL3 inclusions from an F+ podocyte shown as “y” and podocyte GL3 volume fraction estimated based on profiles with visible GL3 [Vv(Inc/PCVGL3)], shown as “x”.
6. Supplemental Figure S1. Comparison of podocyte nuclear volume in F+ and F− podocytes in 10 biopsies from females with Fabry disease using paired t-test.
7. Supplemental Figure S2. Scatterplot of observed vs. predicted values of podocyte GL3 volume fraction [Vv(Inc/PC)] (using the 4th degree polynomial model) in the biopsies from male patients with Fabry disease.