

Abstract
Arginine–serine (RS) domain(s) in splicing factors are critical for protein–protein interaction in pre‐mRNA splicing. Phosphorylation of RS domain is important for splicing control and nucleocytoplasmic transport in the cell. RNA‐binding motif 20 (RBM20) is a splicing factor primarily expressed in the heart. A previous study using phospho‐antibody against RS domain showed that RS domain can be phosphorylated. However, its actual phosphorylation sites and function have not been characterized. Using middle‐down mass spectrometry, we identified 16 phosphorylation sites, two of which (S638 and S640 in rats, or S637 and S639 in mice) were located in the RSRSP stretch in the RS domain. Mutations on S638 and S640 regulated splicing, promoted nucleocytoplasmic transport and protein‐RNA condensates. Phosphomimetic mutations on S638 and S640 indicated that phosphorylation was not the major cause for RBM20 nucleocytoplasmic transport and condensation in vitro. We generated a S637A knock‐in (KI) mouse model (Rbm20S637A) and observed the reduced RBM20 phosphorylation. The KI mice exhibited aberrant gene splicing, protein condensates, and a dilated cardiomyopathy (DCM)‐like phenotype. Transcriptomic profiling demonstrated that KI mice had altered expression and splicing of genes involving cardiac dysfunction, protein localization, and condensation. Our in vitro data showed that phosphorylation was not a direct cause for nucleocytoplasmic transport and protein condensation. Subsequently, the in vivo results reveal that RBM20 mutations led to cardiac pathogenesis. However, the role of phosphorylation in vivo needs further investigation.
Keywords: cardiomyopathy, phosphorylation, pre‐mRNA splicing, protein condensates, protein trafficking, RNA‐binding motif 20 (RBM20)
Abbreviations
- A
alanine
- A3SS
alternative 3′ splice site
- A5SS
alternative 5′ splice site
- AW
anterior wall
- BNP
natriuretic peptides
- Camk2d
calcium/calmodulin‐dependent protein kinase type II d
- CID
collision‐induced dissociation
- D
Aspartic acid
- DCM
dilated cardiomyopathy
- Ddx6
DEAD‐box helicase 6
- DEGs
differentially expressed genes
- DMEM
Dulbecco's modified eagle's medium
- DSGs
differentially spliced genes
- ECD
electron capture dissociation
- EF
ejection fraction
- FA
formic acid
- FBS
fetal bovine serum
- FDR
false discovery rate
- FTICR
Fourier transform ion cyclotron resonance
- G
glycine
- GO
gene ontology
- gRNAs
guide RNAs
- H&E
hematoxylin and eosin
- Het
heterozygous
- Hom
homozygous
- HPO
human phenotype ontology
- KEGG
Kyoto Encyclopedia of Genes and Genomes
- KI
knock‐in
- KO
knockout
- L
leucine
- LC
liquid chromatography
- LV
left ventricle
- MS
mass spectrometry
- MS/MS
tandem MS
- MWCO
molecular weight cutoff
- MXE
mutually exclusive exons
- Myh6
myosin heavy chain 6
- N2BA‐G
giant N2BA
- nano‐ESI
nano‐electrospray ionization
- NC
negative control
- Nppb
natriuretic peptide precursor b
- P
proline
- PA
pulmonary artery
- PSI
percent spliced‐in
- PTMs
post‐translational modifications
- PW
posterior wall
- qPCR
quantitative PCR
- q‐TOF
quadrupole‐time‐of‐flight
- RBM20
RNA‐binding motif 20
- RI
retained intron
- rMATS
multivariate analysis of transcript splicing
- RNA‐seq
RNA‐sequencing
- RNP
ribonucleoprotein
- RRM
RNA recognition motif
- RS domain
arginine–serine‐rich domain
- RT
room temperature
- RV
right ventricle
- Ryr2
ryanodine receptor 2
- SE
skipped exon
- SG
stress granules
- SR proteins
serine‐ and arginine‐rich proteins
- TAPSE
tricuspid annular plane systolic excursion
- TDP‐43
TAR DNA‐binding protein 43
- TMM
trimmed mean of M‐values
- VAGE system
vertical sodium dodecyl sulfate −1% agarose gel electrophoresis system
- VTI
velocity time integral
- Wt
wild type
1. INTRODUCTION
RNA‐binding motif 20 (RBM20) is a muscle‐specific splicing factor identified in a spontaneous mutant rat model. 1 , 2 , 3 In this rat model, 13 of 14 RBM20 exons (exons 2–14) were deleted, and the absence of RBM20 led to the largest isoform of protein titin resulting from alternative splicing. 1 , 2 , 3 , 4 , 5 The role of RBM20 as a primary regulator of Ttn pre‐mRNA splicing was also verified through a gene‐edited mouse model. 6 In this mouse model, the RNA recognition motif (RRM) in RBM20 was deleted, resulting in the expression of the largest titin isoform in the heart of these mice. 4 In addition to Ttn pre‐mRNA splicing, at least 30 other genes such as myosin heavy chain 6 (Myh6), ryanodine receptor 2 (Ryr2), and calcium/calmodulin‐dependent protein kinase type II d (Camk2d) have also been found to be regulated by RBM20. 3 , 5 , 6 , 7 , 8 Aberrant splicing through RBM20 depletion in animal models and Rbm20 mutations in human patients and animal models was also associated with dilated cardiomyopathy (DCM) and subsequent heart failure development. 7 , 8 , 9 , 10 , 11 , 12 , 13 Uncovering the splicing mechanism regulated by RBM20 is important to develop new treatments for cardiac dysfunction.
RBM20 protein contains the RRM domain located close to the N‐terminus and the arginine–serine‐rich (RS) domain close to the C‐terminus, both of which are commonly found in other conventional splicing factors. 14 , 15 , 16 Both RRM and RS domains play an essential role in defining the splicing sites and the selection of exon/intron boundaries. 13 , 15 Phosphorylation of the RS domain impacts localization and activity of splicing factors. 15 , 16 , 17 Both hyper‐ and hypo‐phosphorylation of splicing factors can suppress splicing reactions 18 and translocation between the nucleus and the cytoplasm. 17 , 19 Although serine‐ and arginine‐rich (SR) proteins dephosphorylation is essential for the maturation of splicing catalysis and the spliceosome, 20 dephosphorylation has also been found important for export of splicing factors and processed mRNA to the cytoplasm for protein translation. 21 Hence, RS domain phosphorylation and dephosphorylation are thought to be critical for numerous steps in splicing factor subcellular localization and splicing control. Previous studies reported that RS domain was critical for RBM20 nuclear retention and the phosphorylation of RS domain may play a role in the nuclear retention. 22 However, both studies did not characterize the actual phosphorylation sites and the role of phosphorylation in nuclear retention. In the present study, we determined the post‐translational modifications (PTMs) of RBM20 by middle‐down mass spectrometry (MS). We also investigated the influence of RBM20 PTMs on splicing control and protein trafficking. Particularly, we studied how mutations of the phosphorylation sites in the RS domain affect cardiac function by using a gene‐edited Rbm20S637A mutation knock‐in (KI) mouse model.
2. METHODS AND MATERIALS
2.1. Experimental animals and sample preparation
The Rbm20S637A mouse was generated via CRISP/Cas9 system at the Genetically Engineered Mouse Models Core Facility of the University of Arizona. The CRISPR guide RNAs (gRNAs), used for mouse Rbm20S637A knock‐in, were designed using the CRISPOR web tool (http://crispor.tefor.net/). The gRNAs, CTCATTGGACTTCGAGAACGTGG (gRNA1) and CTTCGAGAACGTGGCCGCTCTGG (gRNA2) (PAM sequence underlined), were designed for the CRISPR knock‐in experiments. Oligos with 30–50 bp homology to sequences on each side of each gRNA‐mediated double‐stranded break were designed. The genetically edited C57BL/6J mice were identified by PCR genotyping (Table S1), as well as Sanger sequencing.
Animals were maintained on standard rodent chow. Hearts were removed immediately after euthanasia and the left ventricle (LV), right ventricle (RV), and atria were separated. Samples were collected from 8‐week‐old mice. Tissues were separated for paraffin‐embedding and snap‐frozen in liquid nitrogen and stored in a −80°C freezer until use. All animal experiments were in accordance with the guidelines of the Care and Use of Laboratory Animals of the National Institutes of Health. The protocol was approved by the Institutional Animal Care and Use Committee of the University of Wisconsin‐Madison (#A006262).
2.2. Middle‐down mass spectrometry
RBM20 was constructed and expressed with BaculoDirect™ Baculovirus Expression System following manufacture's instruction (Invitrogen, Carlsbad, CA, Cat#12562‐054). The RBM20 concentration was determined by Bradford protein assay prior to enzymatic digestion. For each enzymatic digestion, approximately 50 μg of purified RBM20 was reduced in 6 mM DTT solution at 37°C for 3 h and then alkylated in 5 mM iodoacetic acid at 37°C for 30 min. The reduced and alkylated RBM20 was then digested with an enzyme to protein ratio of either 1:100 (for Lys‐C, Glu‐C, and Asp‐N) or 1:200 (for trypsin) to produce large peptides with mass range of 3–20 kDa. The reactions were incubated in 25 mM ammonium bicarbonate buffer at pH 8 for 30 min at 37°C and then quenched by acidifying the solution with 2 μl 98% formic acid (FA). 10 kDa molecular weight cutoff (MWCO) filters and 0.1% FA in water were used to remove salt and small peptides from proteolytic products. The desalted large peptide mixture was separated by a home‐packed PLRP column (PLRP‐S, 200 mm length × 500 μm i.d., 10 μm particle size, 1,000 Å pore size, Agilent) in a 63‐min gradient from 10% to 90% mobile phase B (mobile phase A: 0.1% FA in water; mobile phase B: 0.1% FA in 1:1 acetonitrile:ethanol) in a nanoACQUITY liquid chromatography (LC) system (Waters, Milford, MA, USA). The nanoACQUITY LC system was coupled with an impact II quadrupole‐time‐of‐flight (q‐TOF) mass spectrometer (Bruker, Bremen, Germany) for online mass spectrometry (MS) and tandem MS (MS/MS) analysis. 23 , 24 Mass spectra were collected at 1 Hz over the range of 200–3000 m/z. The isolation window for online MS/MS of auto collision‐induced dissociation (CID) was set to 4 m/z. The collision DC bias was set from 18 to 50 V for CID with nitrogen as collision gas.
For offline high‐resolution MS/MS analysis of phosphorylated peptides, the eluates from LC separation were collected every 1 min from retention time of 15–45 min. Then, the peptide fractions were analyzed by a 12‐T SolariX Fourier transform ion cyclotron resonance (FTICR) mass spectrometer (Bruker, Bremen, Germany) equipped with electron capture dissociation (ECD). 25 The samples were introduced into the mass spectrometer using an automated chip‐based nano‐electrospray ionization (nano‐ESI) source (Triversa NanoMate, Advion Bioscience, Ithaca, NY, USA). The mass spectra were collected over the range of 200–3000 m/z with 2 M transient size (1.153 s) and 28%–30% excitation power. The isolation window for ECD fragmentation was set to 2–3 m/z and the ECD bias was from 0.8 to 1.0 V. The MS/MS spectra were the sum of 200–500 transients.
The online LC‐MS and MS/MS data were processed and analyzed by Data Analysis software from Bruker Daltonics. Mass spectra of peptide profiling were deconvoluted using the Maximum Entropy algorithm in the DataAnalysis software. For online MS/MS data, the msalign file of each MS/MS spectrum was output from the DataAnalysis software for identification and characterization of RBM20 peptides using MS‐Align+. 26 The cutoff of E‐value and p‐value was set to E‐10 for the confident identification of peptides. For offline MS/MS data, the mass and charge list of fragmentation ions were output from DataAnalysis software for peptide sequence identification using MS‐Align+. In‐house developed MASH Suite Pro 27 , 28 was used for the manual validation of fragment ions and localization of phosphorylation sites. A minimum fit of 60% and S/N threshold of 3 were set for peak picking. Fragment ions including c, c‐1, z ●, and z ● +1 ions were validated within 10 ppm mass error. The reported masses for the RBM20 peptides and the corresponding fragment ions are all monoisotopic masses.
2.3. Cell cultures, plasmids construction, and transfection
H9c2 rat cardiomyocytes (ATCC, Cat#CRL‐1446), HeLa human cervical cancer cells (ATCC, Cat#CCL‐2), and Human embryonic kidney (HEK293) cells (Life Technologies GmbH, Darmstadt, Germany) were cultured in Dulbecco's Modified Eagle's Medium (DMEM; HyClone, Cytiva, Marlborough, MA, USA; Cat#SH3002201) plus 10% fetal bovine serum (FBS; Sigma‐Aldrich, Merck Kgaa, Darmstadt, Germany; Cat#F2442) with 1% penicillin/streptomycin 10 000 U/ml (Gibco by Life Technologies GmbH, Darmstadt, Germany). Plasmids of pEGFP‐C1‐8*his‐RBM20 wild type (Wt) or mutations were constructed by General Biosystems, Inc. (Durham, NC, USA). Plasmid's transfection was performed by FuGENE® HD Transfection Reagent (Promega, Madison, WI, USA; Cat#E2311) following the manufacturer instructions. Forty‐eight hours after transfection, cells were fixed on coverslips for immunostaining.
2.4. Immunocytochemistry (ICC) and cell imaging
H9c2 or HeLa cells were grown on coverslips. Cells were fixed with methanol for 15 min on ice and blocking/permeabilized with 5% goat serum (Sigma‐Aldrich; Cat#G6767), 0.2% Triton‐X100 (Sigma‐Aldrich; Cat#X100) in PBS for 1 h at room temperature (RT) after 48‐h transfection. Then, cells were incubated with primary antibody anti‐RBM20 (rabbit, 1:400) in blocking buffer for 1 h at RT or overnight at 4°C. After washing, cells were incubated with Alexa flour‐conjugated secondary antibody (1:1500; anti‐rabbit, fluor 488, Cat#A32731; anti‐rabbit, flour 568, Cat#A11036; Invitrogen) for 1 h at RT, washed with PBST, and mounted in SlowFade™ Gold Antifade Mountant with DAPI (Invitrogen; Cat#S36938). Cells were visualized and captured with a Zeiss LSM‐710 confocal microscope with 405 and 488 nm laser lines, and Keyence BZ‐X800 microscope (Osaka, Japan).
2.5. Titin minigene transfection and RT‐PCR analysis
The plasmid of “pcDNA3.1‐Ex64‐70” expressing titin exons 64–70 was constructed as described previously. 5 Ttn mini gene (Ex 64–70) was co‐transfected with Rbm20 Wt or mutated plasmids in HeLa cells, respectively, using Lipofectamine 2000 (Invitrogen) according to the manufacturer's instructions. Cells were harvested for RNA preparation at 48 h post co‐transfection. RT‐PCR was performed to detect exon inclusion or exclusion of Ttn mini‐gene under each experimental condition using forward primer (5′‐ACCAGCTGTGCACACAAAGA‐3′) and reverse primer (5′‐TCTTCTTTGCCACAGGAACG‐3′). Results were confirmed in three independent experiments, and the PCR products were analyzed on ethidium bromide agarose gels as described previously. 5
2.6. A double reporter splicing assay in mammalian cell system
For double reporter splicing assay, 25 000 HEK293 cells per well were seeded on 96‐well Nunc F96 MicroWell™ plates (Life Technologies GmbH) and transfected with a 200‐ng plasmid DNA, of which 1 ng was splice reporter (PEVK Ex4‐13) 3 plus a corresponding amount of Rbm20 Wt, Rbm20 mutations, or control plasmids (pcDNA3.1) in a 20x molar excess. To deliver plasmid DNA, we used the 40‐kDa linear polyethylenimine (Polysciences Europe GmbH, Hirschberg, Germany) at a 1:3 ratio (DNA: PEI40). Cells transfected were at a confluence of 50%–60%. Compounds were applied 24 h post‐transfection at a final DMSO concentration of 1%. Luciferase activity was measured 60 h post‐transfection using the Dual‐Luciferase® Reporter Assay System (Promega) on an Infinite® M200 Pro (TECAN, Maennedorf, Switzerland) plate reader. Ratios of firefly to renilla luciferase activity were normalized to the control (pcDNA3.1). Cell viability was measured 60 h post‐transfection using a resazurin‐based staining of metabolically active cells (PrestoBlue®, Life Technologies GmbH, Darmstadt, Germany).
2.7. Western blotting
Western blotting analysis was performed as described previously. 29 , 30 Briefly, protein lysed from cells and tissues was separated by SDS‐PAGE gel and transferred onto a PVDF membrane. The membrane was probed with primary antibodies against RBM20 (1:1500, rabbit, homemade 3 ), phosphorylated RBM20 S637 (1:1000, rabbit; Abmart Inc. Shanghai, China), GAPDH (1:1500, rabbit; Cell Signaling Technology, Danvers, Massachusetts, USA; Cat#2118S) served as the protein‐loading control. Then, the membrane was probed with horseradish peroxidase‐coupled secondary antibodies (1:3000, anti‐rabbit; Promega; Cat#W4011) for 1 h. Chemiluminescence images were taken by ChemiDoc system (Bio‐Rad, Hercules, CA).
2.8. Chemical histology assessments
Whole hearts from 8‐week‐old male and female Wt, heterozygous (Het), and homozygous (Hom) Rbm20S637A mice (n = 3 per group) were isolated and fixed in 4% paraformaldehyde, paraffin‐embedded, and cut in 5 µm to glass slides. Heart sections were stained with Hematoxylin and Eosin (H&E) and Masson's trichrome (n = 3), respectively. Stained sections were photographed using the Keyence BZ‐X800 microscope, and the fibrotic area was quantified by using ImageJ software (Fiji). 31 , 32 The proportion of fibrotic area was calculated as a ratio of the fibrotic area to the total cross‐sectional area.
2.9. Echocardiography
For the in vivo cardiac function assessment, transthoracic echocardiography was performed with Wt (seven males, 10 females), Het (six males, seven females), and Hom (eight males, seven females) mice, respectively, at 8 weeks old on a Visual Sonics Vevo 3100 ultrasonograph (Fujifilm, Toronto, ON, Canada) with the MX400 transducer, ~30‐MHz, as detailed previously. 32 To acquire two‐dimensional guided M‐mode images at the tips of papillary muscles and Doppler studies, mice were sedated by facemask administration of 1% isoflurane, removed chest hair, and maintained on a heated platform. Blood velocities across the mitral, aortic, and pulmonary valves were measured using Doppler pulse wave imaging angling the probe to obtain a nearly parallel orientation to the blood flow. End diastolic and systolic LV diameter and anterior and posterior wall (AW and PW, respectively) thickness were measured online from M‐mode images obtained in a parasternal short‐axis view using the leading edge‐to‐leading edge convention. All parameters were measured over at least three consecutive cardiac cycles and averaged. LV fractional shortening was calculated as [(LV diameterdiastole − LV diametersystole)/LV diameterdiastole] × 100; ejection fraction [(7.0/(2.4 + LV diameterdiastole) (LV diameterdiastole)3 − (7.0/(2.4 + LV diametersystole) (LV diametersystole)3/(7.0/(2.4 + LV diameterdiastole) (LV diameterdiastole)3] × 100 and LV mass was calculated by using the formula [1.05 × ((Posterior Walldiastole + Anterior Walldiastole + LV diameterdiastole)3 − (LV diameterdiastole)3)]. RV wall thicknesses were measured as above from M‐mode images obtained in a right parasternal long‐axis window. Pulmonary artery (PA) diameter was measured just distal to the pulmonary valve. Care was taken to measure PA diameter during the widest part of the ejection cycle. The aortic diameter was measured just distal to the aortic valve. Heart rate was determined from at least three consecutive intervals from the pulse wave Doppler tracings of the LV outflow tract. Ejection time was measured from the same outflow track tracings from the onset of flow to the end of flow. Isovolumic relaxation time was measured as the time from the closing of the aortic valve to the opening of the mitral valve from pulse wave Doppler tracings of the LV outflow tract and mitral inflow region. All images and measures were obtained by the same observer.
2.10. Adult mouse intact cardiomyocyte isolation
Cardiomyocytes were isolated as described previously. 33 , 34 Briefly, mice were anesthetized under isoflurane. The heart was removed and cannulated via the aorta with a blunted 21‐gauge needle for antegrade coronary perfusion. The heart was perfused for 10 min with Ringer's buffer ([in mol/L] 2 NaCL, 2.5 KCL, 0.25 HEPES, 0.5 NaH2PO4, 0.12 MgSO4, 0.5 Pyruvate, 1.98 g D‐glucose, pH 7.3; filter by 0.22 μm) plus 1 mM CaCl2 and switch to calcium‐free Ringer's buffer for about 5 min, followed by digestion buffer (calcium‐free Ringer's buffer plus 300 U/ml Collagenase (235 U/mg, Worthington, Lakewood, NJ, USA)) for 10 min, continuing to add CaCl2 solution every 5 min to make the final Ca2+ concentration is 0.5 mM for a total of three times. Then, the heart was placed in a new petri dish filled with 0.5 mM Ca2++ Ringer's buffer. The left ventricle was cut into small pieces and triturated several times with a transfer pipette and then filtered through a 100‐μm nylon mesh filter. The cells were spun at 500× g for 45 s. Then the supernatant was discarded, and the pellet was resuspended in 0.5 mM Ca2+ Ringer Buffer. Sitting for 5 min after the resuspension at RT, the supernatant was carefully removed. This process was repeated twice in 0.75 mM and 1 mM Ca2+ Ringer Buffer, respectively. Finally, the cells were resuspended in 1 mM Ca2+ Ringer Buffer and ready for use.
2.11. Titin gel electrophoresis
Titin isoforms were resolved by a previously published method using a vertical sodium dodecyl sulfate‐1% agarose gel electrophoresis (VAGE) system. 34 The frozen left ventricle samples from 8‐week‐old mice were homogenized in urea–thiourea–SDS–dithiothreitol sample buffer using the Geno/Grinder (SPEX SamplePrep, Metuchen, NJ, USA) at 1500 strokes/min for 1 min, repeat for five to seven cycles, and were heated at 55°C for 10 min. The denatured protein samples were loaded into 1% SDS‐agarose gel, which is run at 30 mA constant current for 3.5 h. The agarose gel was fixed in 50% methanol, 12% glacial acetic acid, and 5% w/v glycerol for 1 h and then dried overnight at 37°C. The dried gel was scanned by the silver staining method.
2.12. RNA preparation and sequencing
For analysis of differential expression and splicing genes, total RNA was extracted from the LV of male mice at 8 weeks old (Wt, Het and Hom, n = 3 per group) using TRIzol Reagent (Life Technologies, Waltham, MA, USA), treated with DNase I (Lucigen, Middleton, WI; Cat#D9905K), and determined by Nanodrop One (Thermo Fisher Scientific, Waltham, MA, USA) and electrophoresis before RNA‐sequencing (RNA‐seq). The RNA‐seq procedure was performed at the Biotechnology Center of University of Wisconsin‐Madison. Quality check of the raw data was performed using FastQC software. 35 Low quality reads and adapter sequences were trimmed using Trimmomatic. 36 Trimmed reads were mapped to the mouse reference genome (Mus musculus GRCm39) using STAR. 37 The full dataset was uploaded to NCBI GEO database (No. GSE180216; https://www.ncbi.nlm.nih.gov/geo/query/acc.cgi?acc=GSE180216).
2.13. Differential expression and splicing gene analyses and gene functional annotation
For gene‐level expression, gene counts were estimated using “‐‐quantMode GeneCounts” option in STAR. 37 The R package edgeR 38 was used to normalize gene counting based on trimmed mean of M‐values (TMM) method. 39 Only expressed genes with at least 15 counts in more than three samples were evaluated, resulting in 14 729 genes for further analysis. Differential expression analysis was carried out for all three pairwise comparisons between Wt and Het, between Wt and Hom, and between Het and Hom based on negative binomial generalized linear model using edgeR package. 38 The statistical tests were corrected for multiple testing and only genes with a false discovery rate (FDR) less than .05 were considered significant. 40 Volcano plots, heat maps, and violin plots were plotted using “ggplot2” package v3.3.4. 41 For alternative splicing analysis for the three pairwise comparisons between Wt and Het, between Wt and Hom, and between Het and Hom, Multivariate Analysis of Transcript Splicing (rMATS) software for replicates was used. 42 Five types of alternative splicing events were analyzed including skipped exon (SE), mutually exclusive exons (MXE), alternative 5′ splice site (A5SS), alternative 3′ splice site (A3SS), and retained intron (RI). The output from rMATS was filtered using FDR ≤ 0.05 and absolute value of ΔPSI (percent spliced‐in) ≥0.1 as the cutoff criterion to identify significant alternative splicing events.
Functional enrichment analysis using differentially expressed and spliced genes was performed using DAVID Functional Annotation Analysis v6.8 43 , 44 and g:Profiler 45 based on Gene Ontology (GO; biological process, molecular function, and cellular component), Kyoto Encyclopedia of Genes and Genomes (KEGG) pathways, and Human Phenotype Ontology (HPO).
2.14. Quantitative PCR (qPCR) and RT‐PCR
The cDNA was synthesized from the same RNA used for RNA‐seq by iScript™ Reverse Transcription Supermix (Bio‐Rad; Cat#1708841) according to the manufacturer's protocol. To determine gene expression, qPCR was performed in a 10‐μl reaction, 384‐well format, and SsoAdvanced™ Universal SYBR® Green Supermix (Bio‐Rad; Cat#1725272) on CFX384™ real‐time system (Bio‐Rad). The reaction program was as follows: 95°C for 2 min, 40 cycles of 95°C for 15 s, and 60°C for 30 s; finally, the melt curve analysis was performed as default. The qPCR primers were listed in Table S2. Except for explanation, three biological samples were measured in each experimental group in duplicate, with a minimum of two independent experiments. The relative amount of target mRNA normalized to Gapdh was calculated according to the 2−∆∆Ct method. 46
For the detection of splicing events, RT‐PCR was performed using EconoTaq PLUS GREEN 2X Master Mixes (Lucigen, Middleton, WI, USA) with 94°C for 2 min, then 35 cycles of 94°C for 15 s, 60°C for 30 s, and 72°C for 30 s. The Splicing RT‐PCR primers were listed in Table S3. PCR products were resolved on agarose gels and imaged by ChemiDoc system (Bio‐Rad).
2.15. Statistical analysis
GraphPad Prism software v9 (San Diego, CA, USA) was used for statistical analysis. Results were expressed as mean ± SEM. Statistical significance between groups was determined using one‐way ANOVA with Tukey's multiple comparisons test. The significance levels were *p ≤ .05, **p ≤ .01, ***p ≤ .001, ****p ≤ .0001.
3. RESULTS
3.1. Characterization of RBM20 phosphorylation with middle‐down MS and evaluation of phosphorylation on titin splicing
RS domains of splicing factors are frequently phosphorylated and phosphorylation plays a key role in pre‐mRNA splicing. Although previous study showed that RBM20 RS domain could be phosphorylated with anti‐phospho‐RBM20 antibody, 47 the actual phosphorylation sites have not been identified yet. To unambiguously identify RBM20 phosphorylation sites, we performed middle‐down MS with the in vitro expressed (sf9 insect cells) and purified rat RBM20. Sixteen phosphorylation sites were identified with two of them (amino acid S638 and S640 in rats) located in the RSRSP stretch of the RS domain and the rest located outside of the RSRSP stretch at S643, S645, S652, S729, S789, S879, S881, S999, S1034, S1046, S1057, S1096, S1190, and S1192 in rats (Figure 1A). A representative MS result was shown in Figure 1B and a summary of sequence coverage of RBM20 (Figure S1) and other MS results were presented in supplementary figures (Figure S2A–J). Among the 16 identified phosphorylation sites, two residues S638 (S635 in human and S637 in mice) and S640 (S637 in human and S639 in mice) were substituted by alanine (A) and glycine (G), respectively, found in human patients with DCM. 7 , 8 , 9 , 10 , 11 , 12 , 13 We expected that substitute of S to A or G might reduce the phosphorylation level in RS domain, and thus interrupt the splicing function of RBM20. We mutated 16 phosphorylation sites to non‐phosphorylatable amino acid A except for S640 that was mutated to G to mimic mutation in human patients with DCM, and constructed the individual mutations into a pEGFP‐C1 vector (Figure 1C). These mutated constructs were co‐transfected into HeLa cells with Ttn mini‐gene plasmid including exons 64–70. Plasmid‐carrying Wt RBM20 was used as a positive control and empty plasmid was used as negative control (NC). RNA was purified from each treatment 48 h after co‐transfection and RT‐PCR was performed to detect the splicing pattern of Ttn mini‐gene. In the absence of RBM20 (NC), a single smaller band was detected; while in the presence of RBM20 (Wt), two additional larger bands were present, which reflects RBM20 as a splicing repressor 5 (Figure 1D). The size and splicing pattern of the three bands were indicated in a schematic diagram (Figure 1D). Fourteen of 16 mutated RBM20 showed the same splicing pattern as Wt RBM20; however, two mutations S638A and S640G showed the same splicing pattern as the NC (Figure 1D). Thus, the in vivo cell splicing assay revealed that mutations on phosphorylation sites in the RSRSP stretch diminished the RBM20 splicing function. To further confirm the observation, a dual luciferase‐splicing reporter assay was performed with individual RBM20 mutations. The reporter construct contained exons 4–13 in titin PEVK region as described previously 3 (Figure 1E). High ratios of firefly to renilla luciferase reflected suppression of splicing. In the absence of RBM20 showed in the schematic diagram in Figure 1E, the two mutations S638A and S640G revealed the same splicing pattern as the NC, supporting the RT‐PCR results. The ratio of other mutations was significantly different from the NC, though they had tendency to the splicing pattern as the NC.
FIGURE 1.
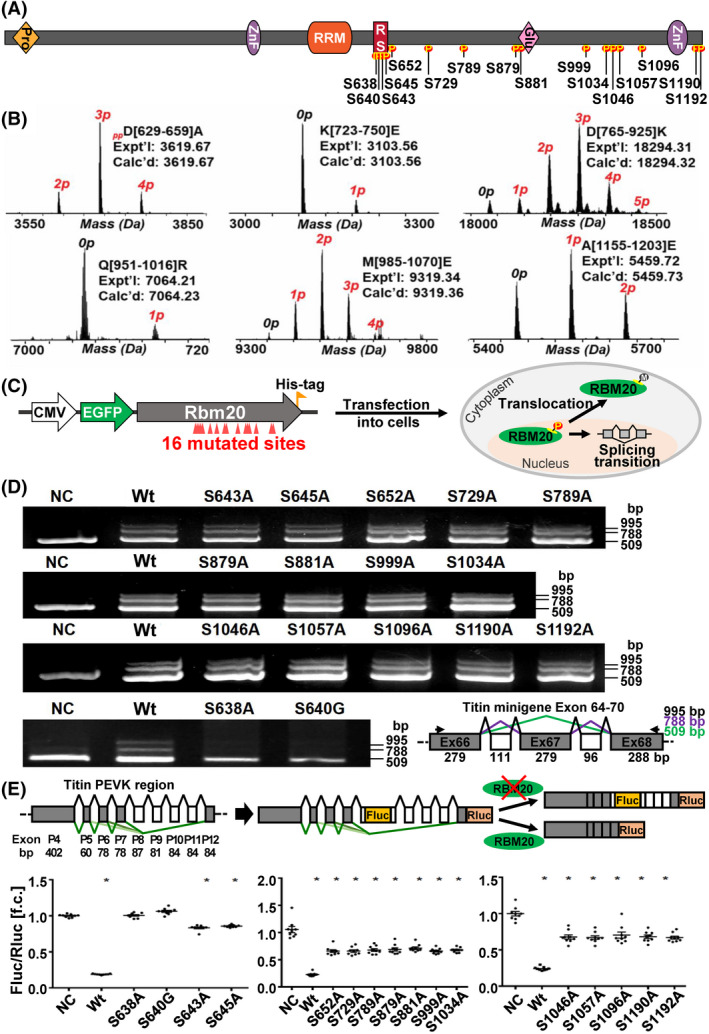
Identification of RBM20 phosphorylation and the role of phosphorylation in Ttn splicing. (A) Schematic diagram of the 16 phosphorylation sites on RBM20 that were found. Glu, glutamic acid; P, phosphorylation; Pro, proline; RRM, RNA recognition motif; RS, arginine/serine; ZnF, Zinc finger domain. (B) Mass spectra of six representative phosphorylated rat RBM20 peptides, D[629–659]A, K[723–750]E, D[765–925]K, Q[951–1016]R, M[985–1070]E, and A[1155–1203]E. Peptide sequences were assigned based on the MS/MS data from either CID or ECD fragmentation. The mass difference between each peak is 79.97 Da, indicating the occurrence of phosphorylation. The number above each peak shows the number of phosphorylation sites. Expt'l is the experimental monoisotopic mass based on data obtained from MS experiments. Calc'd represents the calculated monoisotopic mass based on amino acid sequences; (C) schematic diagram of mutated Rbm20 plasmids constructs and co‐transfection in cells. (D) PCR detection of Ttn mini‐gene splicing pattern after transfecting with different mutated Rbm20 plasmids and schematic diagram of Ttn mini‐gene (Exon 64–70) construct and potential alternative splicing pattern. (E) The schematic diagram of Ttn mini‐gene (PEVK Exon 4–13) splice reporter and dual luciferase splicing assay in HEK293 cells. Fluc, firefly luciferase; NC, negative control with empty plasmid; Rluc, renilla luciferase; Wt, Rbm20 wild type; Mean ± SEM (n = 3); *p < .05
3.2. Phosphomimetic mutations on S638 and S640 did not restore the nuclear localization
To validate whether phosphorylation plays a critical role in the nucleocytoplasmic transport of mutated RBM20, we constructed plasmids with the phosphomimetic mutation from S to D (Aspartic acid) on S638 and/or S640, and transfected the plasmids to H9c2 cells. Our results showed that unphosphorylatable amino acid substitutes S638A and S640G facilitated export of RBM20 to the cytoplasm and assembly of ribonucleoprotein (RNP) granules, and so did the double mutations on S638A/S640G (Figure 2). Unexpectedly, the phosphomimetic mutations S638D and S640D did not restore the nuclear localization (Figure 2), suggesting phosphorylation on S638 and/or S640 was not the major cause for nucleocytoplasmic transport of RBM20 and the assembly of RNP granules. To further confirm this finding, we mutated a non‐phosphorylation site 641 from proline (P) to leucine (L) in the RSRSP stretch and transfected the plasmid to H9c2 cells. We found that P641L mutation also promoted RBM20 relocalization and the assembly of RNP granules (Figure 2). Furthermore, entire RSRSP stretch deletion facilitated the same phenomenon as observed with individual mutations (Figure 2). Quantification for the percent of cells demonstrating nuclear retention and cytoplasmic localization with Wt and various mutant RBM20 was presented in Figure S3A. However, mutations on phosphorylation sites outside of the RSRSP stretch in the RS domain did not facilitate RBM20 trafficking and granules formation in the cytoplasm (Figure S3B). These results imply that phosphorylation in RS domain is not a key determinant for RBM20 trafficking and RNP granules formation.
FIGURE 2.
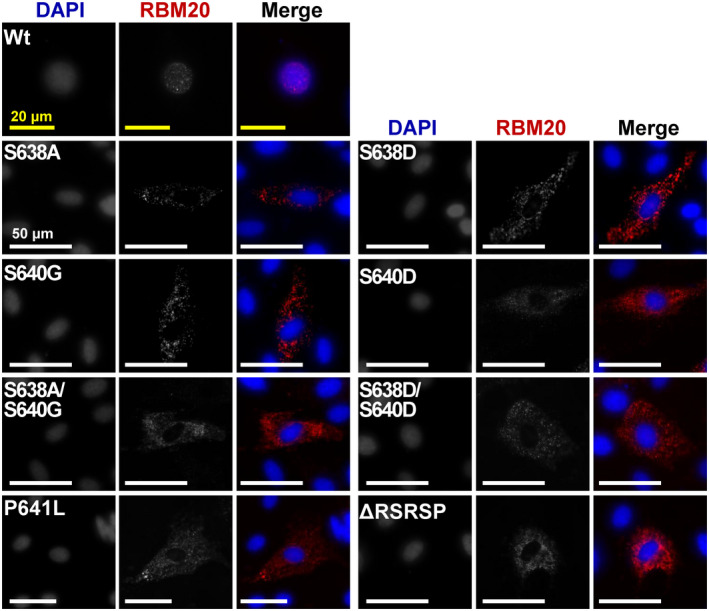
Immunofluorescence staining of Rbm20 mutations in H9c2 cells. Subcellular localization of RBM20 in H9c2 cells via transfection with various Rbm20 mutated plasmids. Single‐channel images are shown in grayscale, and RBM20 and nucleus are shown as red and blue, respectively, in merge images. Yellow bar = 20 µm and white bar = 50 µm
3.3. RBM20 mutation on the phosphorylation site led to reduced phosphorylation, increased RBM20 expression, cytoplasmic localization, and aberrant Ttn splicing in vivo
We next generated a mutation KI mouse model by replacing the phosphorylation site S637 (S638 in rats) in the RSRSP stretch with alanine (Rbm20S637A) through CRSPR/Cas9 gene‐editing technology to evaluate the functional role of Rbm20 mutation in vivo. PCR genotyping and sanger sequencing confirmed the successful mutation at position S637 (Figure 3A). Western blotting using antibody against phospho‐RBM20 on S637 site demonstrated that RBM20 phosphorylation level was dramatically reduced in Het mice and almost undetectable in Hom mice when compared to Wt. Notably, the total RBM20 level was significantly elevated in Het mice and Hom mice, relative to Wt mice (Figure 3B ). We assume that increased RBM20 level could be caused by a feedback mechanism to increase RBM20 transcript level (see detailed discussion below). We then determined the Rbm20 mRNA level using RT‐qPCR and found that the transcription level of Rbm20 significantly increased in Het and Hom heart tissues when compared to Wt (Figure S4A). Since RBM20 is a major splicing regulator of gene Ttn, encoding a giant sarcomeric protein titin that is responsible for ventricular wall stiffness, we performed gel electrophoresis with silver staining to detect titin isoform switching regulated by RBM20. The results revealed that the titin isoform was switched to a giant N2BA (N2BA‐G) isoform in Hom and to an intermediate‐sized N2BA titin in Het heart tissues. Titin isoform switching was consistent with that seen in RBM20 Het and Hom knockout (KO) rats 3 and was also observed in RBM20 targeted mice (Figures 3C and S4B). We then examined the localization of RBM20 in individual cardiomyocytes with immunocytochemical staining against RBM20 antibody. The results clearly indicated that RBM20 was contained only in the nucleus with two speckles in Wt mice (splicing mediated by RBM20 is known to occur in two nuclear speckles 5 ) whereas the Rbm20S637A mutation reduced the nucleus localization and promoted RBM20 granule formation in the cytoplasm (Figure 3D, Videos [Link], [Link], [Link]). Furthermore, the fluorescent intensity of RBM20 in cardiomyocytes was quantified and it significantly increased in Het and Hom cardiomyocytes when compared to Wt (Figure S4C) which is consistent with the protein level detected by western blotting (Figure 3B).
FIGURE 3.
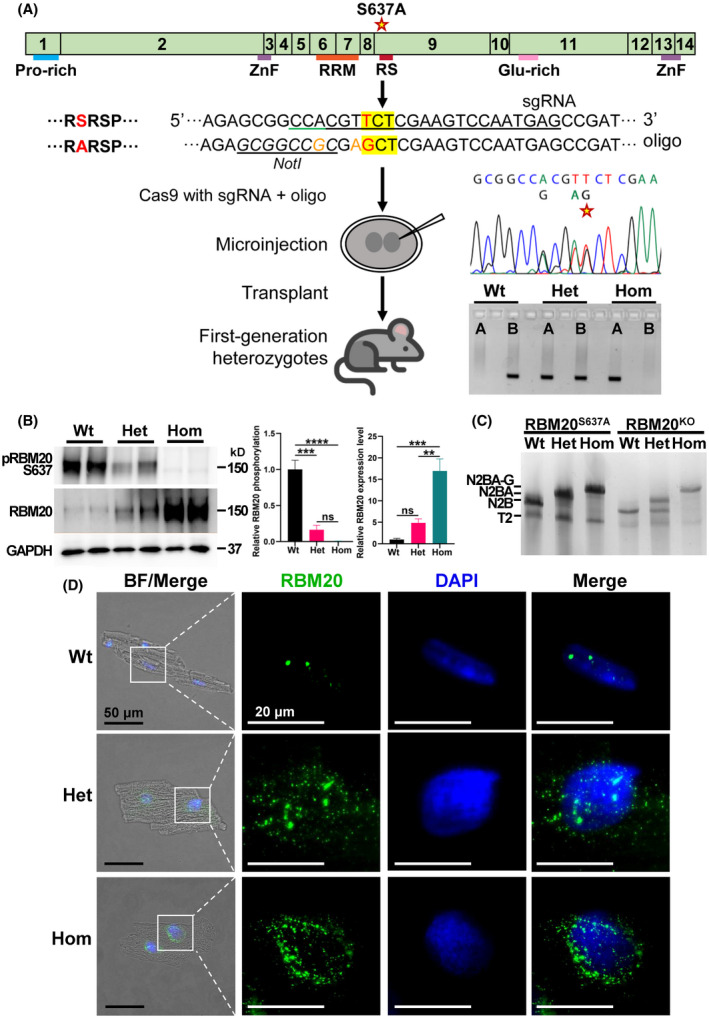
Generation and characterization of Rbm20S637A KI mouse model. (A) Schematic diagram of Rbm20 gene structure and generation of a S637A mutation knock‐in mouse (Rbm20S637A) through CRISPR/Cas9 gene‐editing technology. The schematic structure indicates the mouse Rbm20 gene and coded protein domains. The mutation hot spot in the RS domain was indicated as “RSRSP.” The target amino acid is highlighted in yellow in “RSRSP” stretch, and the point mutation site is in red. The sgRNA is underlined in black and the orange nucleotides were the silent mutation site. The desired switch from TCT (S) to GCT (A) introduced an NotI restriction site and facilitates the genotyping. The edited Rbm20 alleles in mice were confirmed by Sanger sequencing and PCR genotyping. There are two PCR reactions A and B to detect offspring genotyping. For Wt mouse, only “A” reaction is positive; for Het mouse: “A” and “B” are positive; and for Hom mice, only “B” reaction is positive. (B) Phosphorylation of RBM20 S637 site and total RBM20 expressions in Wt, Het, and Hom mice by western blotting with anti‐phosphoRBM20 S637 and anti‐pan RBM20. GAPDH is a loading control. Box plots showing the quantification of phosphoRBM20 S637 to total RBM20, and the relative RBM20 expression level by normalizing to the GAPDH, respectively. Mean ± SEM (n = 4). *p < .05, **p < .001 and ***p < .0001. (C) Titin isoforms were detected in Wt, Het, and Hom heart tissues through vertical 1% SDS‐agarose gel electrophoresis (VAGE) system. N2BA‐G (giant N2BA), N2BA, and N2B represent different sizes of titin isoforms. Titin isoform expression in RBM20 KO rats were used as references. (D) Immunocytochemical staining of isolated Wt, Het, and Hom cardiomyocytes. Black bar = 50 µm and white bar = 20 µm. BF, Bright field; Het, heterozygotes; Hom, homozygotes; Wt, wild type
3.4. Effect of mutating the phosphorylation site on cardiac remodeling and pathogenesis
We then assessed cardiac function in the RBM20S637A KI mice at the age of 8 weeks. Isolated Het and Hom hearts were flabby, flimsy, and flatten under their own weight in both male and female mice (Figure 4A). Gross anatomy and H&E staining revealed that the LV chamber was enlarged and the LV walls were thinner in KI male mice when compared to Wt mice, but not in the female mice (Figure 4A,B,J). Quantitative analysis of trichrome staining reveals no significant changes of fibrosis in KI mice compared to Wt mice at 8 weeks old (Figures 4C and S5A,B). The ratio of heart weight to body weight was not different between KI and Wt mice with an increased tendency in Hom mice (Figures 4D and S5C). This could be related to the enlarged atrium observed in Hom mice (Data not shown). About 34% of Hom KI mice died in the first 100 days with no significant difference between male and female as calculated by Kaplan–Meier analysis (Figure 4E). Echocardiography further revealed that both male and female KI mice had a DCM‐like phenotype with reduced ejection fraction (EF), and an enlarged LV chamber in both diastole and systole (Figure 4F–H, and Table S4). The echocardiographic data showed that aorta ejection time, ventricular wall thickness (Figure 4I), and velocity time integral (VTI) as well as PA ejection time were decreased in male KI mice. The tricuspid annular plane systolic excursion (TAPSE) depth was significantly reduced in both male and female Hom mice compared to control Wt mice (Table S4).
FIGURE 4.
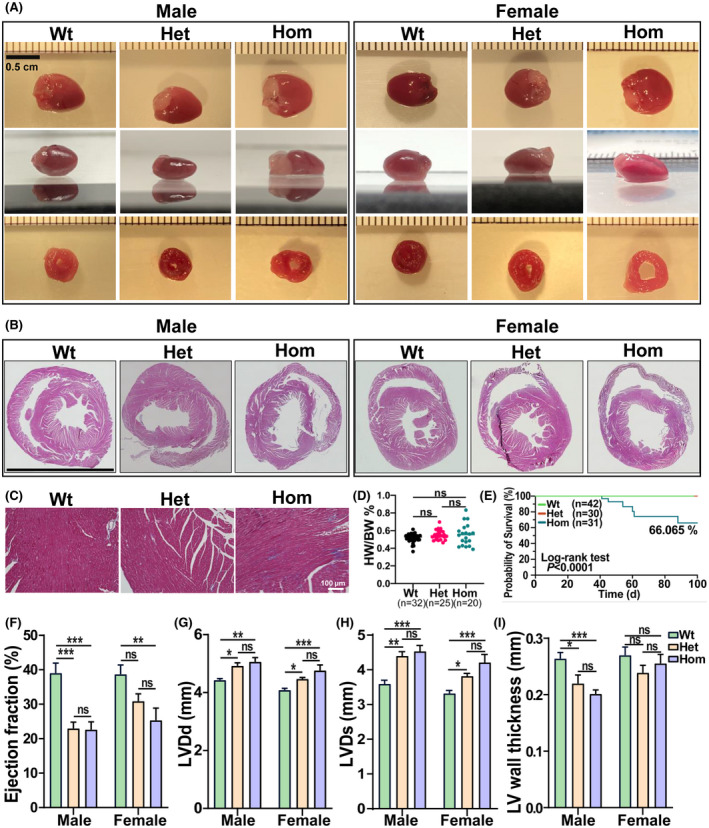
Histology and in vivo cardiac functional assessment of Rbm20S637A KI mice. (A) Gross anatomy of the heart with upper and side views, and slice anatomy at the midventricular level of Wt, Het, and Hom hearts in male and female mice. Bar = 0.5 cm. (B) Representative images of hematoxylin and eosin staining of cross section of mouse hearts at the age of 8 weeks in both male and female mice. Bar = 0.5 cm. (C) Representative images of Masson's trichrome staining in male mice at 8 weeks old. Bar = 100 µm. (D) Heart weight versus body weight at the age of 8 weeks in both male and female mice (n = 32 in Wt, 25 in Het, and 20 in Hom). (E) Kaplan–Meier survival curves of Wt, Het and Hom male and female mice. Statistical significance was determined by log‐rank (Mantel–Cox) test with two degrees of freedom (n = 42 in Wt, 30 in Het, and 31 in Hom). (F) Ejection fraction (EF), (G) left ventricular diastolic diameter (LVDd), (H) left ventricular systolic diameter (LVDs), and (I) left ventricular wall thickness (measured by 2*LVPW(d)/LVDd; mm) from echocardiographic imaging of mice at the age of 2 months (n = 7 males and 10 females in Wt, n = 6 males and 7 females in Het, and n = 8 males and 7 females). Mean ± SEM. Ns, not significance, *p < .05, **p < .001, and ***p < .0001
3.5. RBM20S637A mutation altered gene expression associated with cardiac dysfunction and RNP granule assembly
To determine differentially expressed genes (DEGs) affected by the RBM20S637A mutation, we performed transcriptome profiling with deep RNA‐seq in RBM20S637A KI male mice of 8 weeks old. A total of 1206 genes were differentially expressed in Hom LV compared to Wt LV as indicated in a volcano plot (Figures 5A and S6A; Data S5), but only 278 genes in Het LV compared to Wt LV (Figure S6A,B and Data S6). HPO analysis showed that the top 10 ranked terms were associated with cardiomyopathy and arrhythmia (Figure 5B and Data S7). GO enrichment revealed that the downregulated genes in Hom mice were associated with the regulation of heart contraction, whereas the upregulated genes in Hom mice were mostly related to translational processes and mRNA metabolism (Figure 5C and Data S8). All genes in up‐ and downregulated enrichment were indicated in the heat map (Figure 5C). To identify how many genes in DEGs were involved in assembly of stress granules (SG), we compared the known 611 SG proteins (Data S9) 48 , 49 with DEGs from our RNA‐seq data and found that 54 of 1079 DEGs were associated with SG assembly (Figures 5D and S6C). GO analysis with these 54 genes revealed that they primarily regulate RNA processing, binding, transport, and translation (Figure 5E). For example, Ddx6 (DEAD‐box helicase 6), an upregulated expression gene in KI Hom mice, is a member of DEAD box protein family and essential for assembly processing bodies (P‐bodies). 50 , 51 P‐bodies are one of the cytosolic membraneless ribonucleoprotein granules, involved in translational repression and RNA decay. 51 Recently, Fenix et al (2021) reported that RBM20 R636S mutant co‐localized with DDX6 in the induced pluripotent stem cells‐cardiac myocytes (iPSC‐CMs), indicating Ddx6 is also involved in RNP granule formation driven by RBM20 mutations. RNA‐seq data were validated with selected genes by qPCR and the results were consistent with RNA‐seq data (Figure 5F). Notably, the Natriuretic peptide precursor b (Nppb) encoding natriuretic peptides (BNP), a biomarker for heart failure 52 was significantly upregulated in Hom KI mice (Figure 5F).
FIGURE 5.
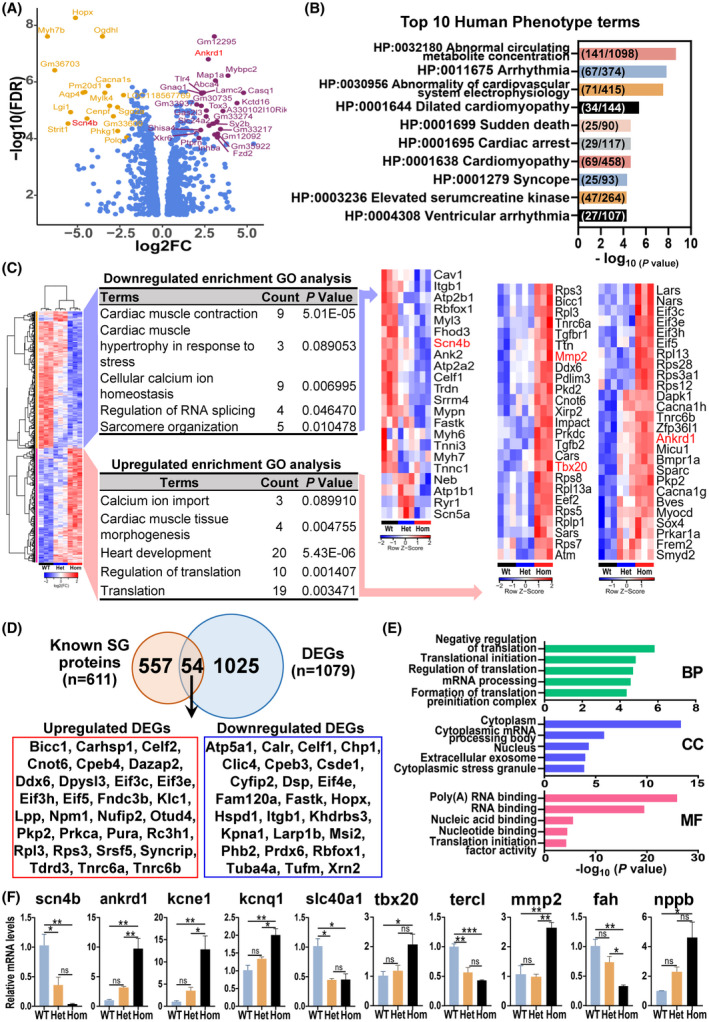
Differentially expressed genes (DEGs) associated with cardiac function, protein localization and stress granules. (A) Volcano plot showing the DEGs between Hom and Wt mice. Log2 fold change (logFC) was plotted against the −log10(FDR) value. Genes with −log10(FDR) > 4 and |log2FC| > 2 were indicated. The genes highlighted in red were validated by quantitative PCR (qPCR). (B) Human phenotype ontology analysis of DEGs in Wt versus Het versus Hom mice, showing the top 10 ranked terms. The numbers inside of each bar represent intersection size versus terms size. (C) Heat maps comparing Wt, Het, and Hom mice. Genes downregulated or upregulated in Hom mice versus Wt and Het were analyzed by DAVID Functional Annotation Analysis. Related GO terms were listed, and the expression of these genes was generated by heat maps, respectively. The genes highlighted in red were validated by qPCR. (D) Venn diagram showing the overlapped genes between known stress granules (SG) genes and DEGs. The overlapping genes were shown as upregulated DEGs in red frame and downregulated DEGs in blue frame in Hom. (E) GO analysis of 54 genes overlapping with known SG genes by DAVID Functional Annotation Analysis. BP, biological process; CC, cellular component; MF, molecular function. (F) Validation of selected genes with qPCR. Mean ± SEM (n = 3). *p < .05, **p < .001, and ***p < .0001
3.6. RBM20S637A mutation led to aberrant splicing of genes associated with muscle contractile function and RNA processing
RBM20 is a muscle‐specific splicing factor that regulates splicing of the Ttn gene and an additional ~30 genes. 3 Splicing mediated by RBM20 occurs in two speckles found in nuclei of cardiomyocytes. 5 RBM20S637A mutation depleted RBM20 in the nucleus and translocated it in the sarcoplasm, suggesting an interrupted splicing process. We then performed splicing analysis using RNA‐seq, revealing that 135 genes underwent aberrant splicing in Hom mice and 144 genes in Het mice, when compared to Wt (Figure S7A). The differentially spliced genes (DSGs) in Hom KI mice were involved in all five splicing events (97 SE (skipping exon), 26 MXE (mutually exclusive exons), 11 A5SS (alternative 5′ splice site), 24 A3SS (alternative 3′ splice site), 14 RI (retained intron)), indicated in violin and volcano plots (Figure 6A,B). Ttn, Camk2d, and Ryr2 were exhibited in the top significantly spliced events (Figure 6B). These genes were also observed in most significantly spliced events in Het KI mice (Figure S7B). GO analysis showed that the DSGs were associated with cardiac muscle hypertrophy and contractile function, RNA processing, translation, and protein localization (Figure 6C). Furthermore, the Venn diagram between the known SG genes and DSGs in Het and Hom KI mice showed that five DSG genes overlapped with the known SG genes (Figure 6D), suggesting that gene splicing regulates assembly of RNP granules caused by RBM20S637A mutation. The Ttn splicing result was consistent with that of our protein analysis (Figure 3C), confirming that the RBM20S637A mutation promoted expression of large titin isoforms. We selected genes associated with calcium handling and SGs and validated the abnormal splicing of these genes with RT‐PCR (Figure 6E). The splicing variants were quantified with Image J (Figure S7C).
FIGURE 6.
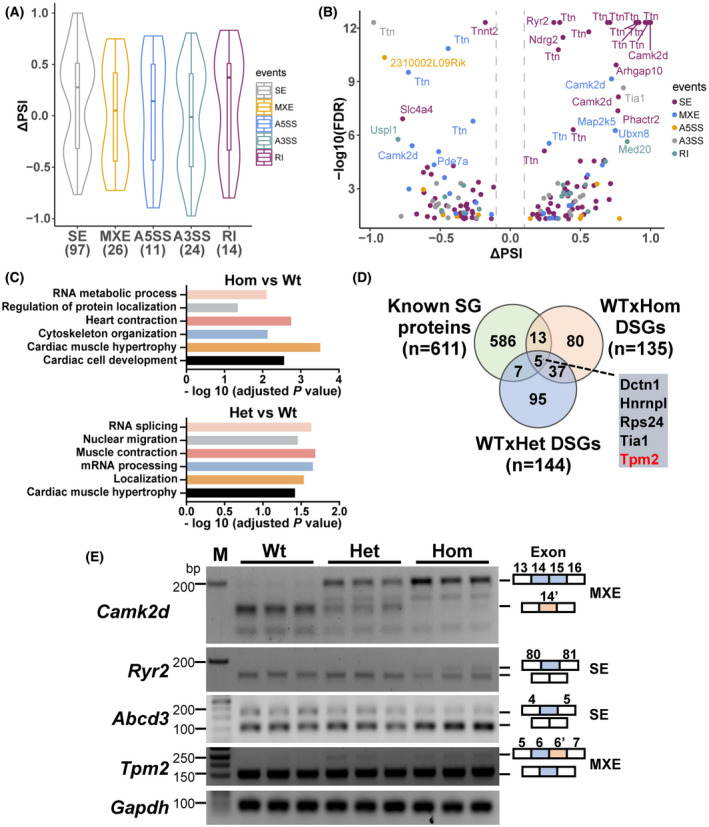
Splicing variant analysis involving cardiac function in Rbm20S637A KI mice. (A) Violin plots representing distributions of statistically significant ΔPSI (percent spliced‐in) values for different classes of AS events between Hom and Wt mice (ΔPSI = PSI(Hom) − PSI(Wt)). The lower and upper bounds of the embedded box represented the 25th and 75th percentile of the distribution, respectively. The horizontal line in the box represented the median. The numbers of events are shown below each plot. SE, skipped exon; MXE, mutually exclusive exons; A5SS, alternative 5′ splice site; A3SS, alternative 3′ splice site; RI, retained intron. (B) Volcano plot showing the differentially splicing genes (DSGs) between Hom and Wt mice. ΔPSI was plotted against the −log10(FDR) value. Genes with −log10(FDR) > 5 and |ΔPSI| > 0.1 were indicated. The genes with different colors represent different splicing events. (C) GO analysis of DSGs between Hom and Wt and between Het and Wt mice, respectively. (D) Venn diagram showing overlapping hits from DSGs with known SG proteins. The Tpm2 gene highlighted in red was validated by RT‐PCR. (E) Validation by RT‐PCR for DSGs in Wt, Het, and Hom mice (n = 3). The splicing patterns of target exon were shown on the right panel. Gapdh, a house keeping gene
4. DISCUSSION
We found that RBM20 protein was phosphorylated on 16 serine amino acid residues, two of which were located in the RSRSP stretch in the RS domain. Individual mutations of 14 serine to the unphosphorylatable alanine neither altered splicing function of RBM20 nor altered the location of RBM20 in the nucleus. However, the S638A (S635 in human and S637 in mice) and S640G (S637 in human and S639 in mice) in the RSRSP stretch altered the splicing pattern of RBM20 substrates such as Ttn. Furthermore, they facilitated RBM20 translocation from the nucleus to the cytoplasm and formation of protein aggregation. Phosphomimetic mutations on these two phosphorylation sites did not restore RBM20 translocation and RNP granule formation. Furthermore, RBM20 S637A mutation KI mice showed that the mutated phosphorylation site S637 led to cardiac remodeling and pathogenesis through depletion of RBM20 in the nucleus, formation of granules in the cytoplasm, and dysregulation of gene expression and splicing.
Pre‐mRNA splicing is a key mechanism for protein diversity as well as gene regulation and involves dynamic interactions of protein–RNA and protein–protein complexes. 53 In this tightly regulated process, SR proteins are a group of RNA‐binding proteins containing enriched dipeptide SR repeats (also known as the RS domain) that play a critical role in modulating the binding and assembly of the spliceosome complex and thereby in determining the splicing site selection. 53 RS domains can mediate protein–protein and protein–RNA interactions during spliceosome assembly. 53 Splicing factors are a subfamily of SR proteins and act as the trans effects in the regulation of pre‐mRNA splicing. Mutations disrupting the pre‐mRNA splicing have been linked to human diseases. 54 A wide range of disorders as well as heart diseases are caused by mutations affecting splice consensus sites (cis effects). 55 However, mutations in trans‐acting factors such as splicing factors have not been broadly studied, particularly not in heart diseases. 56 Studies in human genetics and animal models showed that mutations in the RS domain of RBM20 protein were associated with DCM, with young age at diagnosis, end‐stage heart failure, and high mortality. 7 , 8 , 9 , 10 , 11 , 12 , 13 , 57 , 58 Two of these mutations identified in human patients were S635A (S638A in rats and S637A in mice) and S637G (S640G in rats and S639G in mice) and both of these were identified as phosphorylation residues in this study. Previous studies indicated that phosphorylation and dephosphorylation of RS domain were critical for numerous steps in subcellular localization and splicing control of splicing factors. 17 , 18 , 19 , 20 , 21 , 47 Our data showed that RBM20 mutations from a phosphorylation residue (S) to an unphosphorylatable residue (A or G) in the RS domain disrupted pre‐mRNA splicing in cells and tissues. Using an in vitro cell splicing assay, we showed that dephosphorylation of a splicing factor through mutations in the RS domain interrupted splicing control in a trans effect manner. Cardiac dysfunction caused by mutations in trans‐acting factor RBM20 was associated with aberrant splicing of genes such as Ttn and camk2d, and thus pathophysiological changes.
SR proteins in the spliceosome complex continuously shuttle between the nucleus and the cytoplasm. Localization of these proteins can shift in response to stress signals as well as mutations. 56 , 59 , 60 Changes in distribution of splicing factors in the nucleus and in the cytoplasm can impact splicing as well as gene expression and are associated with a diverse set of diseases. 54 , 60 SR protein trafficking/shuttling has been extensively studied in neurodegenerative diseases. For example, TAR DNA‐binding protein 43 (TDP‐43) is one of the RNA‐binding proteins that regulates splicing of the pre‐mRNA of CFTR (the gene mutated in cystic fibrosis). TDP‐43 is normally located in the nucleus. Mutations in the TDP‐43 gene (TARDBP) facilitate cytoplasmic inclusion. Depletion of TDP‐43 from the nucleus and accumulation in the cytoplasm were associated with both sporadic and familial forms of Alzheimer's disease and amyotrophic lateral sclerosis, demonstrating a role for TDP‐43 mutation in the pathogenesis of neurological diseases. 61 , 62 , 63 , 64 However, the pathogenic mechanisms caused by the mutations are still unclear and might involve loss of splicing factor's nuclear function and/or the toxicity of protein aggregation in the cytoplasm. Earlier work concluded that RBM20‐associated cardiac dysfunction was primarily due to the aberrant Ttn splicing. 3 , 4 , 6 Recent studies suggested that RBM20 shuttling and protein aggregation in the cytoplasm could be a likely major contributor to cardiac dysfunction caused by RBM20 mutations. 57 , 58 , 65 Our current study also revealed that RBM20 mutation in the RS domain caused cardiac dysfunction which confirmed the previous findings in a mouse model with the same mutation site. 56 However, our results indicated that mutation S637A caused pathogenesis and high mortality rate (~34%) at younger age (less than 8 weeks), which is different from the previous study observed pathogenesis and high death rate (~30%) at later age (~9 months). 57
Lastly, we observed that the S637A RBM20 mutation reduced the phosphorylation level of RBM20 in Rbm20S637A mice, but significantly elevated RBM20 expression in protein level. The increased RBM20 expression might be due to a feedback mechanism, for example, translocation of RBM20 to the cytoplasm that depletes RBM20 from the nucleus might trigger increased RBM20 transcription. In addition, due to impairment of RBM20 nucleocytoplasmic transport, the translated RBM20 will accumulate in the cytoplasm. Depletion of RBM20 in the nucleus is likely to signal the transcription machinery to transcribe more RBM20 to meet the need in the nucleus. We did observe the increased mRNA level with RT‐qPCR in the KI mouse heart tissues. RBM20 protein could be protected in the protein aggregation for degradation, leading to accumulation of the protein which could be another possible reason for increased RBM20 protein level. This will certainly be our future direction to investigate the underpinning mechanisms.
Taken together, this study identified the 16 phosphorylation sites on RBM20. We showed that phosphorylation and de‐phosphorylation of the RBM20 RS domain resulted in a titin isoform transition. Mutating phosphorylation sites led to RBM20 shuttling from the nucleus to the cytoplasm and caused protein aggregation in vitro and in vivo. Furthermore, our in vitro study with phospho‐mimetic mutations did not restore translocation of RBM20 and RNP granules formation. Finally, our in vivo study confirmed that the Rbm20S637A mutation resulted in cardiac remodeling and pathogenesis in both male and female mice. How phosphorylation affects RNA splicing, trafficking, and assembly of RNP granules in vivo is an important area for future study.
DISCLOSURES
None.
AUTHOR CONTRIBUTIONS
Wei Guo, Ying Ge, Henk Granzier, Timothy A. Hacker, Michael Gotthardt, Yanghai Zhang, and Chunyan Wang designed the experiments; Yanghai Zhang, Chunyan Wang, Martin Liss, and Mingming Sun performed the experiments; Yutong Jin performed the mass spectrometry experiments; Chunyan Wang and Yanghai Zhang performed the animal study and sample preparation; Camila Urbano Braz and Yanghai Zhang performed RNA‐seq analysis; Yanghai Zhang, Chunyan Wang, Yutong Jin, Timothy A. Hacker, Camila Urbano Braz, Hasan Khatib, Michael Gotthardt, Ying Ge, Wei Guo, and Mingming Sun analyzed and interpreted the data; Yanghai Zhang and Wei Guo wrote the paper; Hasan Khatib, Timothy A. Hacker, Ying Ge, and Henk Granzier revised the paper.
Supporting information
Fig S1‐S7
Table S1‐S4
Video S1
Video S2
Video S3
Data S1
Data S2
Data S3
Data S4
Data S5
ACKNOWLEDGMENTS
We would like to thank Dr. Donald L. Jarvis and Mrs. Melissa Ann Stuart at the University of Wyoming for their assistance in RBM20 expression in Sf2 cells, and to our lab manager Joan Parrish for her assistance for this project and the RNA Sequencing Core Facility at University of Wisconsin‐Madison for helping produce RNA‐seq data. We would like to thank the Gene‐Editing Core Facility for making the knock in mouse model at the University of Arizona. We would also like to thank the histology support from the Dairy Innovation Hub Histology Resource.
Zhang Y, Wang C, Sun M, et al. RBM20 phosphorylation and its role in nucleocytoplasmic transport and cardiac pathogenesis. FASEB J. 2022;36:e22302. doi: 10.1096/fj.202101811RR
Funding information
This work was supported by the NIH NHLBI HL148733, NICHD HD101870, and NIGMS P20GM103432; the American Heart Association Foundation 16BGIA27790136 and 19TPA3480072; the Wisconsin Alumni Research Foundation (AAH4884); and the University of Wisconsin Foundation (AAH5964); YG would like to acknowledge NIH R01 grants, HL109810 and HL096971 and the high‐end instrument grant S10OD018475 and HG would like to acknowledge R35HL144998
DATA AVAILABILITY STATEMENT
The dataset that supports the findings of this study is openly available in the NCBI GEO database at https://www.ncbi.nlm.nih.gov/geo/query/acc.cgi?acc=GSE180216, reference number (No. GSE180216). All other data supporting the findings of this study are included in this article.
REFERENCES
- 1. Greaser ML, Krzesinski PR, Warren CM, Kirkpatrick B, Campbell KS, Moss RL. Developmental changes in rat cardiac titin/connectin: transitions in normal animals and in mutants with a delayed pattern of isoform transition. J Muscle Res Cell Motil. 2005;26(6‐8):325‐332. doi: 10.1007/s10974-005-9039-0 [DOI] [PubMed] [Google Scholar]
- 2. Greaser ML, Warren CM, Esbona K, et al. Mutation that dramatically alters rat titin isoform expression and cardiomyocyte passive tension. J Mol Cell Cardiol. 2008;44(6):983‐991. doi: 10.1016/j.yjmcc.2008.02.272 [DOI] [PMC free article] [PubMed] [Google Scholar]
- 3. Guo W, Schafer S, Greaser ML, et al. RBM20, a gene for hereditary cardiomyopathy, regulates titin splicing. Nat Med. 2012;18(5):766‐773. doi: 10.1038/nm.2693 [DOI] [PMC free article] [PubMed] [Google Scholar]
- 4. Guo W, Pleitner JM, Saupe KW, Greaser ML. Pathophysiological defects and transcriptional profiling in the RBM20‐/‐ rat model. PLoS One. 2013;8(12):e84281. doi: 10.1371/journal.pone.0084281 [DOI] [PMC free article] [PubMed] [Google Scholar]
- 5. Li S, Guo W, Dewey CN, Greaser ML. Rbm20 regulates titin alternative splicing as a splicing repressor. Nucleic Acids Res. 2013;41(4):2659‐2672. doi: 10.1093/nar/gks1362 [DOI] [PMC free article] [PubMed] [Google Scholar]
- 6. Methawasin M, Hutchinson KR, Lee E‐J, et al. Experimentally increasing titin compliance in a novel mouse model attenuates the Frank‐Starling mechanism but has a beneficial effect on diastole. Circulation. 2014;129(19):1924‐1936. doi: 10.1161/CIRCULATIONAHA.113.005610 [DOI] [PMC free article] [PubMed] [Google Scholar]
- 7. Brauch KM, Karst ML, Herron KJ, et al. Mutations in ribonucleic acid binding protein gene cause familial dilated cardiomyopathy. J Am Coll Cardiol. 2009;54(10):930‐941. doi: 10.1016/j.jacc.2009.05.038 [DOI] [PMC free article] [PubMed] [Google Scholar]
- 8. Li D, Morales A, Gonzalez‐Quintana J, et al. Identification of novel mutations in RBM20 in patients with dilated cardiomyopathy. Clin Transl Sci. 2010;3(3):90‐97. doi: 10.1111/j.1752-8062.2010.00198.x [DOI] [PMC free article] [PubMed] [Google Scholar]
- 9. Millat G, Bouvagnet P, Chevalier P, et al. Clinical and mutational spectrum in a cohort of 105 unrelated patients with dilated cardiomyopathy. Eur J Med Genet. 2011;54(6):e570‐e575. doi: 10.1016/j.ejmg.2011.07.005 [DOI] [PubMed] [Google Scholar]
- 10. Monaco I, Santacroce R, Casavecchia G, et al. Double de novo mutations in dilated cardiomyopathy with cardiac arrest. J Electrocardiol. 2019;53:40‐43. doi: 10.1016/j.jelectrocard.2018.12.015 [DOI] [PubMed] [Google Scholar]
- 11. Pantou M, Gourzi P, Gkouziouta A, et al. Phenotypic heterogeneity within members of a family carrying the same RBM20 mutation R634W. Cardiology. 2018;141(3):150‐155. doi: 10.1159/000494453 [DOI] [PubMed] [Google Scholar]
- 12. Rampersaud E, Siegfried JD, Norton N, Li D, Martin E, Hershberger RE. Rare variant mutations identified in pediatric patients with dilated cardiomyopathy. Prog Pediatr Cardiol. 2011;31(1):39‐47. doi: 10.1016/j.ppedcard.2010.11.008 [DOI] [PMC free article] [PubMed] [Google Scholar]
- 13. Refaat MM, Lubitz SA, Makino S, et al. Genetic variation in the alternative splicing regulator RBM20 is associated with dilated cardiomyopathy. Heart Rhythm. 2012;9(3):390‐396. doi: 10.1016/j.hrthm.2011.10.016 [DOI] [PMC free article] [PubMed] [Google Scholar]
- 14. Rexiati M, Sun M, Guo W. Muscle‐specific mis‐splicing and heart disease exemplified by RBM20. Genes. 2018;9(1):18. doi: 10.3390/genes9010018 [DOI] [PMC free article] [PubMed] [Google Scholar]
- 15. Serrano P, Aubol BE, Keshwani MM, et al. Directional phosphorylation and nuclear transport of the splicing factor SRSF1 is regulated by an RNA recognition motif. J Mol Biol. 2016;428(11):2430‐2445. doi: 10.1016/j.jmb.2016.04.009 [DOI] [PMC free article] [PubMed] [Google Scholar]
- 16. Zhu C, Chen Z, Guo W. Pre‐mRNA mis‐splicing of sarcomeric genes in heart failure. Biochim Biophys Acta Mol Basis Dis. 2017;1863(8):2056‐2063. doi: 10.1016/j.bbadis.2016.11.008 [DOI] [PMC free article] [PubMed] [Google Scholar]
- 17. Lai MC, Lin RI, Huang SY, Tsai CW, Tarn WY. A human importin‐beta family protein, transportin‐SR2, interacts with the phosphorylated RS domain of SR proteins. J Biol Chem. 2000;275(11):7950‐7957. doi: 10.1074/jbc.275.11.7950 [DOI] [PubMed] [Google Scholar]
- 18. Prasad J, Colwill K, Pawson T, Manley JL. The protein kinase Clk/Sty directly modulates SR protein activity: both hyper‐ and hypophosphorylation inhibit splicing. Mol Cell Biol. 1999;19(10):6991‐7000. doi: 10.1128/MCB.19.10.6991 [DOI] [PMC free article] [PubMed] [Google Scholar]
- 19. Lai MC, Lin RI, Tarn WY. Transportin‐SR2 mediates nuclear import of phosphorylated SR proteins. Proc Natl Acad Sci U S A. 2001;98(18):10154‐10159. doi: 10.1073/pnas.181354098 [DOI] [PMC free article] [PubMed] [Google Scholar]
- 20. Mermoud JE, Cohen PT, Lamond AI. Regulation of mammalian spliceosome assembly by a protein phosphorylation mechanism. EMBO J. 1994;13(23):5679‐5688. [DOI] [PMC free article] [PubMed] [Google Scholar]
- 21. Lai MC, Tarn WY. Hypophosphorylated ASF/SF2 binds TAP and is present in messenger ribonucleoproteins. J Biol Chem. 2004;279(30):31745‐31749. doi: 10.1074/jbc.C400173200 [DOI] [PubMed] [Google Scholar]
- 22. Filippello A, Lorenzi P, Bergamo E, Romanelli MG. Identification of nuclear retention domains in the RBM20 protein. FEBS Lett. 2013;587(18):2989‐2995. doi: 10.1016/j.febslet.2013.07.018 [DOI] [PubMed] [Google Scholar]
- 23. Cai W, Zhang J, de Lange WJ, et al. An Unbiased Proteomics Method to Assess the Maturation of Human Pluripotent Stem Cell‐Derived Cardiomyocytes. Circ Res. 2019;125(11):936‐953. doi: 10.1161/CIRCRESAHA.119.315305 [DOI] [PMC free article] [PubMed] [Google Scholar]
- 24. Lin Z, Wei L, Cai W, et al. Simultaneous quantification of protein expression and modifications by top‐down targeted proteomics: a case of the sarcomeric subproteome. Mol Cell Proteomics. 2019;18(3):594‐605. doi: 10.1074/mcp.TIR118.001086 [DOI] [PMC free article] [PubMed] [Google Scholar]
- 25. Jin Y, Lin Z, Xu Q, et al. Comprehensive characterization of monoclonal antibody by Fourier transform ion cyclotron resonance mass spectrometry. mAbs. 2019;11(1):106‐115. doi: 10.1080/19420862.2018.1525253 [DOI] [PMC free article] [PubMed] [Google Scholar]
- 26. Liu X, Hengel S, Wu S, Tolić N, Pasa‐Tolić L, Pevzner PA. Identification of ultramodified proteins using top‐down tandem mass spectra. J Proteome Res. 2013;12(12):5830‐5838. doi: 10.1021/pr400849y [DOI] [PMC free article] [PubMed] [Google Scholar]
- 27. Cai W, Guner H, Gregorich ZR, et al. MASH suite pro: a comprehensive software tool for top‐down proteomics. Mol Cell Proteomics MCP. 2016;15(2):703‐714. doi: 10.1074/mcp.O115.054387 [DOI] [PMC free article] [PubMed] [Google Scholar]
- 28. Guner H, Close PL, Cai W, et al. MASH Suite: a user‐friendly and versatile software interface for high‐resolution mass spectrometry data interpretation and visualization. J Am Soc Mass Spectrom. 2014;25(3):464‐470. doi: 10.1007/s13361-013-0789-4 [DOI] [PMC free article] [PubMed] [Google Scholar]
- 29. Zhu C, Yin Z, Ren J, McCormick RJ, Ford SP, Guo W. RBM20 is an essential factor for thyroid hormone‐regulated titin isoform transition. J Mol Cell Biol. 2015;7(1):88‐90. doi: 10.1093/jmcb/mjv002 [DOI] [PMC free article] [PubMed] [Google Scholar]
- 30. Zhu C, Yin Z, Tan B, Guo W. Insulin regulates titin pre‐mRNA splicing through the PI3K‐Akt‐mTOR kinase axis in a RBM20‐dependent manner. Biochim Biophys Acta Mol Basis Dis. 2017;1863(9):2363‐2371. doi: 10.1016/j.bbadis.2017.06.023 [DOI] [PMC free article] [PubMed] [Google Scholar]
- 31. Collins TJ. ImageJ for microscopy. Biotechniques. 2007;43(1 Suppl):25‐30. doi: 10.2144/000112517 [DOI] [PubMed] [Google Scholar]
- 32. Schindelin J, Arganda‐Carreras I, Frise E, et al. Fiji: an open‐source platform for biological‐image analysis. Nat Methods. 2012;9(7):676‐682. doi: 10.1038/nmeth.2019 [DOI] [PMC free article] [PubMed] [Google Scholar]
- 33. Brody MJ, Feng LI, Grimes AC, et al. LRRC10 is required to maintain cardiac function in response to pressure overload. Am J Physiol Heart Circ Physiol. 2016;310(2):H269‐H278. doi: 10.1152/ajpheart.00717.2014 [DOI] [PMC free article] [PubMed] [Google Scholar]
- 34. Zhu C, Guo W. Detection and quantification of the giant protein titin by SDS‐agarose gel electrophoresis. MethodsX. 2017;4:320‐327. doi: 10.1016/j.mex.2017.09.007 [DOI] [PMC free article] [PubMed] [Google Scholar]
- 35. Andrews Simon. FastQC. Published online 2010. Accessed February 16, 2021. http://www.bioinformatics.babraham.ac.uk/projects/fastqc/
- 36. Bolger AM, Lohse M, Usadel B. Trimmomatic: a flexible trimmer for Illumina sequence data. Bioinforma Oxf Engl. 2014;30(15):2114‐2120. doi: 10.1093/bioinformatics/btu170 [DOI] [PMC free article] [PubMed] [Google Scholar]
- 37. Dobin A, Davis CA, Schlesinger F, et al. STAR: ultrafast universal RNA‐seq aligner. Bioinforma Oxf Engl. 2013;29(1):15‐21. doi: 10.1093/bioinformatics/bts635 [DOI] [PMC free article] [PubMed] [Google Scholar]
- 38. Robinson MD, McCarthy DJ, Smyth GK. edgeR: a Bioconductor package for differential expression analysis of digital gene expression data. Bioinforma Oxf Engl. 2010;26(1):139‐140. doi: 10.1093/bioinformatics/btp616 [DOI] [PMC free article] [PubMed] [Google Scholar]
- 39. Robinson MD, Oshlack A. A scaling normalization method for differential expression analysis of RNA‐seq data. Genome Biol. 2010;11(3):R25. doi: 10.1186/gb-2010-11-3-r25 [DOI] [PMC free article] [PubMed] [Google Scholar]
- 40. Benjamini Y, Hochberg Y. Controlling the false discovery rate: a practical and powerful approach to multiple testing. J R Stat Soc Ser B Methodol. 1995;57(1):289‐300. doi: 10.1111/j.2517-6161.1995.tb02031.x [DOI] [Google Scholar]
- 41. Wickham H. Ggplot2. 2nd ed. Springer; 2016. [Google Scholar]
- 42. Shen S, Park JW, Lu Z‐X, et al. rMATS: robust and flexible detection of differential alternative splicing from replicate RNA‐Seq data. Proc Natl Acad Sci U S A. 2014;111(51):E5593‐E5601. doi: 10.1073/pnas.1419161111 [DOI] [PMC free article] [PubMed] [Google Scholar]
- 43. Da Huang W, Sherman BT, Lempicki RA. Bioinformatics enrichment tools: paths toward the comprehensive functional analysis of large gene lists. Nucleic Acids Res. 2009;37(1):1‐13. doi: 10.1093/nar/gkn923 [DOI] [PMC free article] [PubMed] [Google Scholar]
- 44. Da Huang W, Sherman BT, Lempicki RA. Systematic and integrative analysis of large gene lists using DAVID bioinformatics resources. Nat Protoc. 2009;4(1):44‐57. doi: 10.1038/nprot.2008.211 [DOI] [PubMed] [Google Scholar]
- 45. Raudvere U, Kolberg L, Kuzmin I, et al. g:Profiler: a web server for functional enrichment analysis and conversions of gene lists (2019 update). Nucleic Acids Res. 2019;47(W1):W191‐W198. doi: 10.1093/nar/gkz369 [DOI] [PMC free article] [PubMed] [Google Scholar]
- 46. Livak KJ, Schmittgen TD. Analysis of relative gene expression data using real‐time quantitative PCR and the 2(‐Delta Delta C(T)) Method. Methods San Diego Calif. 2001;25(4):402‐408. doi: 10.1006/meth.2001.1262 [DOI] [PubMed] [Google Scholar]
- 47. Murayama R, Kimura‐Asami M, Togo‐Ohno M, et al. Phosphorylation of the RSRSP stretch is critical for splicing regulation by RNA‐Binding Motif Protein 20 (RBM20) through nuclear localization. Sci Rep. 2018;8(1):8970. doi: 10.1038/s41598-018-26624-w [DOI] [PMC free article] [PubMed] [Google Scholar]
- 48. Markmiller S, Soltanieh S, Server KL, et al. Context‐dependent and disease‐specific diversity in protein interactions within stress granules. Cell. 2018;172(3):590‐604.e13. doi: 10.1016/j.cell.2017.12.032 [DOI] [PMC free article] [PubMed] [Google Scholar]
- 49. Youn J‐Y, Dunham WH, Hong SJ, et al. High‐density proximity mapping reveals the subcellular organization of mRNA‐associated granules and bodies. Mol Cell. 2018;69(3):517‐532.e11. doi: 10.1016/j.molcel.2017.12.020 [DOI] [PubMed] [Google Scholar]
- 50. Ayache J, Bénard M, Ernoult‐Lange M, et al. P‐body assembly requires DDX6 repression complexes rather than decay or Ataxin2/2L complexes. Mol Biol Cell. 2015;26(14):2579‐2595. doi: 10.1091/mbc.E15-03-0136 [DOI] [PMC free article] [PubMed] [Google Scholar]
- 51. Luo Y, Na Z, Slavoff SA. P‐bodies: composition, properties, and functions. Biochemistry. 2018;57(17):2424‐2431. doi: 10.1021/acs.biochem.7b01162 [DOI] [PMC free article] [PubMed] [Google Scholar]
- 52. Zografos TA, Katritsis DG. Natriuretic peptides as predictors of atrial fibrillation recurrences following electrical cardioversion. Arrhythmia Electrophysiol Rev. 2013;2(2):109‐114. doi: 10.15420/aer.2013.2.2.109 [DOI] [PMC free article] [PubMed] [Google Scholar]
- 53. Lin S, Fu XD. SR proteins and related factors in alternative splicing. Adv Exp Med Biol. 2007;623:107‐122. doi: 10.1007/978-0-387-77374-2_7 [DOI] [PubMed] [Google Scholar]
- 54. Lukong KE, Chang K‐W, Khandjian EW, Richard S. RNA‐binding proteins in human genetic disease. Trends Genet. 2008;24(8):416‐425. doi: 10.1016/j.tig.2008.05.004 [DOI] [PubMed] [Google Scholar]
- 55. Wang GS, Cooper TA. Splicing in disease: disruption of the splicing code and the decoding machinery. Nat Rev Genet. 2007;8(10):749‐761. doi: 10.1038/nrg2164 [DOI] [PubMed] [Google Scholar]
- 56. Cooper TA, Wan L, Dreyfuss G. RNA and disease. Cell. 2009;136(4):777‐793. doi: 10.1016/j.cell.2009.02.011 [DOI] [PMC free article] [PubMed] [Google Scholar]
- 57. Ihara K, Sasano T, Hiraoka Y, et al. A missense mutation in the RSRSP stretch of Rbm20 causes dilated cardiomyopathy and atrial fibrillation in mice. Sci Rep. 2020;10(1):17894. doi: 10.1038/s41598-020-74800-8 [DOI] [PMC free article] [PubMed] [Google Scholar]
- 58. Schneider JW, Oommen S, Qureshi MY, et al. Dysregulated ribonucleoprotein granules promote cardiomyopathy in RBM20 gene‐edited pigs. Nat Med. 2020;26(11):1788‐1800. doi: 10.1038/s41591-020-1087-x [DOI] [PMC free article] [PubMed] [Google Scholar]
- 59. Cáceres JF, Screaton GR, Krainer AR. A specific subset of SR proteins shuttles continuously between the nucleus and the cytoplasm. Genes Dev. 1998;12(1):55‐66. doi: 10.1101/gad.12.1.55 [DOI] [PMC free article] [PubMed] [Google Scholar]
- 60. Piñol‐Roma S, Dreyfuss G. Shuttling of pre‐mRNA binding proteins between nucleus and cytoplasm. Nature. 1992;355(6362):730‐732. doi: 10.1038/355730a0 [DOI] [PubMed] [Google Scholar]
- 61. Daoud H, Valdmanis PN, Kabashi E, et al. Contribution of TARDBP mutations to sporadic amyotrophic lateral sclerosis. J Med Genet. 2009;46(2):112‐114. doi: 10.1136/jmg.2008.062463 [DOI] [PubMed] [Google Scholar]
- 62. Kabashi E, Valdmanis PN, Dion P, et al. TARDBP mutations in individuals with sporadic and familial amyotrophic lateral sclerosis. Nat Genet. 2008;40(5):572‐574. doi: 10.1038/ng.132 [DOI] [PubMed] [Google Scholar]
- 63. Rutherford NJ, Zhang Y‐J, Baker M, et al. Novel mutations in TARDBP (TDP‐43) in patients with familial amyotrophic lateral sclerosis. PLoS Genet. 2008;4(9):e1000193. doi: 10.1371/journal.pgen.1000193 [DOI] [PMC free article] [PubMed] [Google Scholar]
- 64. Sreedharan J, Blair IP, Tripathi VB, et al. TDP‐43 mutations in familial and sporadic amyotrophic lateral sclerosis. Science. 2008;319(5870):1668‐1672. doi: 10.1126/science.1154584 [DOI] [PMC free article] [PubMed] [Google Scholar]
- 65. Wang C, Zhang Y, Methawasin M, et al. RBM20S639G mutation is a high genetic risk factor for premature death through RNA‐protein condensates. J Mol Cell Cardiol. 2022;165:115‐129. doi: 10.1016/j.yjmcc.2022.01.004 [DOI] [PMC free article] [PubMed] [Google Scholar]
Associated Data
This section collects any data citations, data availability statements, or supplementary materials included in this article.
Supplementary Materials
Fig S1‐S7
Table S1‐S4
Video S1
Video S2
Video S3
Data S1
Data S2
Data S3
Data S4
Data S5
Data Availability Statement
The dataset that supports the findings of this study is openly available in the NCBI GEO database at https://www.ncbi.nlm.nih.gov/geo/query/acc.cgi?acc=GSE180216, reference number (No. GSE180216). All other data supporting the findings of this study are included in this article.