

Abstract
Synaptic abnormality is an important pathologic feature of autism spectrum disorders (ASDs) and responsible for various behavioral defects in these neurodevelopmental disorders. Microglia are the major immune cells in the brain and also play an important role in synapse refinement. Although dysregulated synaptic pruning by microglia during the brain development has been associated with ASDs, the underlying mechanism has yet to be fully elucidated. Herein, we observed that expression of Transmembrane protein 59 (TMEM59), a protein recently shown to regulate microglial function, was decreased in autistic patients. Furthermore, we found that both male and female mice with either complete or microglia-specific loss of Tmem59 developed ASD-like behaviors. Microglial TMEM59-deficient mice also exhibited enhanced excitatory synaptic transmission, increased dendritic spine density, and elevated levels of excitatory synaptic proteins in synaptosomes. TMEM59-deficient microglia had impaired capacity for synapse engulfment both in vivo and in vitro. Moreover, we demonstrated that TMEM59 interacted with the C1q receptor CD93 and TMEM59 deficiency promoted CD93 protein degradation in microglia. Downregulation of CD93 in microglia also impaired synapse engulfment. These findings identify a crucial role of TMEM59 in modulating microglial function on synapse refinement during brain development and suggest that TMEM59 deficiency may contribute to ASDs through disrupting phagocytosis of excitatory synapse and thus distorting the excitatory-inhibitory (E/I) neuronal activity balance.
SIGNIFICANCE STATEMENT Microglia play an important role in synapse refinement. Dysregulated synaptic pruning by microglia during brain development has been associated with autism spectrum disorders (ASDs). However, the underlying mechanism has yet to be fully elucidated. Herein, we observe that the expression of Transmembrane protein 59 (TMEM59), an autophagy-related protein, is decreased in autistic patients. Moreover, we find ASD-like behaviors in mice with complete loss and with microglia-specific loss of Tmem59. Mechanistic studies reveal that TMEM59 deficiency in microglia impairs their synapse engulfment ability likely through destabilizing the C1q receptor CD93, thereby leading to enhanced excitatory neurotransmission and increased dendritic spine density. Our findings demonstrate a crucial role of microglial TMEM59 in early neuronal development and provide new insight into the etiology of ASDs.
Keywords: autism spectrum disorders, CD93, microglia, neuronal transmission, synaptic phagocytosis, TMEM59
Introduction
Autism spectrum disorders (ASDs) are a group of neuropsychiatric disorders characterized by impairment in communication and social interaction, stereotyped and repetitive behavior, restricted interests, as well as other associated neurologic issues including anxiety, hyperactivity, seizures, and learning and memory impairment (Geschwind, 2009; Bhat et al., 2014; Lai et al., 2014). Both environmental and genetic factors contribute to ASD etiology (Waye and Cheng, 2018). Recent genome-wide association studies have identified a series of ASD risk genes, such as FMR1, SHANK3, MECP2, CUL3, and CDKL5 (Crawford et al., 2001; T Wang et al., 2016; Turner et al., 2017; Ramaswami and Geschwind, 2018). Many of these ASD risk genes encode synaptic proteins at glutamatergic synapses (Peça and Feng, 2012; Barak and Feng, 2016), suggesting excitatory synaptic dysfunction as a likely basis for ASD pathology.
Microglia, the dominant immune cells in the CNS, are responsible for phagocytosis of dead cells, microbes, and other substances harmful to the CNS (Colonna and Butovsky, 2017; Guo et al., 2020). Moreover, microglia can regulate brain development and maintain homeostasis of functional neuronal connections (Thion et al., 2018; Cserép et al., 2020). Microglia drive synaptic pruning by engulfing excessive synapses through interacting with neurons (Neniskyte and Gross, 2017). The selective refinement and elimination of redundant neuronal connections is necessary for the formation of functionally mature neural circuits. Dysregulated microglial functions have been associated with ASD pathogenesis. Excessive microglial activation (Suzuki et al., 2013) and increased dendritic spine density (Hutsler and Zhang, 2010; G Tang et al., 2014) were found in patients with ASDs. Loss of the ASD risk gene FMR1 homolog in mice reduced microglia-mediated synaptic pruning in the CA1 region and increased dendritic spine density (Jawaid et al., 2018). However, mutations in identified ASD risk genes account for only a subset of ASDs. There is an urgent requirement for identifying additional ASD risk genes and elucidating the underlying mechanism.
Classical complement cascade has been demonstrated to participate in synaptic pruning during brain development (Stevens et al., 2007; Presumey et al., 2017). Mice deficient in C1q, C3, and C4 exhibit impaired synapse elimination (Stevens et al., 2007; Sekar et al., 2016). As the initiator in the classical complement cascade, C1q has been found to colocalize with synaptic markers and mediate microglial phagocytosis of synapse (Bialas and Stevens, 2013; Lui et al., 2016; Krukowski et al., 2018). The Type I transmembrane glycoprotein CD93 is a C1q receptor and has also been associated with microglial phagocytosis and inflammation (Nepomuceno and Tenner, 1998; Nepomuceno et al., 1999; Steinberger et al., 2002; Bohlson et al., 2005; Nativel et al., 2019). However, whether CD93 participates in microglia-mediated synaptic remodeling remains unknown.
Transmembrane protein 59 (TMEM59), also known as dendritic cell factor 1 (DCF1), is ubiquitously expressed in various tissues (Zheng et al., 2017). TMEM59 can interact with ATG16L1 to induce LC3 activation and autophagy (Boada-Romero et al., 2013; Zheng et al., 2017). Recent studies suggest that TMEM59 can also modulate microglial activities and neuroinflammation (J. Wang et al., 2018; Z. Liu et al., 2020). Notably, one recent study found that Tmem59loxP/loxP;Nestin-Cre mice, with a loss of TMEM59 in neural cells specifically, exhibited ASD-like behaviors such as impaired social interaction and elevated self-grooming (Q. Liu et al., 2017). Nevertheless, whether and how TMEM59 alteration contributes to human ASDs has yet to be ascertained.
Materials and Methods
Animals
Tmem59 conditional knock-out (KO) mice (Tmem59flox/flox, C57BL/6 background) were generated using a traditional homozygous recombination strategy by Cyagen Biosciences. Briefly, a homology region covering mouse Tmem59 exon 3 to exon 6 was subcloned into the targeting vector. One Loxp site was then introduced into Tmem59 intron 3, and another Loxp site together with a modified Rox-flanked Neo cassette was introduced into Tmem59 intron 5. After linearization, the targeting vector was transfected into C57BL/6 background mouse embryonic stem cells. After G418 selection and confirmation of successful homologous recombination of the targeting vector, positive clones were injected into mouse blastocysts, which were then implanted into pseudo-pregnant females. Born chimeric mice (F0) were crossed with C57BL/6 mice to generate F1 mice carrying the recombined allele. The Neo cassette flanked by modified Rox sites was self-deleted during mouse production, with a confidential design by Cyagen Biosciences. Tmem59flox/flox mice were crossed with Lyz2-Cre (Heckmann et al., 2019; kindly provided by Nengming Xiao) and Zp3-Cre (Cheng et al., 2018; kindly provided by Haibin Wang) mice to generate homozygous Tmem59flox/flox;Lyz2-Cre (59fl/fl;Lyz2) and Tmem59−/− (KO) mice that have Tmem59 exon 4 and exon 5 deleted specifically in microglia and germline, respectively (Fig. 2D). Both male and female mice were used in this study and the sex of mice used for each experiment was indicated in related figure legends. All animal experimental procedures were performed in accordance with the National Institutes of Health Guide for the Care and Use of Laboratory Animals and approved by the Animal Ethics Committee of Xiamen University. The PCR primers used for genotyping were as follows: Tmem59flox/flox, forward-5′-GAGTAGATGATGCTGACATAGAC-3′, reverse-5′-CCTCTAAGGAGCTTTCTAAGTG-3′; Lyz2-Cre, forward-5′-CCCAGAAATGCCAGATTACG-3′, reverse-5′-CTTGGGCTGCCAGAATTTCTC-3′; Zp3-Cre, forward-5′-CAGATGAGGTTTGAGGCCACAG-3′, reverse-5′-TTCTTGCG AACCTCATCACTC-3′; Tmem59−/−, wild-type (WT)-forward-5′-GAGTAGATGATGCTGACATAGAC-3′, KO-forward-5′-GTAAGAAACTAGAACTGGGCTTGAGC-3′, Common reverse-5′-CCTCTAAGGAGCTTTCTAAGTG-3′.
Figure 2.
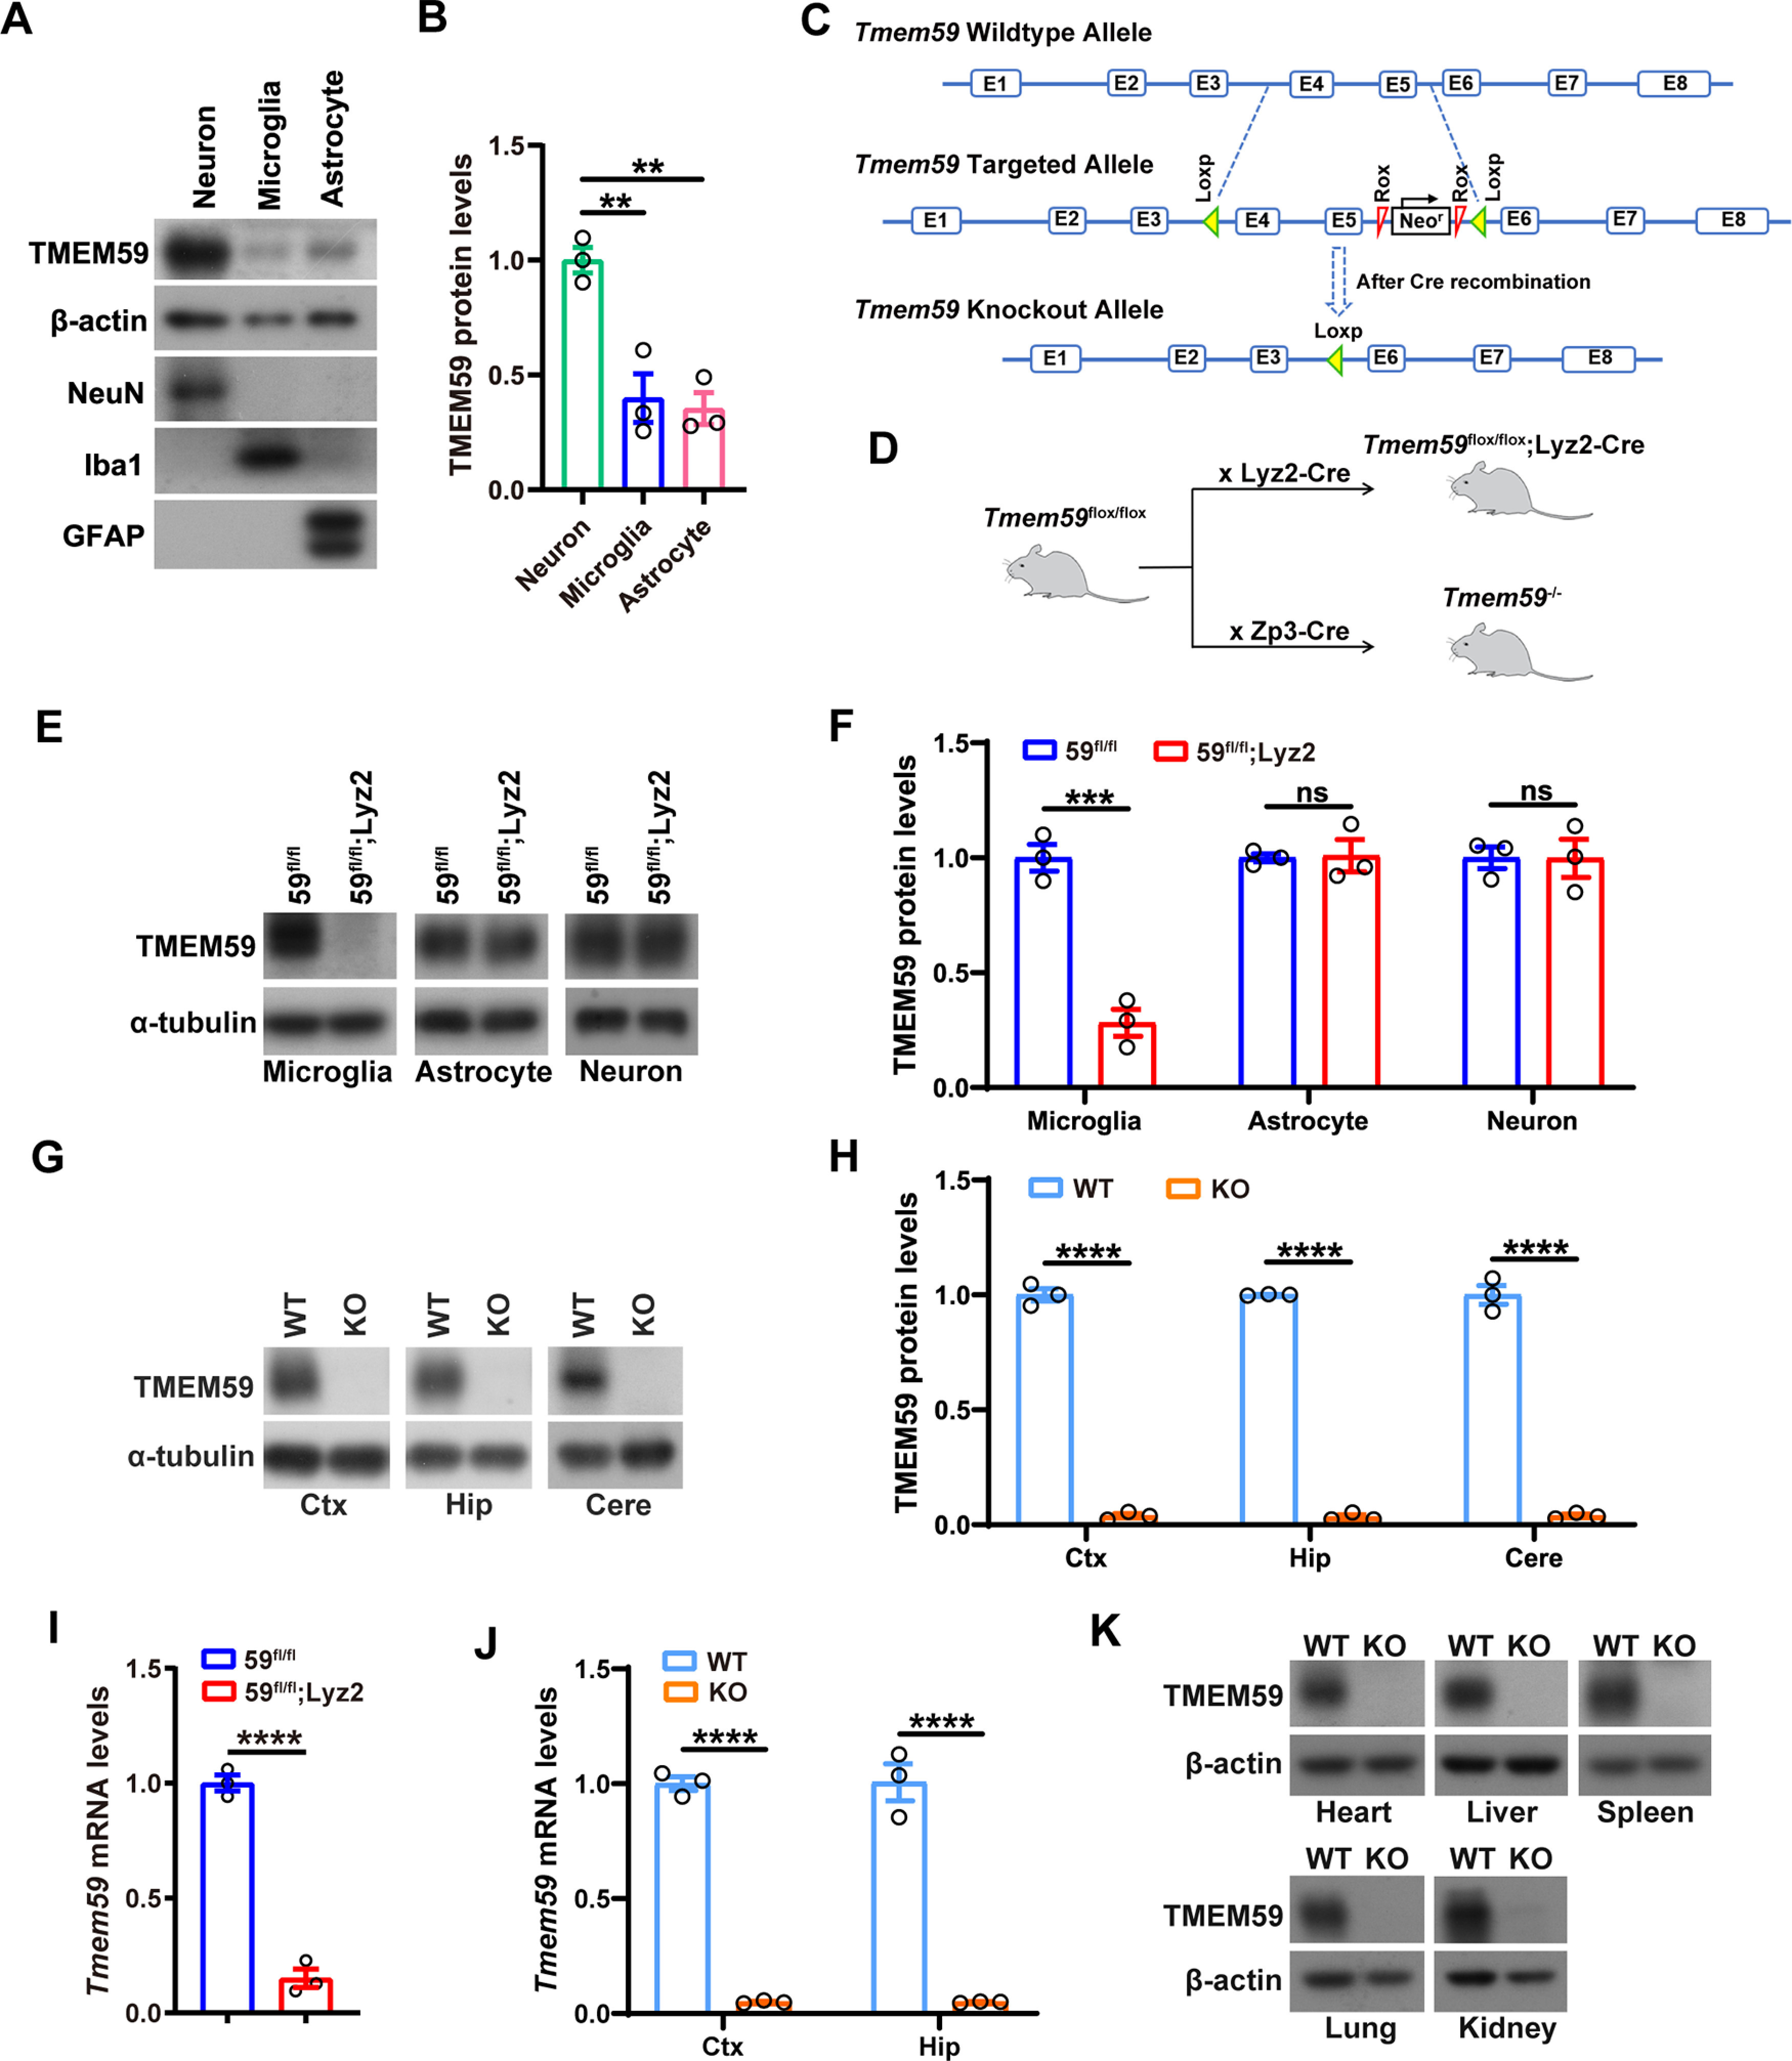
Generation of Tmem59 conditional KO mice. A, B, Representative Western blottings and quantification of TMEM59 protein levels in cultured primary neurons, microglia, and astrocytes. n = 3 independent experiments, one-way ANOVA followed by Tukey's post hoc test. C, The strategy used for constructing Tmem59 conditional KO mice (Tmem59flox/flox). D, Schematic diagram for generating Tmem59 KO mice. By crossing Tmem59flox/flox with Lyz2-Cre and Zp3-Cre mice, Tmem59 is specifically deleted in microglia (Tmem59flox/flox;Lyz2-Cre, abbreviated as 59fl/fl;Lyz2) and germline (Tmem59−/−, or Tmem59 KO), respectively. E, F, Representative Western blottings and quantification of TMEM59 protein levels in cultured primary microglia, neurons, and astrocytes from 59fl/fl;Lyz2 mice with respective controls. n = 3 independent experiments, unpaired t test. G, H, Representative Western blottings and quantification of TMEM59 protein levels in cortex (Ctx), hippocampus (Hip), and cerebellum (Cere) of Tmem59 KO and WT control mice. n = 3 mice per group, unpaired t test. I, J, qRT-PCR analysis of Tmem59 mRNA levels in primary microglia from 59fl/fl;Lyz2 mice (I), and in cortex (Ctx) and hippocampus (Hip) of Tmem59 KO mice (J) and respective controls. n = 3, unpaired t test. K, Representative Western blottings of TMEM59 protein levels in heart, liver, spleen, lung, and kidney from Tmem59 KO and WT mice. Data represent mean ± SEM; **p < 0.01, ***p < 0.001, ****p < 0.0001, ns: not significant.
Primary cell cultures
Mouse primary neurons, microglia, and astrocytes were prepared as reported previously (Giralt et al., 2016; Zhong et al., 2017; McInnes et al., 2018) and described briefly below:
Neuronal cultures
The cerebral cortex and hippocampus of mice at embryonic day (E)16.5 were used to isolate neurons. Neurons were plated in six-well plates coated with poly-L-lysine (Sigma-Aldrich) and cultured in neurobasal medium (Invitrogen) containing 2% B27 (Invitrogen), 1% L-glutamine (Invitrogen) and 1% penicillin-streptomycin (Invitrogen).
Microglial cultures
Mouse brains at postnatal day (P)1–P3 were used to isolate glial cells. Mixed glial cells were plated in flasks coated with poly-L-lysine (Sigma-Aldrich) and cultured in DMEM (Invitrogen) containing 10% heat-inactivated FBS (Invitrogen) and 25 ng/ml granulocyte-macrophage colony stimulating factor (GM-CSF; R&D Systems, 415-ML). Ten days later, microglia cells were harvested by shaking flasks for 20 min.
Astrocytic cultures
The cerebral cortex and hippocampus of mice at P1–P3 were used to isolate astrocytes. Astrocytes were plated in flasks coated with poly-L-lysine (Sigma-Aldrich) and cultured in DMEM/F-12 (Invitrogen) containing 10% heat-inactivated FBS (Invitrogen).
Microglia-neuron co-cultures
For direct contact coculture, primary microglia were directly added into plates containing WT primary neurons at 1:2 ratio, and cultured for another 2 d starting on 13–14 d in vitro (DIV13–DIV14). For transwell coculture, microglia were added into transwell inserts (0.4-µm pore, Costar) above DIV13–DIV14 neurons at 1:2 ratio, and cultured for another 2 d.
Behavioral tests
Behavioral experiments started when mice were at two months of age. All tests were conducted blindly to mouse genotypes. Data were recorded and analyzed using Smart 3.0 video tracking system (Panlab, Harvard Apparatus).
Three-chamber social interaction
Social interaction test was performed in a rectangular, three-chambered box as described previously (Peça et al., 2011). Each chamber was 20 cm (L) × 40 cm (W) × 22 cm (H), and dividing walls were clear with small openings (5 cm × 5 cm) as access to each chamber. There was an empty cage in each side chamber. The test mouse was first allowed to habituate in the three chambers for 10 min, and then moved into the middle chamber. After a strange mouse (stranger 1) was placed into one of the empty cages, the test mouse was allowed to explore freely for 10 min. Following this, another strange mouse (Stranger 2) was placed into the other empty cage and the test mouse was allowed to explore freely over a 10-min session again. The movement of the test mouse and its time spent in contact with cages were recorded.
Self-grooming
The test mouse was placed in a clean cage with fresh bedding. After 5 min of habituation, mouse spontaneous behaviors were recorded for 10 min to evaluate time spent in grooming.
Nest building
Nest building was scored following a protocol previously described (Deacon, 2006). Briefly, a square cotton (3 g) as nesting material was placed into a cage with fresh bedding. The test mouse was then placed into this cage. The next morning, the nest was scored in a 1–5 scale: score 1, >90% nesting cotton remains intact; score 2, 50–90% of nesting cotton remains intact; score 3, >50% nesting cotton was shredded and spread around the cage; score 4, >90% of nesting cotton was torn and gathered with a flat nest lower than mouse body height; and score 5, >90% of nesting cotton was torn and reformed into a (near) perfect nest with walls higher than mouse height.
Transfection
Plasmids were transfected into HEK293T or HeLa cells by TurboFect Transfection Reagent (ThermoFisher), and siRNAs (GenePharma) were transfected into HEK293T or primary microglia using Entranster-R4000 reagent (Engreen), following the manufacturers' instructions. After transfection for 72 h, cells were used for additional experiments. siRNA sequences used were as follows: negative control, 5′-UUCUCCGAACGUGUCACGU-3′; Cd93 siRNA-1, 5′-GAGCUCCUGUAUCUUUAAA-3′; Cd93 siRNA-2, 5′-GCUGGAUGAUCUAGUAACU-3′; TMEM59 siRNA, 5′-GCACAGAGCUUCAUAACCU-3′.
Quantitative real-time PCR (qRT-PCR)
Total RNA was extracted from primary cells or brain tissues using the TRIzol reagent (Invitrogen), following the manufacturer's instructions. Purified RNA was reverse transcribed into cDNA using the Rever Tra Ace qPCR RT kit (TOYOBO). The FastStart Universal SYBR Green Master (Rox; Roche) was used for qRT-PCR. Primer sequences for target genes were as follows: Tmem59, forward-5′-AACTCACAAGCACACAGGAACT-3′, reverse-5′-CAACACCATCACCGAGAGGA-3′; Tnfα, forward-5′-GTCTACTGAACTTCGGGGTGAT-3′, reverse-5′-CTGAGTGTGAGGGTCTGGGC-3′; Il-1β, forward-5′-CAGGCAGGCAGTATCACTCATTG-3′, reverse-5′-GCTTTTTTGTTGTTCATCTCGGA-3′; Arg1, forward-5′-CACAGTCTGGCAGTTGGAAGC-3′, reverse-5′-CTTTGGCAGATATGCAGGGAG-3′; Ym-1, forward-5′-CAGGTCTGGCAATTCTTCTGAA-3′, reverse-5′-GTCTTGCTCATGTGTGTAAGTGA-3′; Cd93, forward-5′-TGTTTTACATCCTGGGGACGG-3′, reverse-5′-GGCCACATAGTCTTCAGCAGT-3′; β-actin, forward-5′-AGCCATGTACGTAGCCATCCA-3′, reverse-5′-TCTCCGGAGTCCATCACAATG-3′.
Western blotting
Mouse brain tissues or cells were lysed in a lysis buffer (25 mm Tris-HCl [pH 7.6], 150 mm NaCl, 1% sodium deoxycholate, 1% Nonidet P-40, and 0.1% SDS), supplemented with the Complete Protease Inhibitor Cocktail (Roche). Twenty-five micrograms of total proteins were subjected to SDS-PAGE and detected by indicated antibodies. Primary antibodies used were as follows: anti-TMEM59 (custom-made by ABclonal, WG-03224D), anti-NeuN (Abcam, ab177487, 1:1000), anti-GFAP (Cell Signaling Technology, 3670S, 1:1000), anti-Iba1 (Wako, 016-20001, 1:500), anti-VGluT1 (Millipore, MAB5502, 1:2000), anti-Syntaxin18 (Proteintech, 16013-1-AP, 1:1000), anti-Synaptophysin (Sigma-Aldrich, S5768, 1:2000), anti-GluR1 (Millipore, MAB2263, 1:1000), anti-GluR2 (Proteintech, 11994-1-AP, 1:2000), anti-GluR3 (Millipore, MAB5416, 1:1000), anti-NR1 (Cell Signaling Technology, 5704S, 1:1000), anti-NR2A (Proteintech, 19953-1-AP, 1:1000), anti-NR2B (Proteintech, 19954-1-AP, 1:1000), anti-PSD-95 (Cell Signaling Technology, 3450S, 1:2000), anti-Gephyrin (Proteintech, 12681-1-AP, 1:2000), anti-CD93 (Abcam, ab134079, 1:2000), anti-CD11b (ABclonal, A1581,1:2000), anti-C1qA (Hycult Biotech, HM1096BT, 1:1000), anti-C1qB (ABclonal, A5339, 1:1000), anti-C1qC (Immunoway, YT0565, 1:2000), anti-C3 (Abcam, ab200999, 1:2000), anti-Ubiquitin (Abcam, ab7780, 1:1000), anti-myc (Cell Signaling Technology, 2276S, 1:1000), anti-HA (Abmart, M20003L, 1:1000), anti-β-actin (Cell Signaling Technology, 8457S, 1:5000), anti-α-tubulin (Millipore, MABT205, 1:10 000), and anti-GAPDH (Abways, AB0038, 1:5000). The secondary antibodies used were Goat anti-Rabbit IgG (H+L)-HRP (ThermoFisher, 31460) and Goat anti-Mouse IgG (H+L)-HRP (ThermoFisher, 31430).
Co-immunoprecipitation (co-IP)
HEK293T cells were lysed in a lysis buffer [50 mm Tris-HCl (pH 8.0), 150 mm NaCl, 2 mm EDTA, and 1% Nonidet P-40], supplemented with the Complete Protease Inhibitor Cocktail (Roche). One mg of cell lysates were incubated with indicated antibodies and Protein G-Sepharose (ThermoFisher) at 4°C overnight. Proteins were eluted with SDS-PAGE loading buffer, followed by Western blot analysis.
Biotinylation assays
Cell surface biotinylation was performed as described previously (X Wang et al., 2013). Briefly, cells were washed with ice-cold PBS containing 1 mm MgCl2 and 1.3 mm CaCl2, and then incubated gently with 0.5 mg/ml Sulfo-NHS-SS-Biotin (ThermoFisher, 21331) at 4°C for 30 min. After stopping the reaction by incubating with 50 mm NH4Cl for 10 min, cells were lysed in 1% Nonidet P-40 lysis buffer and then incubated with Streptavidin beads (ThermoFisher) at 4°C overnight. Proteins were eluted with SDS-PAGE loading buffer, followed by Western blot analysis.
Isolation of microglia and flow cytometry
Microglia isolation was conducted as previously described (Henry et al., 2009; Ding et al., 2021) with slight modifications. Briefly, mice were anesthetized and perfused with ice-cold PBS. The cerebral cortex and hippocampus were homogenized gently in HBSS and filtered through a cell strainer (70 µm). Cell pellets were resuspended in 30% Percoll solution and centrifuged at 800 × g for 40 min at 4°C. New cell pellets were washed and resuspended in FACS buffer (PBS containing 1% FBS and 2 mm EDTA). Cells were incubated with anti-CD11b-APC (eBioscience, 17-0112-82, 1:200), anti-CD45-FITC (eBioscience, 11-0451-85, 1:200) and anti-CD93 (Abcam, ab134079, 1:400) for 30 min at 4°C. Cells without anti-CD93 incubation were used as controls. After washing, cells were incubated with a fluorescence-conjugated secondary antibody Alexa Fluor 594 Goat anti-Rabbit IgG (H+L; ThermoFisher, A-11012, 1:500) for 30 min at 4°C. FACS was performed using a Cytoflex LX Flow Cytometer (Beckman) and results were analyzed by FlowJo (Treestar).
Electrophysiology
Acute hippocampal slices from 59fl/fl and 59fl/fl;Lyz2 mice at P19–P22, and cultured neurons on DIV15–DIV16 were subjected to electrophysiological recordings of the miniature EPSCs (mEPSCs) and the miniature IPSCs (mIPSCs), following protocols described previously (Chen et al., 2021). Briefly, 59fl/fl and 59fl/fl;Lyz2 mice at P19–P22 were anesthetized with isoflurane. Mouse brains were dissected and transverse hippocampal slices (400 µm thick) were prepared in an ice-cold solution (64 mm NaCl, 2.5 mm KCl, 1.25 mm NaH2PO4, 10 mm MgSO4, 0.5 mm CaCl2, 26 mm NaHCO3, 10 mm glucose, and 120 mm sucrose). Slices were recovered at 32°C for 30 min and then at room temperature for an additional 30 min in artificial CSF (ACSF) solution (126 mm NaCl, 3.5 mm KCl, 1.25 mm NaH2PO4, 1.3 mm MgSO4, 2.5 mm CaCl2, 26 mm NaHCO3, and 10 mm glucose). During recordings, slices were bathed in ACSF solution. All solutions were equilibrated with 95% O2 and 5% CO2 (pH 7.2–7.4). Hippocampal CA1 pyramidal neurons were clamped with an amplifier (Axon Multiclamp 700B) and digitized by pClamp software (Molecular Devices). Pipettes were filled with the solution containing 140 mm CsCH3SO3, 2 mm MgCl2·6H2O, 10 mm HEPES, 1 mm EGTA, 5 mm TEA-Cl, 2.5 mm Mg-ATP, and 0.3 mm Na2-GTP, pH 7.3 (320mOsm). The glass pipettes were pulled from borosilicate glass and the resistance was 5–7 MΩ. The mEPSCs and the mIPSCs were recorded at a holding potential of –70 and 0 mV, respectively, in the presence of 0.5 µm TTX. Primary cultured neurons were recorded in the presence of 1 µm TTX with access resistance larger than 25 MΩ excluded. Data were sampled at 10 kHz, low-pass filtered at 2 kHz and analyzed using the MiniAnalysis software.
Postsynaptic density (PSD) protein purification
Mouse brain PSD fractions were prepared as described previously (Bermejo et al., 2014). Briefly, Mouse brains were dissected and homogenized in cold sucrose buffer [0.32 m sucrose and 25 mm HEPES, pH 7.4, supplemented with protease inhibitors (MCE)]. The homogenate was centrifuged at 4°C, 1400 × g for 10 min to separate the supernatant (S1, total lysate) from nuclei and cell debris. S1 fractions were centrifuged at 4°C, 10,000 × g for 12 min to obtain the pellet (P2, crude synaptosomal fractions). P2 fractions were split into two equal parts and washed twice with sucrose buffer. One P2 part was re-suspended in cold HBS buffer (25 mm HEPES, pH 7.4 and 150 mm NaCl, supplemented with protease inhibitors) to get the synaptosomal (Syn) fractions. The other P2 part was re-suspended in HBS buffer with 1% Triton X-100 and incubated for 60 min at 4°C, and then centrifuged at 40,000 × g for 30 min at 4°C. The generated pellet (PSD fractions) was collected and re-suspended in HBS buffer with 3% SDS.
Engulfment assays
Synaptosomes were purified as described previously (Dunkley et al., 2008), and conjugated with pHrodo Red dye (ThermoFisher, P36600) for 1–2 h at room temperature with gentle shaking (Byun and Chung, 2018). After removing unbound dye through multiple centrifugations, labeled synaptosomes were prepared and stored at −80°C. For engulfment or phagocytic activity assays, pHrodo Red dye-labeled synaptosomes or pHrodo Green Escherichia coli Bioparticles (ThermoFisher, P35366) were incubated with primary microglia for 2 h. Un-engulfed synaptosomes or Bioparticles were washed away by PBS, and microglia were subjected to immunostaining and imaging analysis.
Immunostaining
Mouse coronal slices (15 µm thick) were blocked in 5% BSA and 0.2% Triton X-100 in PBS for 1 h at room temperature, incubated with antibodies against Iba1 (Wako, 019-19741, 1:500), CD68 (Biolegend, 137001, 1:100) and PSD-95 (Millipore, MAB1596, 1:200) at 4°C overnight, and then stained with appropriate fluorescence-conjugated secondary antibodies for 1 h at room temperature and counterstained with DAPI for the nuclei. The secondary antibodies used were as follows: Alexa Fluor 488 Goat anti-Rabbit IgG (H+L; ThermoFisher, A-11008, 1:500), Alexa Fluor 594 Goat anti-Rat IgG (H+L; ThermoFisher, A-11007, 1:500), and Alexa Fluor 635 Goat anti-Mouse IgG (H+L; ThermoFisher, A-31575, 1:500). Confocal images were acquired with an Olympus FV1000MPE-B confocal microscope. For microglia counts, images were processed with the ImageJ software. For microglial morphology and engulfed PSD-95 puncta analysis, 3D reconstruction images were processed as described previously (Schafer et al., 2014) using the Imaris 9.2.1 software (Bitplane).
For cell immunostaining, cells were fixed in 4% paraformaldehyde (pH 7.4) for 15 min, followed by permeabilization with 0.2% Triton X-100 in PBS for 10 min and blocking in 2% bovine serum albumin in PBS for 1 h at room temperature. Cells were incubated with an anti-Iba1 antibody (Wako, 019-19741, 1:200) or anti-myc antibody (Cell Signaling Technology, 2276, 1:200) at 4°C overnight and then stained with a fluorescence-conjugated secondary antibody Alexa Fluor 488 Goat anti-Rabbit IgG (H+L; ThermoFisher, A-11008, 1:500), Alexa Fluor 594 Goat anti-Rabbit IgG (H+L; ThermoFisher, A-11012, 1:500), or Alexa Fluor 594 Goat anti-Mouse IgG (H+L; ThermoFisher, A-11005, 1:500) for 1 h at room temperature and counterstained with DAPI for the nuclei. An Olympus FV1000MPE-B confocal microscope was used for image acquisition. Images were processed with the ImageJ software.
Golgi staining
Golgi staining was conducted following the protocol previously described (Zhao et al., 2019). Briefly, mouse brains were dissected and brain coronal slices (150 µm thick) were obtained using a VT1200S vibratome (Leica). Staining procedures were performed using a FD Rapid Golgistain kit (FD NeuroTechnologies) following the manufacturer's instructions. Images were captured with an Olympus FV1000 MPE-B confocal microscope from the secondary basal dendrites of cortical Layer V neurons and hippocampal CA1 pyramidal neurons. Images were calibrated according to the acquisition parameters and spine numbers were counted. Mature (mushroom shape) and immature (thin and stubby shape) spines as described by (Harris et al., 1992) were quantified for comparison. The criteria for spine classification are as the following: Mushroom: d1 ≥ 10 d2; Thin: d1 < 10 d2 and d2 ≪ L; Stubby: d2 ≈ L.
Statistical analysis
Statistical analysis was performed with the GraphPad Prism 8 software (GraphPad Software). All data represent mean ± SEM. Differences between two groups were analyzed using unpaired t test (two-tail distribution). For multiple comparisons, differences were assessed by one-way ANOVA followed by Tukey's post hoc test or two-way ANOVA followed by Bonferroni's post hoc test. p < 0.05 was considered to be statistically significant.
Results
Decreased TMEM59 expression in ASD patients
In one study comparing gene expression in lymphoblastoid cells from controls and ASD patients with a 15q11–q13 duplication or a fragile X mutation (Gene Expression Omnibus profile database, ID 41720291), we noticed that TMEM59 mRNA expression was significantly reduced in both types of patients compared with controls (F(2,27) = 8.936, p = 0.0011, one-way ANOVA; Fig. 1A). In another study comparing gene expression in peripheral blood lymphocytes from autistic children and controls (Gene Expression Omnibus profile database, ID 92270468), TMEM59 mRNA expression was also found to be significantly reduced in autistic patients (t(144) = 2.325, p = 0.0215, unpaired t test; Fig. 1B). These findings establish a link between TMEM59 alteration and ASDs.
Figure 1.

TMEM59 mRNA expression is decreased in ASD patients. A, Quantification of TMEM59 mRNA levels in lymphoblastoid cells of controls and ASD patients with a 15q11–q13 duplication [dup(15q)] or a fragile X mutation (FMR1-FM). n = 15 for control, n = 7 for dup(15q), and n = 8 for FMR1-FM, one-way ANOVA followed by Tukey's post hoc test. Data from Gene Expression Omnibus (GEO) profile database, ID: 41720291. B, Quantification of TMEM59 mRNA levels in peripheral blood lymphocytes of autistic children and controls. n = 69 for control and n = 77 for autism, unpaired t test. Data from GEO profile database, ID: 92270468. Data represent mean ± SEM; *p < 0.05, **p < 0.01.
ASD-like behaviors in mice with TMEM59 deficiency in microglia
TMEM59 is ubiquitously expressed in primary neurons, microglia, and astrocytes (F(2,6) = 20.26, p = 0.0021, one-way ANOVA; Fig. 2A,B). We generated Tmem59 conditional KO mice (Meng et al., 2020) and by crossing them with Lyz2-Cre and Zp3-Cre lines, we acquired mice that lack Tmem59 specifically in microglia (59fl/fl;Lyz2) and germline (Tmem59−/−, KO), respectively (Fig. 2C,D). TMEM59 protein and mRNA expression were significantly reduced specifically in microglia in 59fl/fl;Lyz2 mice [microglia, t(4) = 8.667, p = 0.001; Astrocyte, t(4) = 0.1322, p = 0.9012; Neuron, t(4) = 0.02,288, p = 0.9828, unpaired t test (Fig. 2E,F); t(4) = 16.14, p < 0.0001, unpaired t test (Fig. 2I)]. Loss of TMEM59 protein and mRNA expression in various brain tissues [Ctx, t(4) = 33.88, p < 0.0001; Hip, t(4) = 94.52, p < 0.0001; Cere, t(4) = 22.98, p < 0.0001, unpaired t test (Fig. 2G,H); Ctx, t(4) = 31.78, p < 0.0001; Hip, t(4) = 11.9, p = 0.0003, unpaired t test (Fig. 2J)], as well as in peripheral organs (Fig. 2K) in Tmem59 KO mice was also confirmed.
We conducted behavioral tests for the TMEM59-deficient mice. In the three-chamber social interaction test, none of tested mice showed preference for either the left or the right chamber during the habituation phase [F(1,42) = 0.2715, p = 0.605, two-way ANOVA (Fig. 3A); F(1,36) = 1.416, p = 0.2419, two-way ANOVA (Fig. 3D); F(1,34) = 0.7162, p = 0.4033, two-way ANOVA (Fig. 3G)]. But unlike the control mice, which spent significantly more time exploring the cage with a strange mouse (Stranger 1) than the empty cage, male and female 59fl/fl;Lyz2 mice (Male, F(1,42) = 4.113, p = 0.0489, two-way ANOVA; Female, F(1,36) = 7.166, p = 0.0111, two-way ANOVA; Fig. 3B,E), as well as male Tmem59 KO mice (F(1,34) = 31.38, p < 0.0001, two-way ANOVA; Fig. 3H) spent comparable amount of time exploring the two. Moreover, both male 59fl/fl;Lyz2 mice (F(1,42) = 13.03, p = 0.0008, two-way ANOVA; Fig. 3C) and male Tmem59 KO mice (F(1,34) = 3.548, p = 0.0682, two-way ANOVA; Fig. 3I) showed no preference for another strange mouse (Stranger 2) over the familiar mouse (Stranger 1), whereas their respective controls exhibited social novelty. Although female 59fl/fl;Lyz2 mice had no preference for Stranger 2 over Stranger 1, their controls exhibited no social novelty for unknown reasons (F(1,36) = 0.8673, p = 0.3579, two-way ANOVA; Fig. 3F), making it inconclusive whether female 59fl/fl;Lyz2 mice develop social novelty defect.
Figure 3.
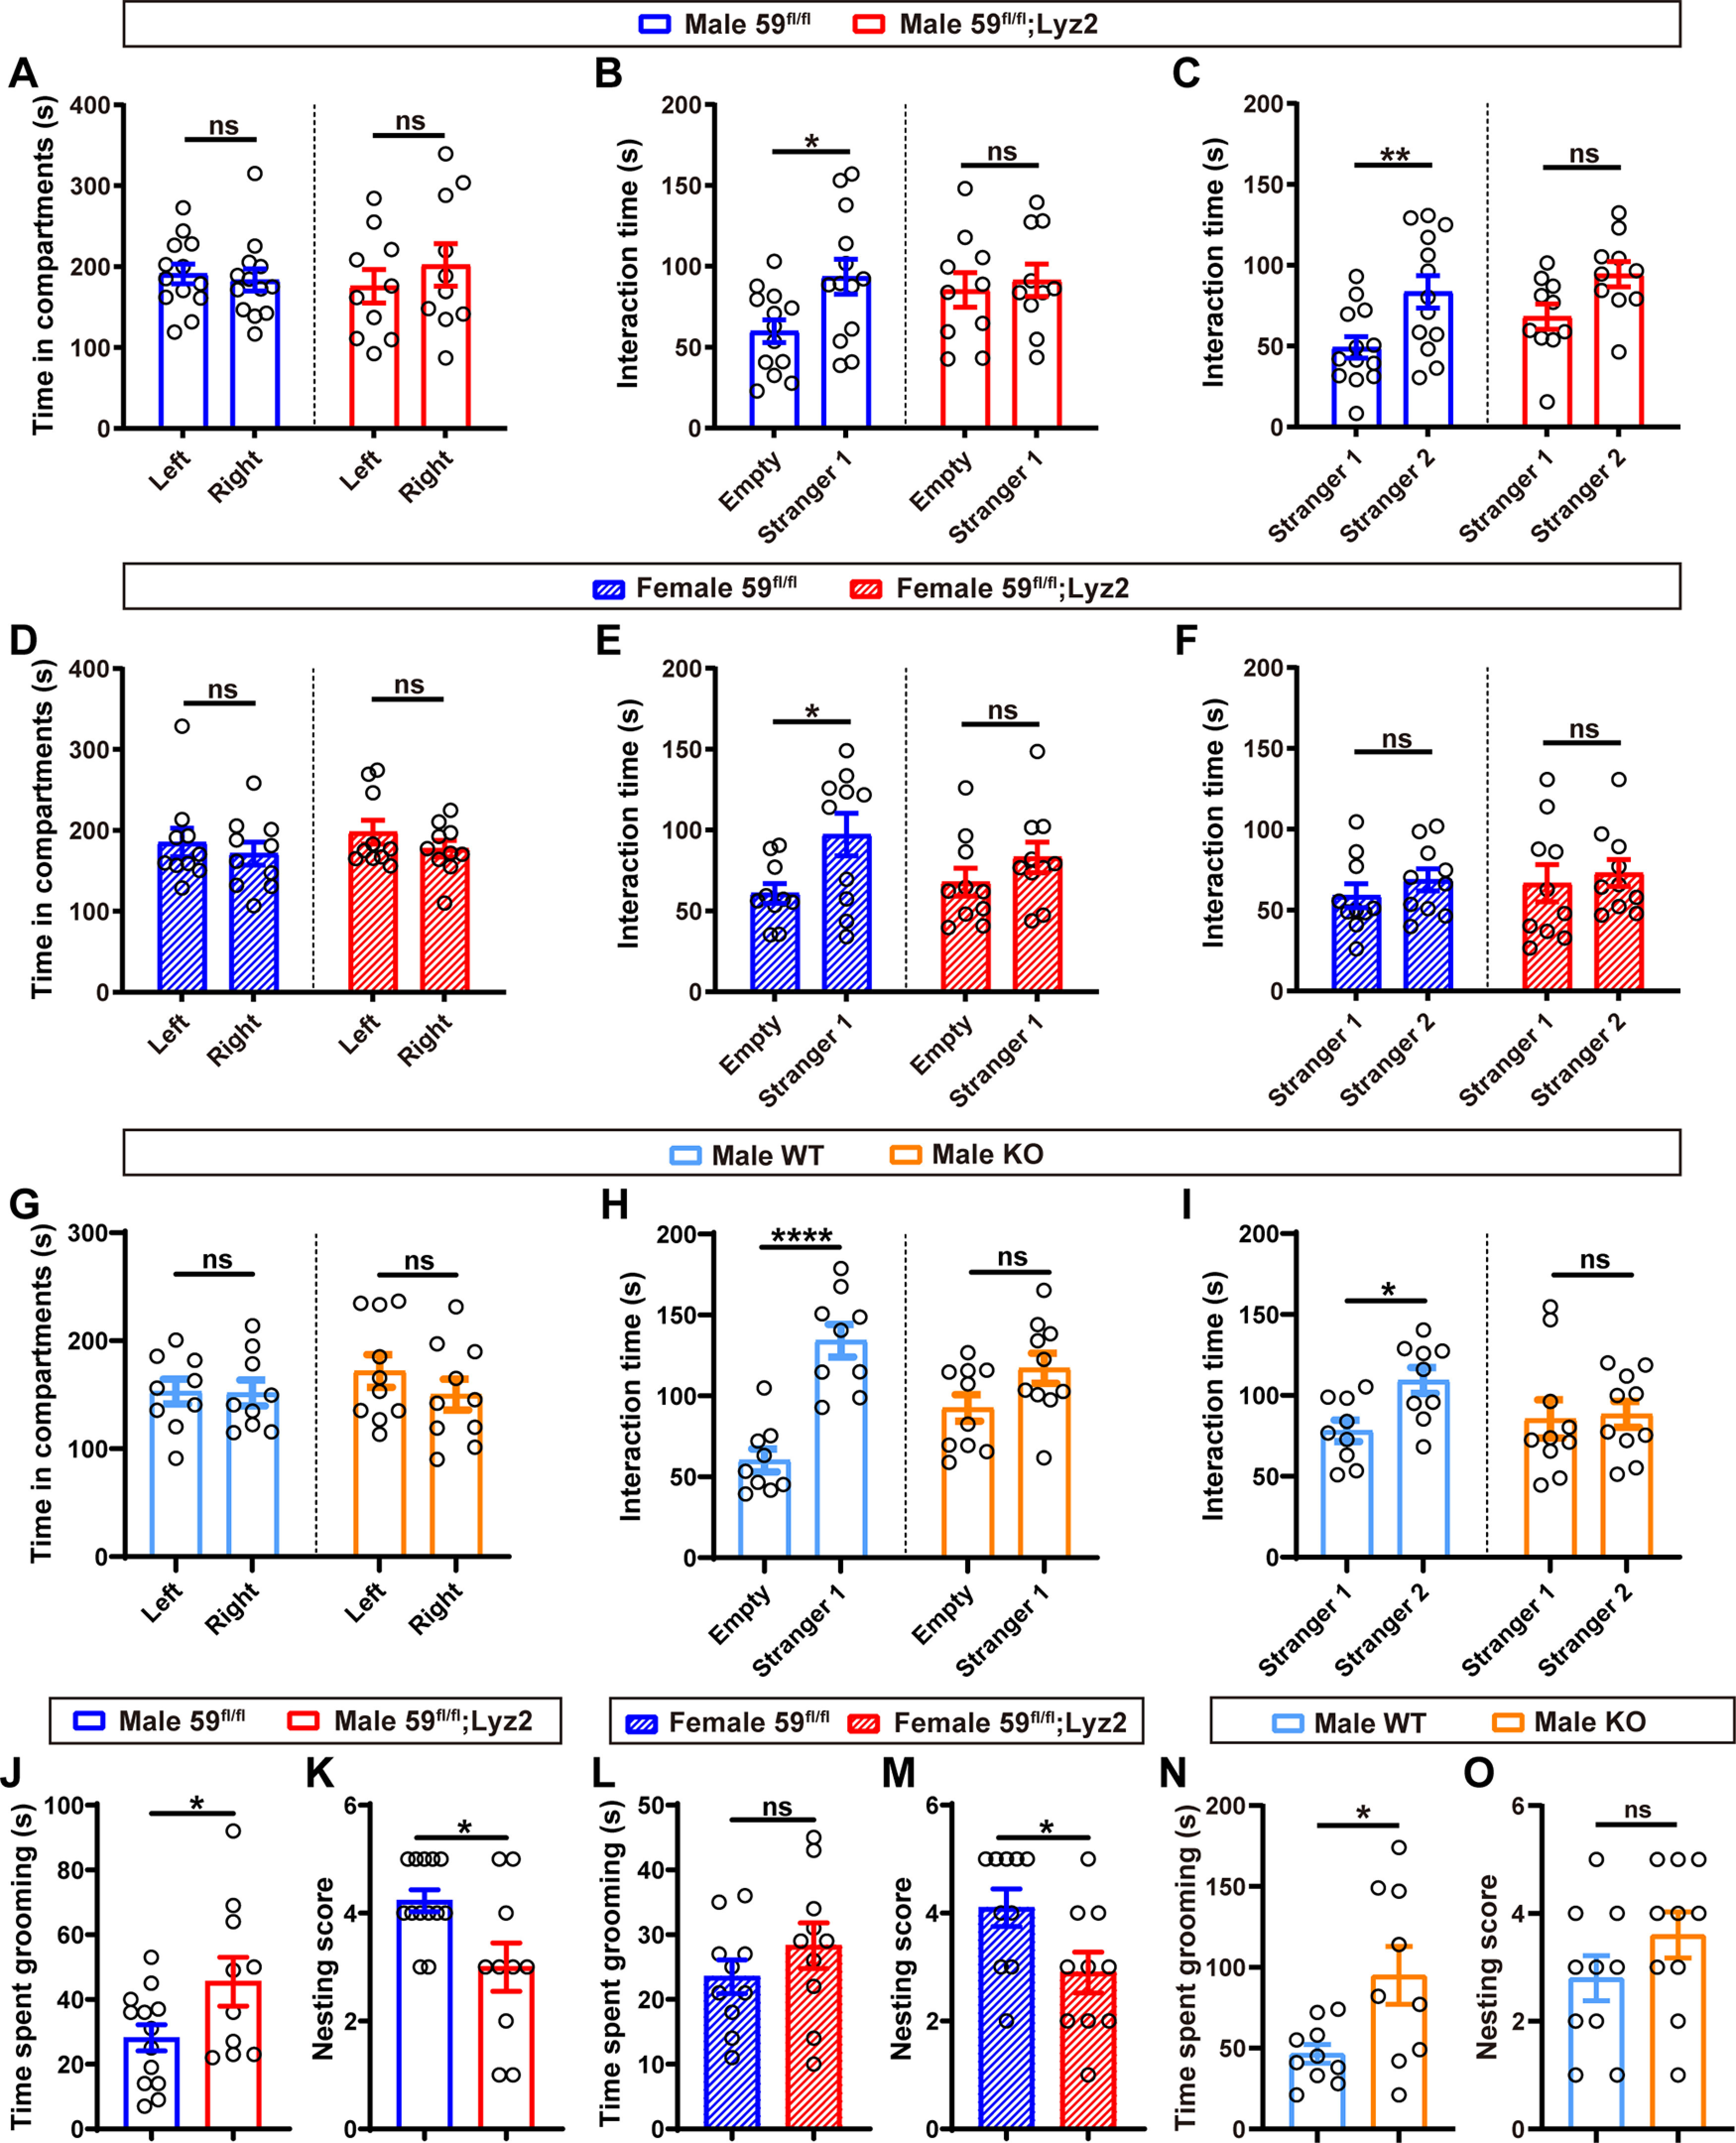
Mice with TMEM59 deficiency in microglia exhibit autistic behaviors. A, D, G, In the three-chamber social interaction test, time spent in exploring left and right chambers by male 59fl/fl;Lyz2 (n = 10) and 59fl/fl (n = 13) mice (A), by female 59fl/fl;Lyz2 (n = 10) and 59fl/fl (n = 10) mice (D), and by male Tmem59 KO (n = 10) and WT (n = 9) mice (G); two-way ANOVA followed by Bonferroni's post hoc test. B, E, H, In the three-chamber social interaction test, time spent in interacting with an empty cage or a strange mouse (Stranger 1) by male 59fl/fl;Lyz2 (n = 10) and 59fl/fl (n = 13) mice (B), by female 59fl/fl;Lyz2 (n = 10) and 59fl/fl (n = 10) mice (E), and by male Tmem59 KO (n = 10) and WT (n = 9) mice (H); two-way ANOVA followed by Bonferroni's post hoc test. C, F, I, In the three-chamber social interaction test, time spent in interacting with Stranger 1 or another strange mouse (Stranger 2) by male 59fl/fl;Lyz2 (n = 10) and 59fl/fl (n = 13) mice (C), by female 59fl/fl;Lyz2 (n = 10) and 59fl/fl (n = 10) mice (F), and by male Tmem59 KO (n = 10) and WT (n = 9) mice (I); two-way ANOVA followed by Bonferroni's post hoc test. J, L, N, In the self-grooming test, total grooming time of male 59fl/fl;Lyz2 (n = 10) and 59fl/fl (n = 13) mice (J), of female 59fl/fl;Lyz2 (n = 10) and 59fl/fl (n = 10) mice (L), and of male Tmem59 KO (n = 9) and WT (n = 10) mice (N); unpaired t test. K, M, O, In the nest building test, nesting scores of male 59fl/fl;Lyz2 (n = 10) and 59fl/fl (n = 13) mice (K), of female 59fl/fl;Lyz2 (n = 10) and 59fl/fl (n = 10) mice (M), and of male Tmem59 KO (n = 10) and WT (n = 10) mice (O); unpaired t test. Data represent mean ± SEM; *p < 0.05, **p < 0.01, ****p < 0.0001, ns: not significant.
In the self-grooming test, both male 59fl/fl;Lyz2 mice (t(21) = 2.161, p = 0.0424, unpaired t test; Fig. 3J) and male Tmem59 KO mice (t(17) = 2.699, p = 0.0152, unpaired t test; Fig. 3N) displayed increased self-grooming time compared with controls, whereas female 59fl/fl;Lyz2 mice had no apparent difference in self-grooming time compared with controls (t(18) = 1.097, p = 0.2873, unpaired t test; Fig. 3L). In the nest building test, both male and female 59fl/fl;Lyz2 mice acquired much less scores than control mice (Male, t(21) = 2.72, p = 0.0128, unpaired t test; Female, t(18) = 2.334, p = 0.0314, unpaired t test; Fig. 3K,M), although male Tmem59 KO mice had scores comparable to controls (t(18) = 1.342, p = 0.1964, unpaired t test; Fig. 3O). Altogether, these results indicate that TMEM59 deficiency in microglia results in ASD-like behaviors, though with some differences between male and female mice.
Enhanced excitatory synaptic transmission in 59fl/fl;Lyz2 mice
Dysregulated excitatory-inhibitory (E/I) neuronal activity balance has been associated with neuropsychiatric disorders such as ASDs and schizophrenia (Eichler and Meier, 2008; Yizhar et al., 2011). We conducted whole-cell patch-clamp recordings of mEPSCs and mIPSCs in CA1 pyramidal neurons of acute hippocampal slices from mice at P19–P22, the peak period for synapse refinement (Filipello et al., 2018; Jawaid et al., 2018). We found that male 59fl/fl;Lyz2 mouse neurons displayed significantly increased mEPSC frequencies but not amplitudes when compared with controls (Frequency, t(8) = 2.342, p = 0.0473; Amplitude, t(8) = 0.3623, p = 0.7265, unpaired t test; Fig. 4A–C). However, mIPSC frequencies and amplitudes were not altered in male 59fl/fl;Lyz2 mouse neurons compared with controls (Frequency, t(8) = 0.2504, p = 0.8086; Amplitude, t(8) = 0.2876, p = 0.781, unpaired t test; Fig. 4D–F). Moreover, we found that the mEPSC frequencies but not amplitudes were also elevated in female 59fl/fl;Lyz2 mouse neurons (Frequency, t(6) = 2.536, p = 0.0443; Amplitude, t(6) = 0.6837, p = 0.5197, unpaired t test; Fig. 4G–I), and the mIPSC frequencies and amplitudes were not altered in female 59fl/fl;Lyz2 mouse neurons (Frequency, t(6) = 0.4474, p = 0.6703; Amplitude, t(6) = 0.0715, p = 0.9454, unpaired t test; Fig. 4J–L) when compared with controls. These results suggest that the presence of TMEM59 in microglia is required for proper excitatory synaptic transmission.
Figure 4.

TMEM59 deficiency in microglia enhances neuronal excitatory synaptic transmission in mice. A, Representative mEPSC traces of CA1 pyramidal neurons in male 59fl/fl and 59fl/fl;Lyz2 mice (P19–P22). B, C, Quantification of mEPSC frequency and amplitude. n = 5 mice per group, average of 5–6 neurons from each mouse. D, Representative mIPSC traces of CA1 pyramidal neurons in male 59fl/fl and 59fl/fl;Lyz2 mice (P19–P22). E, F, Quantification of mIPSC frequency and amplitude. n = 5 mice per group, average of five to 5–6 neurons from each mouse. G, Representative mEPSC traces of CA1 pyramidal neurons in female 59fl/fl and 59fl/fl;Lyz2 mice (P19–P22). H, I, Quantification of mEPSC frequency and amplitude. n = 4 mice per group, average of 6 neurons from each mouse. J, Representative mIPSC traces of CA1 pyramidal neurons in female 59fl/fl and 59fl/fl;Lyz2 mice (P19–P22). K, L, Quantification of mIPSC frequency and amplitude. n = 4 mice per group, average of 6 neurons from each mouse. Data represent mean ± SEM; *p < 0.05, ns: not significant, unpaired t test.
Compromised modulation on excitatory synaptic transmission by TMEM59-deficient microglia
To ascertain that the increased excitatory synaptic transmission in 59fl/fl;Lyz2 mice is caused by a deficiency of TMEM59 in microglia, we cultured primary neurons from 59fl/fl and 59fl/fl;Lyz2 mice and recorded the neurotransmission at DIV16. We found that the frequency and amplitude of mEPSCs (Frequency, t(29) = 0.4303, p = 0.6701; Amplitude, t(29) = 1.258, p = 0.2184, unpaired t test; Fig. 5A–C), as well as those of mIPSCs (Frequency, t(27) = 0.4986, p = 0.6221; Amplitude, t(27) = 0.1861, p = 0.8537, unpaired t test; Fig. 5D–F) were not significantly different between neurons of the two genotypes, suggesting that in vivo synaptic transmission difference between 59fl/fl;Lyz2 and 59fl/fl mice is not attributed to intrinsic neuronal properties before the synaptic pruning period.
Figure 5.

TMEM59-deficient microglia affect neuronal synaptic transmission through direct contact. A, Representative mEPSC traces of primary neurons (DIV16) from 59fl/fl and 59fl/fl;Lyz2 mice. B, C, Quantification of mEPSC frequency and amplitude. n = 14 for 59fl/fl and n = 17 for 59fl/fl;Lyz2 from 3 independent experiments per group, unpaired t test. D, Representative mIPSC traces of primary neurons (DIV16) from 59fl/fl and 59fl/fl;Lyz2 mice. E, F, Quantification of mIPSC frequency and amplitude. n = 14 for 59fl/fl and n = 15 for 59fl/fl;Lyz2 from 3 independent experiments per group, unpaired t test. G, H, Schemes for neurons co-cultured with microglia (G) or cultured with microglia in transwell inserts (H). I, Representative mEPSC traces of WT neurons that were cultured alone (N) and co-cultured with 59fl/fl microglia (N+MCre-) or with 59fl/fl;Lyz2 microglia (N+MCre+) for another 2 d starting on DIV13–DIV14. J, K, Quantification of mEPSC frequency and amplitude. n = 18 for N, n = 16 for N+MCre–, and n = 16 for N+MCre+ from 4 independent experiments per group, one-way ANOVA followed by Tukey's post hoc test. L, Representative mIPSC traces of WT neurons that were cultured alone (N) and co-cultured with 59fl/fl microglia (N+MCre-) or with 59fl/fl;Lyz2 microglia (N+MCre+) for another 2 d starting on DIV13–DIV14. M, N, Quantification of mIPSC frequency and amplitude. n = 16 for N, n = 14 for N+MCre–, and n = 14 for N+MCre+ from 4 independent experiments per group, one-way ANOVA followed by Tukey's post hoc test. O, Representative mEPSC traces of WT neurons cultured alone (N Trans) and cultured with 59fl/fl microglia (N+MCre- Trans) or with 59fl/fl;Lyz2 microglia (N+MCre+ Trans) in transwell inserts for another 2 d starting on DIV13–DIV14. P, Q, Quantification of mEPSC frequency and amplitude. n = 15 for N Trans, n = 14 for N+MCre- Trans, and n = 15 for N+MCre+ Trans from 3 independent experiments per group, one-way ANOVA followed by Tukey's post hoc test. Data represent mean ± SEM; **p < 0.01, ***p < 0.001, ns: not significant.
We also evaluated synapse elimination by microglia in vitro (Lui et al., 2016; Filipello et al., 2018). When primary microglia from 59fl/fl and 59fl/fl;Lyz2 mice were co-cultured in direct contact with WT mouse primary neurons (Fig. 5G), both the frequency and amplitude of mEPSCs were significantly reduced in neurons co-cultured with 59fl/fl microglia when compared with neurons cultured alone (Frequency, F(2,47) = 6.47, p = 0.0033; Amplitude, F(2,47) = 10.3, p = 0.0002, one-way ANOVA; Fig. 5I–K), indicating the microglial capacity to eliminate excitatory synapses. More importantly, neurons co-cultured with 59fl/fl;Lyz2 microglia had higher mEPSC frequencies but not amplitudes than those co-cultured with 59fl/fl microglia (Frequency, F(2,47) = 6.47, p = 0.0033; Amplitude, F(2,47) = 10.3, p = 0.0002, one-way ANOVA; Fig. 5I–K), suggesting that TMEM59 deficiency reduced the capacity of microglia to eliminate excitatory synapses. In such microglia-neuron co-cultures with direct contact, neuronal mIPSC frequencies and amplitudes were not affected (Frequency, F(2,41) = 0.6867, p = 0.5089; Amplitude, F(2,41) = 0.4073, p = 0.6681, one-way ANOVA; Fig. 5L–N). We also studied whether microglia could affect synaptic transmission through secreting certain regulatory factors. However, when 59fl/fl or 59fl/fl;Lyz2 microglia were cultured in transwell inserts above neurons to facilitate their exchange of secretory factors without direct contact (Fig. 5H), no significantly different mEPSC frequencies and amplitudes were found between neurons co-cultured with the two different microglia (Frequency, F(2,41) = 0.1322, p = 0.8766; Amplitude, F(2,41) = 1.02, p = 0.3695, one-way ANOVA; Fig. 5O–Q). These results highlight a crucial role of TMEM59 in regulating microglial capacity to eliminate excitatory synapses through a direct microglia-neuron contact.
Increased spine density and excitatory synaptic proteins in the PSD in 59fl/fl;Lyz2 mice
We conducted Golgi staining and found markedly increased numbers of both mature and immature dendritic spines in P19–P22 male 59fl/fl;Lyz2 mice compared with controls (Ctx, F(1,8) = 28.01, p = 0.0007; Hip, F(1,8) = 269.8, p < 0.0001, two-way ANOVA; Fig. 6A,B). P19–P22 female 59fl/fl;Lyz2 mice also displayed significantly higher immature dendritic spine density than controls (Ctx, F(1,8) = 7.949, p = 0.0225; Hip, F(1,8) = 13.88, p = 0.0058, two-way ANOVA; Fig. 6C,D). Four-month-old male 59fl/fl;Lyz2 mice had more dendritic spines than control mice as well (Ctx, F(1,8) = 38.71, p = 0.0003; Hip, F(1,8) = 21.96, p = 0.0016, two-way ANOVA; Fig. 6E,F). We next studied synaptic protein levels in different synapse fractions. At the total brain lysate level, none of the synaptic protein levels studied were significantly altered in 59fl/fl;Lyz2 mice compared with controls (VGluT1, t(6) = 1.009, p = 0.3521; STX18, t(6) = 1.268, p = 0.2518; SYP, t(6) = 0.7577, p = 0.4773; GluR1, t(10) = 1.374, p = 0.1994; GluR2, t(10) = 0.3537, p = 0.7309; GluR3, t(10) = 0.193, p = 0.8508; NR1, t(10) = 1.197, p = 0.259; NR2A, t(10) = 0.9765, p = 0.3519; NR2B, t(10) = 1.376, p = 0.1988; PSD-95, t(10) = 1.155, p = 0.2748; Gephyrin, t(10) = 0.9306, p = 0.374, unpaired t test; Fig. 7A–D). However, levels of presynaptic markers VGluT1 and Syntaxin18 (STX18; VGluT1, t(6) = 3.618, p = 0.0111; STX18, t(6) = 2.451, p = 0.0497; SYP, t(6) = 2.183, p = 0.0718, unpaired t test; Fig. 7A,B) and levels of the postsynaptic AMPA receptor subunit GluR1 (GluR1, t(10) = 2.788, p = 0.0192; GluR2, t(10) = 0.7201, p = 0.488; GluR3, t(10) = 0.4921, p = 0.6333; NR1, t(10) = 0.5855, p = 0.5712; NR2A, t(10) = 0.7761, p = 0.4556; NR2B, t(10) = 0.0524, p = 0.9592; PSD-95, t(10) = 0.1709, p = 0.8677; Gephyrin, t(10) = 0.7899, p = 0.4479, unpaired t test; Fig. 7C,D) were increased in synaptosomal (Syn) fractions from 59fl/fl;Lyz2 mice compared with controls. Notably, the excitatory postsynaptic marker PSD-95, as well as several subunits of excitatory AMPA receptors (including GluR1, GluR2, and GluR3) and NMDA receptors (including NR1) showed significantly higher protein levels in PSD fractions from 59fl/fl;Lyz2 mice compared with controls (GluR1, t(10) = 3.752, p = 0.0038; GluR2, t(10) = 4.571, p = 0.001; GluR3, t(10) = 7.487, p < 0.0001; NR1, t(10) = 2.92, p = 0.0153; NR2A, t(10) = 1.145, p = 0.2789; NR2B, t(10) = 1.789, p = 0.1039; PSD-95, t(10) = 3.636, p = 0.0046, unpaired t test; Fig. 7C,D). While levels of the inhibitory postsynaptic marker Gephyrin were not altered (t(10) = 1.141, p = 0.2804, unpaired t test; Fig. 7C,D). These results indicate that loss of TMEM59 in microglia leads to increased dendritic spine density and excitatory synaptic proteins in synaptosomes in vivo.
Figure 6.

TMEM59 deficiency in microglia increases spine density in mice. A, B, Representative Golgi staining images and quantification of dendritic spines in male 59fl/fl and 59fl/fl;Lyz2 mice at P19–P22. Mature and immature spines were indicated by red and green arrowheads, respectively. Scale bars: 5 µm. n = 3 mice per group, average of 7–9 dendrites from each mouse's cortical (Ctx) Layer V and hippocampal (Hip) CA1 regions. C, D, Representative Golgi staining images and quantification of dendritic spines in female 59fl/fl and 59fl/fl;Lyz2 mice at P19–P22. Scale bars: 5 µm. n = 3 mice per group, average of 7–8 dendrites from each mouse's cortical (Ctx) Layer V and hippocampal (Hip) CA1 regions. E, F, Representative Golgi staining images and quantification of dendritic spines in male 59fl/fl and 59fl/fl;Lyz2 mice at four months of age. Scale bars: 5 µm. n = 3 mice per group, average of 5 dendrites from each mouse's cortical (Ctx) Layer V and hippocampal (Hip) CA1 regions. Data represent mean ± SEM; *p < 0.05, **p < 0.01, ****p < 0.0001, ns: not significant, two-way ANOVA followed by Bonferroni's post hoc test.
Figure 7.

TMEM59 deficiency in microglia increases excitatory synaptic proteins. A, B, Representative Western blottings and quantification of presynaptic proteins in total lysate and synaptosomal (Syn) fractions of 59fl/fl and 59fl/fl;Lyz2 mice (P19–P22). n = 4 for both, unpaired t test. C, D, Representative Western blottings and quantification of postsynaptic proteins in total lysate, synaptosomal (Syn) fractions, and PSD fractions of 59fl/fl and 59fl/fl;Lyz2 mice at P19–P22. n = 6 for both, unpaired t test. E, F, Representative Western blottings and quantification of TMEM59 and synaptic proteins in brain lysate from mice at different postnatal days. n = 3 mice per group. Data represent mean ± SEM; *p < 0.05, **p < 0.01, ****p < 0.0001.
We then examined the expression of TMEM59 and synaptic proteins during development. Interestingly, TMEM59 expression reached the highest level on P21, accompanied with reduced excitatory receptors (including NR1 and NR2B) and unaltered inhibitory postsynaptic marker Gephyrin (Fig. 7E,F). These results also imply that TMEM59 plays an important role for microglia in phagocytizing synapse and that excitatory synapses are selectively removed by microglia rather than inhibitory synapses.
Decreased synapse elimination by TMEM59-deficient microglia
To assess whether TMEM59 deficiency leads to microglia abnormalities, we studied and found that microglia with TMEM59 deficiency had decreased proinflammatory factor (Tnfα and Il-1β) expression and increased anti-inflammatory factor (Arg1 and Ym-1) expression (Tnfα, t(10) = 7.094, p < 0.0001; Il-1β, t(10) = 5.87, p = 0.0002; Arg1, t(10) = 3.45, p = 0.0062; Ym-1, t(10) = 3.318, p = 0.0078, unpaired t test; Fig. 8A–D), confirming our previous finding that TMEM59 is involved in neuroinflammation (Z Liu et al., 2020). We also evaluated microglial numbers and morphology in brain coronal slices from 59fl/fl and 59fl/fl;Lyz2 mice at P19–P22. Loss of TMEM59 had no significant effect on microglia numbers in either the cortex or CA1, CA3, and DG regions of the hippocampus (Ctx, t(4) = 2.37, p = 0.0768; CA1, t(4) = 0.9063, p = 0.416; CA3, t(4) = 0.027, p = 0.9798; DG, t(4) = 1.352, p = 0.2477, unpaired t test; Fig. 8E,F). The length and numbers of microglial branches in the cortex and CA1 region of 59fl/fl;Lyz2 mice were normal compared with controls (Ctx length, t(4) = 1.124, p = 0.3238; CA1 length, t(4) = 0.6738, p = 0.5374; Ctx branches, t(4) = 0.0358, p = 0.9731; CA1 branches, t(4) = 0.5561, p = 0.6078, unpaired t test; Fig. 8G–I). These results suggest that loss of TMEM59 has no marked effect on basal microglial numbers and morphology.
Figure 8.

TMEM59 deficiency attenuates microglial inflammation but has minimal effect on microglial density and morphology in mice. A–D, qRT-PCR analysis of Tnfα, Il-1β, Arg1, and Ym-1 mRNA levels in primary microglia from 59fl/fl;Lyz2 mice and controls. n = 6. E, Confocal images showing microglial density (green, Iba1+) in cortex (Ctx) and hippocampal CA1, CA3, and DG regions of 59fl/fl and 59fl/fl;Lyz2 mice (P19–P22). Scale bar: 100 µm. F, Quantification of Iba1+ microglial cells in Ctx, CA1, CA3, and DG regions. n = 3 mice per group. G, Representative 3D reconstruction of microglial morphology in Ctx and CA1 regions of 59fl/fl and 59fl/fl;Lyz2 mice (P19–P22). Scale bar: 15 µm. H, I, Quantification of microglial morphologic parameters, including path length (H) and branch numbers (I) in Ctx and CA1 regions. n = 3 mice per group, average of 7–9 cells from each mouse. Data represent mean ± SEM; **p < 0.01, ***p < 0.001, ****p < 0.0001, ns: not significant, unpaired t test.
We next studied whether the phagocytic capacity of microglia was affected in 59fl/fl;Lyz2 mice during the period of synaptic pruning. Immunofluorescence analysis revealed significantly reduced levels of the lysosomal marker CD68 and an obvious decrease of PSD-95 puncta engulfed in CD68-positive lysosomes in P19–P22 male 59fl/fl;Lyz2 mouse microglia compared with controls (CD68, t(6) = 2.986, p = 0.0245; PSD-95, t(6) = 2.984, p = 0.0245, unpaired t test; Fig. 9A–C; Movies 1, 2). Consistently, P19–P22 female 59fl/fl;Lyz2 mouse microglia exhibited significantly reduced PSD-95 engulfment in CD68-positive lysosomes and a trend of reduction of CD68 in microglia (CD68, t(4) = 2.298, p = 0.0831; PSD-95, t(4) = 2.946, p = 0.0421, unpaired t test; Fig. 9D–F; Movies 3, 4). At four months of age, although there were no significant differences of CD68 levels between male 59fl/fl;Lyz2 mouse microglia and controls, CD68-positive lysosomes in male 59fl/fl;Lyz2 microglia still engulfed less PSD-95 puncta than controls (CD68, t(4) = 0.9755, p = 0.3845; PSD-95, t(4) = 2.997, p = 0.0401, unpaired t test; Fig. 9G–I). To further investigate the engulfment capacity of microglia on synaptic structures, we cultured primary microglia from 59fl/fl and 59fl/fl;Lyz2 mice and incubated them with pHrodo Red dye-labeled synaptosomes that contain various complements including C1q (Fig. 9J). Fewer synaptosomes were found to be colocalized with TMEM59-deficient microglia than with controls (t(94) = 9.856, p < 0.0001, unpaired t test; Fig. 9K,L). Moreover, we found that after incubation with synaptosomes, 59fl/fl;Lyz2 microglia contained much less synaptophysin (SYP) than control microglia (t(6) = 3.421, p = 0.0141, unpaired t test; Fig. 9M,N). These results demonstrate that TMEM59 plays an important role in regulating the function of microglia on synapse phagocytosis.
Figure 9.

TMEM59 deficiency in microglia reduces synapse elimination. A, Representative confocal images and 3D reconstruction of CD68+ lysosomes (red) and engulfed PSD-95 (gray) in Iba1+ microglia (green) in the hippocampal CA1 region of male 59fl/fl and 59fl/fl;Lyz2 mice (P19–P22). Scale bars: 5 µm. B, C, Quantification of CD68+ lysosome volume percentage in microglia (B) and engulfed PSD-95 volume percentage in lysosomes (C). n = 4 mice per group, average of 6 cells from each mouse. D, Representative confocal images and 3D reconstruction of CD68+ lysosomes (red) and engulfed PSD-95 (gray) in Iba1+ microglia (green) in the hippocampal CA1 region of female 59fl/fl and 59fl/fl;Lyz2 mice (P19–P22). Scale bars: 5 µm. E, F, Quantification of CD68+ lysosome volume percentage in microglia (E) and engulfed PSD-95 volume percentage in lysosomes (F). n = 3 mice per group, average of 8 cells from each mouse. G, Representative confocal images and 3D reconstruction of CD68+ lysosomes (red) and engulfed PSD-95 (gray) in Iba1+ microglia (green) in the hippocampal CA1 region of male 59fl/fl and 59fl/fl;Lyz2 mice at four months of age. Scale bars: 5 µm. H, I, Quantification of CD68+ lysosome volume percentage in microglia (H) and engulfed PSD-95 volume percentage in lysosomes (I). n = 3 mice per group, average of 9 cells from each mouse. J, Representative Western blottings of complement proteins including C1qA, C1qB, C1qC, and C3 in purified synaptosomes. K, Confocal images of the colocalization of pHrodo Red dye-labeled synaptosomes (Syn) and Iba1+ microglia (green) after incubation for 2 h. Scale bars: 30 and 10 µm (for insets). L, Quantification of Syn+ intensity within Iba1+ microglia after incubation for 2 h. n = 48 cells from 3 independent experiments per group. M, N, Representative Western blottings and quantification of synaptophysin (SYP) in 59fl/fl and 59fl/fl;Lyz2 primary microglia after incubation with synaptosomes (Syn) for 2 h. n = 4 independent experiments. Data represent mean ± SEM; *p < 0.05, ****p < 0.0001, ns: not significant, unpaired t test. See also Movies 1, 2, 3, and 4.
3D reconstruction for Iba1-CD68-PSD-95 from male 59fl/fl mice. Representative 3D surface reconstruction of Iba1+ microglia (green) containing CD68+ lysosomes (red) and engulfed PSD-95+ puncta (gray) in hippocampal CA1 region of male 59fl/fl mice (P19–P22). Scale bar: 10 µm.
3D reconstruction for Iba1-CD68-PSD-95 from male 59fl/fl;Lyz2 mice. Representative 3D surface reconstruction of Iba1+ microglia (green) containing CD68+ lysosomes (red) and engulfed PSD-95+ puncta (gray) in hippocampal CA1 region of male 59fl/fl;Lyz2 mice (P19–P22). Scale bar: 10 µm.
3D reconstruction for Iba1-CD68-PSD-95 from female 59fl/fl mice. Representative 3D surface reconstruction of Iba1+ microglia (green) containing CD68+ lysosomes (red) and engulfed PSD-95+ puncta (gray) in hippocampal CA1 region of female 59fl/fl mice (P19–P22). Scale bar: 10 µm.
3D reconstruction for Iba1-CD68-PSD-95 from female 59fl/fl;Lyz2 mice. Representative 3D surface reconstruction of Iba1+ microglia (green) containing CD68+ lysosomes (red) and engulfed PSD-95+ puncta (gray) in hippocampal CA1 region of female 59fl/fl;Lyz2 mice (P19–P22). Scale bar: 10 µm.
Excessive degradation of CD93 on TMEM59 deficiency
To determine whether complement system participates in impaired synapse phagocytosis caused by TMEM59 deficiency, we studied complement proteins and complement receptors in the brains and primary microglia from 59fl/fl;Lyz2 mice and controls. We found that levels of complement proteins (including C1qA, C1qB, C1qC, and C3) were not altered in the hippocampus and cortex of 59fl/fl;Lyz2 mice compared with controls (Hip, C1qA, t(10) = 0.9562, p = 0.3615; C1qB, t(10) = 0.5032, p = 0.6257; C1qC, t(10) = 0.5999, p = 0.5619; C3, t(10) = 0.0445, p = 0.9654; C3b, t(10) = 1.083, p = 0.3043; iC3b, t(10) = 0.8474, p = 0.4166; C3c, t(10) = 0.3562, p = 0.7291; Ctx, C1qA, t(10) = 0.4882, p = 0.6359; C1qB, t(10) = 1.673, p = 0.1253; C1qC, t(10) = 0.9492, p = 0.3649; C3, t(10) = 1.058, p = 0.3147; C3b, t(10) = 0.7523, p = 0.4692; iC3b, t(10) = 0.1785, p = 0.8619; C3c, t(10) = 0.1851, p = 0.8568, unpaired t test; Fig. 10A,B). Levels of complement proteins in synaptosomes derived from 59fl/fl;Lyz2 mice were also comparable to controls (C1qA, t(4) = 1.503, p = 0.2073; C1qB, t(4) = 1.327, p = 0.2552; C1qC, t(4) = 1.078, p = 0.3419; C3, t(4) = 0.8898, p = 0.4238; C3b, t(4) = 0.065, p = 0.9513; iC3b, t(4) = 0.9725, p = 0.3859; C3c, t(4) = 1.129, p = 0.322, unpaired t test; Fig. 10C,D). However, we found that levels of the C1q receptor CD93 but not the C3 receptor CD11b were dramatically decreased in TMEM59-deficient microglia (CD93, t(10) = 3.508, p = 0.0056; CD11b, t(10) = 0.4851, p = 0.6381, unpaired t test; Fig. 10E,F). Moreover, we performed biotinylation assays and found that cell surface distribution of CD93 were dramatically reduced in TMEM59-deficient microglia compared with controls (Total, t(6) = 10.13, p < 0.0001; Surface, t(6) = 9.767, p < 0.0001, unpaired t test; Fig. 10G,H). To confirm this in vivo, flow cytometry analysis was conducted and the results showed that CD11b+ CD45low microglia isolated from 59fl/fl;Lyz2 mice had significantly low CD93 positivity than those from control mice (t(6) = 3.301, p = 0.0164, unpaired t test; Fig. 10I,J). Exogenously expressed mature and immature CD93 levels were also decreased when TMEM59 was downregulated in HEK293T cells (Mature CD93, t(6) = 4.416, p = 0.0045; Immature CD93, t(6) = 3.01, p = 0.0237; TMEM59, t(6) = 5.122, p = 0.0022, unpaired t test; Fig. 10K,L). TMEM59 deficiency had no effect on Cd93 gene expression in microglia (t(8) = 0.4975, p = 0.6322, unpaired t test; Fig. 10M), implying that TMEM59 affects CD93 posttranscriptionally. We found that CD93 was degraded through both proteasomal and autolysosomal pathways (F(5,12) = 12.22, p = 0.0002, one-way ANOVA; Fig. 11A,B). In addition, TMEM59 deficiency resulted in elevated levels of polyubiquitinated CD93 (t(6) = 2.94, p = 0.0259, unpaired t test; Fig. 11C,D) and accelerated CD93 degradation (F(1,40) = 17.18, p = 0.0002, two-way ANOVA; Fig. 11E,F) in microglia.
Figure 10.

CD93 levels are decreased in TMEM59-deficient microglia. A, B, Representative Western blottings and quantification of complement proteins including C1qA, C1qB C1qC, and C3 in hippocampus (Hip) and cortex (Ctx) of 59fl/fl and 59fl/fl;Lyz2 mice (P19–P22). n = 6. C, D, Representative Western blottings and quantification of complement proteins including C1qA, C1qB C1qC, and C3 in synaptosomes from 59fl/fl and 59fl/fl;Lyz2 mice (P19–P22). n = 3. E, F, Representative Western blottings and quantification of CD93 and CD11b protein levels in primary microglia from 59fl/fl and 59fl/fl;Lyz2 mice. n = 6 independent experiments. G, H, Representative Western blottings and quantification of total and cell surface CD93 protein levels in primary microglia from 59fl/fl and 59fl/fl;Lyz2 mice using biotinylation assays. n = 4 independent experiments. I, J, Representative flow cytometry analysis of CD93 in microglia isolated from 59fl/fl and 59fl/fl;Lyz2 mice (P19–P22). n = 4 mice per group. K, L, Representative Western blottings and quantification of exogenously expressed CD93-HA in HEK293T cells transfected with TMEM59 siRNA (si59) or a negative control (NC). Mature (glycosylated) and immature (nonglycosylated) CD93 were indicated by arrow and arrowhead, respectively. n = 4 independent experiments. M, qRT-PCR analysis of Cd93 mRNA levels in primary microglia from 59fl/fl and 59fl/fl;Lyz2 mice. n = 5 independent experiments. Data represent mean ± SEM; *p < 0.05, **p < 0.01, ****p < 0.0001, ns: not significant, unpaired t test.
Figure 11.

TMEM59 deficiency promotes CD93 degradation in microglia. A, B, Representative Western blottings and quantification of CD93 levels in primary microglia treated with 50 µm cycloheximide (CHX) for 4 h, in the absence or presence of the proteasomal inhibitor MG132 (10 or 20 µm) and the autolysosomal inhibitor chloroquine (CQ, 25 or 50 µm). n = 3 independent experiments, one-way ANOVA followed by Tukey's post hoc test. C, D, Representative Western blottings and quantification of polyubiquitinated CD93 in primary microglia from 59fl/fl and 59fl/fl;Lyz2 mice. n = 4 independent experiments, unpaired t test. E, F, Representative Western blottings and quantification of CD93 degradation in primary microglia from 59fl/fl and 59fl/fl;Lyz2 mice treated with 50 µm CHX for the time course indicated. n = 6 independent experiments, two-way ANOVA followed by Bonferroni's post hoc test. G, Schematic diagram for TMEM59-myc and its truncated constructs TMEM59-NTF-myc and TMEM59-CTF-myc. TM: transmembrane domain. H–J, Representative co-IP between exogenously expressed CD93-HA and TMEM59-myc (H), TMEM59-NTF-myc (I), or TMEM59-CTF-myc (J) proteins in HEK293T cells. Mature (glycosylated) and immature (nonglycosylated) forms of CD93 were indicated by arrows and arrowheads, respectively. K, Confocal images of the colocalization of exogenously expressed CD93-GFP (green) and TMEM59-myc, TMEM59-NTF-myc or TMEM59-CTF-myc (red) in HeLa cells. Scale bar: 10 µm. Data represent mean ± SEM; *p < 0.05, **p < 0.01, ****p < 0.0001.
Moreover, we found that TMEM59 colocalized with and interacted with both mature and immature CD93 (Fig. 11G,H,K). To determine the interaction domain, we co-immunoprecipitated CD93 with TMEM59 amino-terminal fragment (NTF) and carboxyl-terminal fragment (CTF), both of which contain TMEM59 transmembrane domain (Fig. 11G; Z Liu et al., 2020). The results showed that both TMEM59-NTF and TMEM59-CTF interacted with CD93 (Fig. 11I–K), suggesting that CD93 may interact with the transmembrane domain of TMEM59. Together, above results suggest that TMEM59 interacts with and thus stabilizes CD93.
Downregulation of CD93 in microglia reduces phagocytosis activity
CD93 has been reported to enhance the activity of microglial phagocytosis (Nepomuceno and Tenner, 1998; Nepomuceno et al., 1999; Bohlson et al., 2005). To ascertain whether CD93 regulates synapse engulfment, we downregulated CD93 in microglia by transfecting with Cd93 siRNAs (F(2,9) = 57.66, p < 0.0001, one-way ANOVA; Fig. 12A,B) and then incubated cells with pHrodo Red dye-labeled synaptosomes. We found that downregulation of CD93 markedly decreased microglial phagocytosis of synaptosomes compared with controls (F(2,165) = 12.15, p < 0.0001, one-way ANOVA; Fig. 12C,D). Moreover, downregulation of CD93 reduced microglial phagocytosis of pHrodo Green Bioparticles (F(2,153) = 27.52, p < 0.0001, one-way ANOVA; Fig. 12E,F).
Figure 12.

CD93 downregulation reduces microglial activity of phagocytosis. A, B, Representative Western blottings and quantification of CD93 protein levels in cultured primary microglia transfected with two different Cd93 siRNAs (siCd93-1 and siCd93-2) and a negative control (NC). n = 4 independent experiments. C, Confocal images of the colocalization of pHrodo Red dye-labeled synaptosomes (Syn) and Iba1+ microglia (green) in CD93-deficient microglia and controls after incubation for 2 h. Gray indicates cells transfected with FAM-labeled Cd93 siRNAs and NC. Scale bars: 30 and 10 µm (for insets). D, Quantification of Syn+ intensity within Iba1+ microglia after incubation for 2 h. n = 53 cells for NC, n = 60 cells for siCd93-1, and n = 55 cells for siCd93-2 from 3 independent experiments. E, Confocal images of the colocalization of pHrodo Green E. coli Bioparticles and Iba1+ microglia (red) in CD93-deficient microglia and controls after incubation for 2 h. Gray indicates cells transfected with Cy5-labeled Cd93 siRNAs and NC. Scale bars: 30 and 10 µm (for insets). F, Quantification of Bioparticle intensity within Iba1+ microglia after incubation for 2 h. n = 52 cells for NC, n = 53 cells for siCd93-1, and n = 51 cells for siCd93-2 from 4 independent experiments. Data represent mean ± SEM; ****p < 0.0001, one-way ANOVA followed by Tukey's post hoc test.
Discussion
In the present study, we noticed TMEM59 expression reduction in autistic patients. Importantly, we demonstrated that both Tmem59 KO and 59fl/fl;Lyz2 mice exhibited ASD-like behaviors. TMEM59 is ubiquitously expressed in various neural cell types. In supporting the involvement of TMEM59 in ASDs, recent studies from another group reported that Tmem59loxP/loxP;Nestin-Cre mice and Tmem59 KO mice also exhibited ASD-like behaviors and the researchers attributed the cause to a compromised dopamine system and enhanced electrical signal in the mice (Q Liu et al., 2017; Lin et al., 2021). However, since 59fl/fl;Lyz2 mice remained normal TMEM59 expression in neurons and astrocytes (Fig. 2E,F), our results suggest that a loss of TMEM59 in microglia is sufficient to cause ASD-like phenotypes. Nevertheless, our and the other group's findings demonstrate that TMEM59 plays an important role in ASDs.
Microglia play an essential role in synaptic pruning in early neurodevelopmental stages and aging; and microglial dysregulation may cause neurodevelopmental as well as neurodegenerative diseases (Paolicelli et al., 2011; Chung and Barres, 2012; Hong et al., 2016; Neniskyte and Gross, 2017; Presumey et al., 2017; Tremblay et al., 2019; Benitez et al., 2021). Deficiency and mutations in molecules crucial for microglial physiological functions, such as CX3CR1 and TREM2, have been shown to impair synaptic functions and cause ASD-like phenotypes in mice (Zhan et al., 2014; Filipello et al., 2018; Jadhav et al., 2020; Magno et al., 2021). Decreased synaptic pruning and increased dendritic spine density have also been found in both ASD patients and animal models (Hutsler and Zhang, 2010; G Tang et al., 2014; Jawaid et al., 2018). Herein, we found that TMEM59-deficient microglia had reduced engulfment of synaptosomes and PSD-95 puncta both in vitro and in vivo. Consistently, dendritic spine densities were increased in 59fl/fl;Lyz2 mice compared with controls. Levels of multiple synaptic proteins in synaptosomes/PSDs were also elevated in 59fl/fl;Lyz2 mice. These results indicate that TMEM59 deficiency in microglia impairs their ability for phagocytosis of synapse.
The C1q receptor CD93 can enhance phagocytic activity of microglia (Nepomuceno and Tenner, 1998; Nepomuceno et al., 1999; Bohlson et al., 2005). CD93 is synthesized as an nonglycosylated immature form and after O-glycosylation, becomes mature and stabilized on cell surface (Park and Tenner, 2003). We found that TMEM59 interacted with both immature and mature CD93 forms to regulate CD93 stability. TMEM59 deficiency promoted CD93 ubiquitination and degradation. While CD93 downregulation impaired microglial phagocytosis of synaptosomes and Bioparticles, suggesting that TMEM59 regulates synapse elimination likely through modulating CD93.
Dysregulation of the E/I balance, which triggers hyperactivation or hypoactivation of specific brain regions, is a potential pathologic mechanism underlying ASDs (Eichler and Meier, 2008; Barak and Feng, 2016). Enhanced excitatory synaptic transmission has been implicated in ASD etiology (Rubenstein and Merzenich, 2003). For example, hyperexcitability of cortical circuits was associated with loss-of-function mutations in FMRP for fragile X syndrome and MECP2 for Rett syndrome (Gibson et al., 2008; Zhang et al., 2014); and CUL3 or CDKL5 deficiency resulted in impaired sociability accompanied with increased excitatory neurotransmission (S Tang et al., 2019; Dong et al., 2020). Herein, the frequency of mEPSC but not mIPSC was significantly enhanced in 59fl/fl;Lyz2 mice compared with controls, consistent with the increase of excitatory synaptic protein levels but not the inhibitory synaptic protein Gephyrin levels in the PSD. Moreover, the excitatory but not inhibitory synaptic transmission was higher in neurons directly co-cultured with TMEM59-deficient microglia than those with control microglia. These results are in line with the notion that microglia selectively eliminate excitatory synapses (Dejanovic et al., 2018), and further support the idea that TMEM59 deficiency impairs the function of microglia in phagocytosis of synapse.
Microglia are the dominant immune cells in the CNS. Our results as well as others (J Wang et al., 2018; Z Liu et al., 2020) found that TMEM59 deficiency altered microglial expression of various secretory inflammatory factors. Increased inflammation and immune dysregulation have also been associated with ASDs (Pape et al., 2019). However, when neurons were co-cultured with microglia through a transwell setting, no mEPSC differences were found among neurons cultured alone, co-cultured with control microglia, and co-cultured with TMEM59-deficient microglia, indicating that factors secreted by microglia may not directly affect excitatory neurotransmission.
TMEM59 can modulate autophagy through interacting with ATG16L1 (Boada-Romero et al., 2013; Zheng et al., 2017; Z Liu et al., 2020). Autophagy pathways have also been linked in ASD pathogenesis (Lee et al., 2013; Huber et al., 2015). For example, autophagy marker protein levels were found to be altered in postmortem ASD brains (G Tang et al., 2014). PTEN mutation-mediated mTOR disinhibition for blocking autophagy in mice led to ASD-like behaviors and abnormal neuronal arborization (Kwon et al., 2006). Loss of the autophagy-related factor ambra1 resulted in ASD-like phenotypes in mice (Dere et al., 2014). Interestingly, microglia-specific deletion of Atg7, which is vital for autophagy, also impaired synaptic pruning, leading to increased dendritic spines and synaptic markers, and characteristic features of ASDs such as social behavioral defects and repetitive behavior in mice (Kim et al., 2017). We previously found that downregulation of TMEM59 compromised autophagy in microglial cells (Z Liu et al., 2020) and here showed that TMEM59 deficiency promoted CD93 ubiquitination and degradation. It has been suggested that there are reciprocal regulatory mechanisms between autophagy and the ubiquitin-proteasome system (UPS). Once autophagy is impaired, the UPS may be activated to maintain cellular homeostasis (Kocaturk and Gozuacik, 2018). Since CD93 was degraded through both proteasomal and autolysosomal pathways (Fig. 11A,B), it is possible that TMEM59 deficiency promotes UPS-mediated CD93 degradation via compromising autophagy, and this deserves further scrutiny.
In summary, our study demonstrates that TMEM59 interaction with CD93 in microglia plays an important role in the phagocytosis of synapse during early neurodevelopment. Our findings also highlight a correlation between TMEM59 and ASDs, in which decreased TMEM59 expression likely impairs CD93-mediated phagocytosis of synapse through promoting CD93 degradation, leading to increased dendritic spine density, imbalanced E/I neuronal activity, and thus autistic behaviors (Fig. 13). Further elucidation of the participation of TMEM59 in ASDs will strengthen our understanding on disease pathogenesis and help develop new strategies for therapeutics.
Figure 13.

Tmem59 deficiency in microglia leads to impaired phagocytosis of synapse and autism-like behaviors likely through promoting CD93 degradation in mice. TMEM59 interacts with CD93 and plays an important role in microglia to modulate phagocytosis of synapse during early neurodevelopment. TMEM59 deficiency accelerates CD93 degradation in microglia, reduces synapse elimination, and promotes dendritic spine density, thereby causing autism-like behaviors in mice.
Footnotes
This work was supported by National Natural Science Foundation of China Grants U1705285, U21A20361, 82130039, and 81771377 (to Y.-w.Z.) and 92049202 and 92149303 (to Hua. Xu.); the National Key Research and Development Program of China Grant 2018YFC2000400 (to Y.-w.Z.); and The Major Program of Brain Science and Brain-Like Intelligence Technology Grant 2021ZD0202400 (to Hua. Xu.). We thank Dr. Nengming Xiao and Dr. Haibin Wang for providing Lyz2-Cre and Zp3-Cre mice, respectively.
The authors declare no competing financial interests.
References
- Barak B, Feng G (2016) Neurobiology of social behavior abnormalities in autism and Williams syndrome. Nat Neurosci 19:647–655. 10.1038/nn.4276 [DOI] [PMC free article] [PubMed] [Google Scholar]
- Benitez DP, Jiang S, Wood J, Wang R, Hall CM, Peerboom C, Wong N, Stringer KM, Vitanova KS, Smith VC, Joshi D, Saito T, Saido TC, Hardy J, Hanrieder J, De Strooper B, Salih DA, Tripathi T, Edwards FA, Cummings DM (2021) Knock-in models related to Alzheimer's disease: synaptic transmission, plaques and the role of microglia. Mol Neurodegener 16:47. 10.1186/s13024-021-00457-0 [DOI] [PMC free article] [PubMed] [Google Scholar]
- Bermejo MK, Milenkovic M, Salahpour A, Ramsey AJ (2014) Preparation of synaptic plasma membrane and postsynaptic density proteins using a discontinuous sucrose gradient. J Vis Exp (91):e51896. [DOI] [PMC free article] [PubMed] [Google Scholar]
- Bhat S, Acharya UR, Adeli H, Bairy GM, Adeli A (2014) Autism: cause factors, early diagnosis and therapies. Rev Neurosci 25:841–850. 10.1515/revneuro-2014-0056 [DOI] [PubMed] [Google Scholar]
- Bialas AR, Stevens B (2013) TGF-β signaling regulates neuronal C1q expression and developmental synaptic refinement. Nat Neurosci 16:1773–1782. 10.1038/nn.3560 [DOI] [PMC free article] [PubMed] [Google Scholar] [Retracted]
- Boada-Romero E, Letek M, Fleischer A, Pallauf K, Ramón-Barros C, Pimentel-Muiños FX (2013) TMEM59 defines a novel ATG16L1-binding motif that promotes local activation of LC3. EMBO J 32:566–582. 10.1038/emboj.2013.8 [DOI] [PMC free article] [PubMed] [Google Scholar]
- Bohlson SS, Zhang M, Ortiz CE, Tenner AJ (2005) CD93 interacts with the PDZ domain-containing adaptor protein GIPC: implications in the modulation of phagocytosis. J Leukoc Biol 77:80–89. 10.1189/jlb.0504305 [DOI] [PubMed] [Google Scholar]
- Byun YG, Chung WS (2018) A novel in vitro live-imaging assay of astrocyte-mediated phagocytosis using pH indicator-conjugated synaptosomes. J Vis Exp (132):e56647. [DOI] [PMC free article] [PubMed] [Google Scholar]
- Chen F, Swartzlander DB, Ghosh A, Fryer JD, Wang B, Zheng H (2021) Clusterin secreted from astrocyte promotes excitatory synaptic transmission and ameliorates Alzheimer's disease neuropathology. Mol Neurodegener 16:5. [DOI] [PMC free article] [PubMed] [Google Scholar]
- Cheng Y, et al. (2018) Partial loss of psychiatric risk gene Mir137 in mice causes repetitive behavior and impairs sociability and learning via increased Pde10a. Nat Neurosci 21:1689–1703. 10.1038/s41593-018-0261-7 [DOI] [PMC free article] [PubMed] [Google Scholar]
- Chung WS, Barres BA (2012) The role of glial cells in synapse elimination. Curr Opin Neurobiol 22:438–445. 10.1016/j.conb.2011.10.003 [DOI] [PMC free article] [PubMed] [Google Scholar]
- Colonna M, Butovsky O (2017) Microglia function in the central nervous system during health and neurodegeneration. Annu Rev Immunol 35:441–468. 10.1146/annurev-immunol-051116-052358 [DOI] [PMC free article] [PubMed] [Google Scholar]
- Crawford DC, Acuña JM, Sherman SL (2001) FMR1 and the fragile X syndrome: human genome epidemiology review. Genet Med 3:359–371. 10.1097/00125817-200109000-00006 [DOI] [PMC free article] [PubMed] [Google Scholar]
- Cserép C, et al. (2020) Microglia monitor and protect neuronal function through specialized somatic purinergic junctions. Science 367:528–537. [DOI] [PubMed] [Google Scholar]
- Deacon RM (2006) Assessing nest building in mice. Nat Protoc 1:1117–1119. 10.1038/nprot.2006.170 [DOI] [PubMed] [Google Scholar]
- Dejanovic B, Huntley MA, De Mazière A, Meilandt WJ, Wu T, Srinivasan K, Jiang Z, Gandham V, Friedman BA, Ngu H, Foreman O, Carano RAD, Chih B, Klumperman J, Bakalarski C, Hanson JE, Sheng M (2018) Changes in the synaptic proteome in tauopathy and rescue of tau-induced synapse loss by C1q antibodies. Neuron 100:1322–1336.e7. 10.1016/j.neuron.2018.10.014 [DOI] [PubMed] [Google Scholar]
- Dere E, Dahm L, Lu D, Hammerschmidt K, Ju A, Tantra M, Kastner A, Chowdhury K, Ehrenreich H (2014) Heterozygous ambra1 deficiency in mice: a genetic trait with autism-like behavior restricted to the female gender. Front Behav Neurosci 8:181. [DOI] [PMC free article] [PubMed] [Google Scholar]
- Ding X, Wang J, Huang M, Chen Z, Liu J, Zhang Q, Zhang C, Xiang Y, Zen K, Li L (2021) Loss of microglial SIRPα promotes synaptic pruning in preclinical models of neurodegeneration. Nat Commun 12:2030. 10.1038/s41467-021-22301-1 [DOI] [PMC free article] [PubMed] [Google Scholar]
- Dong Z, Chen W, Chen C, Wang H, Cui W, Tan Z, Robinson H, Gao N, Luo B, Zhang L, Zhao K, Xiong WC, Mei L (2020) CUL3 deficiency causes social deficits and anxiety-like behaviors by impairing excitation-inhibition balance through the promotion of cap-dependent translation. Neuron 105:475–490.e6. 10.1016/j.neuron.2019.10.035 [DOI] [PMC free article] [PubMed] [Google Scholar]
- Dunkley PR, Jarvie PE, Robinson PJ (2008) A rapid Percoll gradient procedure for preparation of synaptosomes. Nat Protoc 3:1718–1728. 10.1038/nprot.2008.171 [DOI] [PubMed] [Google Scholar]
- Eichler SA, Meier JC (2008) E-I balance and human diseases - from molecules to networking. Front Mol Neurosci 1:2. [DOI] [PMC free article] [PubMed] [Google Scholar]
- Filipello F, et al. (2018) The microglial innate immune receptor TREM2 is required for synapse elimination and normal brain connectivity. Immunity 48:979–991.e8. 10.1016/j.immuni.2018.04.016 [DOI] [PubMed] [Google Scholar]
- Geschwind DH (2009) Advances in autism. Annu Rev Med 60:367–380. 10.1146/annurev.med.60.053107.121225 [DOI] [PMC free article] [PubMed] [Google Scholar]
- Gibson JR, Bartley AF, Hays SA, Huber KM (2008) Imbalance of neocortical excitation and inhibition and altered UP states reflect network hyperexcitability in the mouse model of fragile X syndrome. J Neurophysiol 100:2615–2626. 10.1152/jn.90752.2008 [DOI] [PMC free article] [PubMed] [Google Scholar]
- Giralt A, Coura R, Girault JA (2016) Pyk2 is essential for astrocytes mobility following brain lesion. Glia 64:620–634. 10.1002/glia.22952 [DOI] [PubMed] [Google Scholar]
- Guo T, Zhang D, Zeng Y, Huang TY, Xu H, Zhao Y (2020) Molecular and cellular mechanisms underlying the pathogenesis of Alzheimer's disease. Mol Neurodegener 15:40. [DOI] [PMC free article] [PubMed] [Google Scholar]
- Harris KM, Jensen FE, Tsao B (1992) Three-dimensional structure of dendritic spines and synapses in rat hippocampus (CA1) at postnatal day 15 and adult ages: implications for the maturation of synaptic physiology and long-term potentiation. J Neurosci 12:2685–2705. [DOI] [PMC free article] [PubMed] [Google Scholar]
- Heckmann BL, Teubner BJW, Tummers B, Boada-Romero E, Harris L, Yang M, Guy CS, Zakharenko SS, Green DR (2019) LC3-associated endocytosis facilitates β-amyloid clearance and mitigates neurodegeneration in murine Alzheimer's disease. Cell 178:536–551.e14. 10.1016/j.cell.2019.05.056 [DOI] [PMC free article] [PubMed] [Google Scholar]
- Henry CJ, Huang Y, Wynne AM, Godbout JP (2009) Peripheral lipopolysaccharide (LPS) challenge promotes microglial hyperactivity in aged mice that is associated with exaggerated induction of both pro-inflammatory IL-1beta and anti-inflammatory IL-10 cytokines. Brain Behav Immun 23:309–317. 10.1016/j.bbi.2008.09.002 [DOI] [PMC free article] [PubMed] [Google Scholar]
- Hong S, Dissing-Olesen L, Stevens B (2016) New insights on the role of microglia in synaptic pruning in health and disease. Curr Opin Neurobiol 36:128–134. 10.1016/j.conb.2015.12.004 [DOI] [PMC free article] [PubMed] [Google Scholar]
- Huber KM, Klann E, Costa-Mattioli M, Zukin RS (2015) Dysregulation of mammalian target of rapamycin signaling in mouse models of autism. J Neurosci 35:13836–13842. 10.1523/JNEUROSCI.2656-15.2015 [DOI] [PMC free article] [PubMed] [Google Scholar]
- Hutsler JJ, Zhang H (2010) Increased dendritic spine densities on cortical projection neurons in autism spectrum disorders. Brain Res 1309:83–94. 10.1016/j.brainres.2009.09.120 [DOI] [PubMed] [Google Scholar]
- Jadhav VS, Lin PBC, Pennington T, Di Prisco GV, Jannu AJ, Xu G, Moutinho M, Zhang J, Atwood BK, Puntambekar SS, Bissel SJ, Oblak AL, Landreth GE, Lamb BT (2020) Trem2 Y38C mutation and loss of Trem2 impairs neuronal synapses in adult mice. Mol Neurodegener 15:62. 10.1186/s13024-020-00409-0 [DOI] [PMC free article] [PubMed] [Google Scholar]
- Jawaid S, Kidd GJ, Wang J, Swetlik C, Dutta R, Trapp BD (2018) Alterations in CA1 hippocampal synapses in a mouse model of fragile X syndrome. Glia 66:789–800. 10.1002/glia.23284 [DOI] [PMC free article] [PubMed] [Google Scholar]
- Kim HJ, Cho MH, Shim WH, Kim JK, Jeon EY, Kim DH, Yoon SY (2017) Deficient autophagy in microglia impairs synaptic pruning and causes social behavioral defects. Mol Psychiatry 22:1576–1584. 10.1038/mp.2016.103 [DOI] [PMC free article] [PubMed] [Google Scholar]
- Kocaturk NM, Gozuacik D (2018) Crosstalk between mammalian autophagy and the ubiquitin-proteasome system. Front Cell Dev Biol 6:128. 10.3389/fcell.2018.00128 [DOI] [PMC free article] [PubMed] [Google Scholar]
- Krukowski K, Chou A, Feng X, Tiret B, Paladini MS, Riparip LK, Chaumeil MM, Lemere C, Rosi S (2018) Traumatic brain injury in aged mice induces chronic microglia activation, synapse loss, and complement-dependent memory deficits. Int J Mol Sci 19:3753. [DOI] [PMC free article] [PubMed] [Google Scholar]
- Kwon CH, Luikart BW, Powell CM, Zhou J, Matheny SA, Zhang W, Li Y, Baker SJ, Parada LF (2006) PTEN regulates neuronal arborization and social interaction in mice. Neuron 50:377–388. 10.1016/j.neuron.2006.03.023 [DOI] [PMC free article] [PubMed] [Google Scholar]
- Lai MC, Lombardo MV, Baron-Cohen S (2014) Autism. Lancet 383:896–910. 10.1016/S0140-6736(13)61539-1 [DOI] [PubMed] [Google Scholar]
- Lee KM, Hwang SK, Lee JA (2013) Neuronal autophagy and neurodevelopmental disorders. Exp Neurobiol 22:133–142. 10.5607/en.2013.22.3.133 [DOI] [PMC free article] [PubMed] [Google Scholar]
- Lin R, Zhou H, Diao X, Wang J, Feng R, Wen T (2021) A preliminary study on abnormal brain function and autistic behavior in mice caused by dcf1 deletion. Biochem Biophys Res Commun 579:29–34. 10.1016/j.bbrc.2021.09.056 [DOI] [PubMed] [Google Scholar]
- Liu Q, Shi J, Lin R, Wen T (2017) Dopamine and dopamine receptor D1 associated with decreased social interaction. Behav Brain Res 324:51–57. 10.1016/j.bbr.2017.01.045 [DOI] [PubMed] [Google Scholar]
- Liu Z, Ning J, Zheng X, Meng J, Han L, Zheng H, Zhong L, Chen XF, Zhang X, Luo H, Can D, Xu H, Zhang YW (2020) TMEM59 interacts with TREM2 and modulates TREM2-dependent microglial activities. Cell Death Dis 11:678. 10.1038/s41419-020-02874-3 [DOI] [PMC free article] [PubMed] [Google Scholar]
- Lui H, et al. (2016) Progranulin deficiency promotes circuit-specific synaptic pruning by microglia via complement activation. Cell 165:921–935. 10.1016/j.cell.2016.04.001 [DOI] [PMC free article] [PubMed] [Google Scholar]
- Magno L, Bunney TD, Mead E, Svensson F, Bictash MN (2021) TREM2/PLCγ2 signalling in immune cells: function, structural insight, and potential therapeutic modulation. Mol Neurodegener 16:22. 10.1186/s13024-021-00436-5 [DOI] [PMC free article] [PubMed] [Google Scholar]
- McInnes J, Wierda K, Snellinx A, Bounti L, Wang YC, Stancu IC, Apostolo N, Gevaert K, Dewachter I, Spires-Jones TL, De Strooper B, De Wit J, Zhou L, Verstreken P (2018) Synaptogyrin-3 mediates presynaptic dysfunction induced by tau. Neuron 97:823–835.e8. 10.1016/j.neuron.2018.01.022 [DOI] [PubMed] [Google Scholar]
- Meng J, Han L, Zheng N, Xu H, Liu Z, Zhang X, Luo H, Can D, Sun H, Xu H, Zhang YW (2020) TMEM59 haploinsufficiency ameliorates the pathology and cognitive impairment in the 5xFAD mouse model of Alzheimer's disease. Front Cell Dev Biol 8:596030. [DOI] [PMC free article] [PubMed] [Google Scholar]
- Nativel B, Ramin-Mangata S, Mevizou R, Figuester A, Andries J, Iwema T, Ikewaki N, Gasque P, Viranaïcken W (2019) CD93 is a cell surface lectin receptor involved in the control of the inflammatory response stimulated by exogenous DNA. Immunology 158:85–93. 10.1111/imm.13100 [DOI] [PMC free article] [PubMed] [Google Scholar]
- Neniskyte U, Gross CT (2017) Errant gardeners: glial-cell-dependent synaptic pruning and neurodevelopmental disorders. Nat Rev Neurosci 18:658–670. 10.1038/nrn.2017.110 [DOI] [PubMed] [Google Scholar]
- Nepomuceno RR, Tenner AJ (1998) C1qRP, the C1q receptor that enhances phagocytosis, is detected specifically in human cells of myeloid lineage, endothelial cells, and platelets. J Immunol 160:1929–1935. [PubMed] [Google Scholar]
- Nepomuceno RR, Ruiz S, Park M, Tenner AJ (1999) C1qRP is a heavily O-glycosylated cell surface protein involved in the regulation of phagocytic activity. J Immunol 162:3583–3589. [PubMed] [Google Scholar]
- Paolicelli RC, Bolasco G, Pagani F, Maggi L, Scianni M, Panzanelli P, Giustetto M, Ferreira TA, Guiducci E, Dumas L, Ragozzino D, Gross CT (2011) Synaptic pruning by microglia is necessary for normal brain development. Science 333:1456–1458. 10.1126/science.1202529 [DOI] [PubMed] [Google Scholar]
- Pape K, Tamouza R, Leboyer M, Zipp F (2019) Immunoneuropsychiatry - novel perspectives on brain disorders. Nat Rev Neurol 15:317–328. 10.1038/s41582-019-0174-4 [DOI] [PubMed] [Google Scholar]
- Park M, Tenner AJ (2003) Cell surface expression of C1qRP/CD93 is stabilized by O-glycosylation. J Cell Physiol 196:512–522. 10.1002/jcp.10332 [DOI] [PubMed] [Google Scholar]
- Peça J, Feng G (2012) Cellular and synaptic network defects in autism. Curr Opin Neurobiol 22:866–872. 10.1016/j.conb.2012.02.015 [DOI] [PMC free article] [PubMed] [Google Scholar]
- Peça J, Feliciano C, Ting JT, Wang W, Wells MF, Venkatraman TN, Lascola CD, Fu Z, Feng G (2011) Shank3 mutant mice display autistic-like behaviours and striatal dysfunction. Nature 472:437–442. 10.1038/nature09965 [DOI] [PMC free article] [PubMed] [Google Scholar]
- Presumey J, Bialas AR, Carroll MC (2017) Complement system in neural synapse elimination in development and disease. Adv Immunol 135:53–79. 10.1016/bs.ai.2017.06.004 [DOI] [PubMed] [Google Scholar]
- Ramaswami G, Geschwind DH (2018) Genetics of autism spectrum disorder. Handb Clin Neurol 147:321–329. 10.1016/B978-0-444-63233-3.00021-X [DOI] [PubMed] [Google Scholar]
- Rubenstein JL, Merzenich MM (2003) Model of autism: increased ratio of excitation/inhibition in key neural systems. Genes Brain Behav 2:255–267. 10.1034/j.1601-183x.2003.00037.x [DOI] [PMC free article] [PubMed] [Google Scholar]
- Schafer DP, Lehrman EK, Heller CT, Stevens B (2014) An engulfment assay: a protocol to assess interactions between CNS phagocytes and neurons. J Vis Exp (88):e51482. [DOI] [PMC free article] [PubMed] [Google Scholar]
- Sekar A, Bialas AR, de Rivera H, Davis A, Hammond TR, Kamitaki N, Tooley K, Presumey J, Baum M, Van Doren V, Genovese G, Rose SA, Handsaker RE; Schizophrenia Working Group of the Psychiatric Genomics Consortium, Daly MJ, Carroll MC, Stevens B, McCarroll SA (2016) Schizophrenia risk from complex variation of complement component 4. Nature 530:177–183. 10.1038/nature16549 [DOI] [PMC free article] [PubMed] [Google Scholar]
- Steinberger P, Szekeres A, Wille S, Stöckl J, Selenko N, Prager E, Staffler G, Madic O, Stockinger H, Knapp W (2002) Identification of human CD93 as the phagocytic C1q receptor (C1qRp) by expression cloning. J Leukoc Biol 71:133–140. [PubMed] [Google Scholar]
- Stevens B, Allen NJ, Vazquez LE, Howell GR, Christopherson KS, Nouri N, Micheva KD, Mehalow AK, Huberman AD, Stafford B, Sher A, Litke AM, Lambris JD, Smith SJ, John SW, Barres BA (2007) The classical complement cascade mediates CNS synapse elimination. Cell 131:1164–1178. 10.1016/j.cell.2007.10.036 [DOI] [PubMed] [Google Scholar]
- Suzuki K, Sugihara G, Ouchi Y, Nakamura K, Futatsubashi M, Takebayashi K, Yoshihara Y, Omata K, Matsumoto K, Tsuchiya KJ, Iwata Y, Tsujii M, Sugiyama T, Mori N (2013) Microglial activation in young adults with autism spectrum disorder. JAMA Psychiatry 70:49–58. 10.1001/jamapsychiatry.2013.272 [DOI] [PubMed] [Google Scholar]
- Tang G, Gudsnuk K, Kuo SH, Cotrina ML, Rosoklija G, Sosunov A, Sonders MS, Kanter E, Castagna C, Yamamoto A, Yue Z, Arancio O, Peterson BS, Champagne F, Dwork AJ, Goldman J, Sulzer D (2014) Loss of mTOR-dependent macroautophagy causes autistic-like synaptic pruning deficits. Neuron 83:1131–1143. 10.1016/j.neuron.2014.07.040 [DOI] [PMC free article] [PubMed] [Google Scholar]
- Tang S, Terzic B, Wang IJ, Sarmiento N, Sizov K, Cui Y, Takano H, Marsh ED, Zhou Z, Coulter DA (2019) Altered NMDAR signaling underlies autistic-like features in mouse models of CDKL5 deficiency disorder. Nat Commun 10:2655. 10.1038/s41467-019-10689-w [DOI] [PMC free article] [PubMed] [Google Scholar]
- Thion MS, Ginhoux F, Garel S (2018) Microglia and early brain development: an intimate journey. Science 362:185–189. 10.1126/science.aat0474 [DOI] [PubMed] [Google Scholar]
- Tremblay ME, Cookson MR, Civiero L (2019) Glial phagocytic clearance in Parkinson's disease. Mol Neurodegener 14:16. 10.1186/s13024-019-0314-8 [DOI] [PMC free article] [PubMed] [Google Scholar]
- Turner TN, Coe BP, Dickel DE, Hoekzema K, Nelson BJ, Zody MC, Kronenberg ZN, Hormozdiari F, Raja A, Pennacchio LA, Darnell RB, Eichler EE (2017) Genomic patterns of de novo mutation in simplex autism. Cell 171:710–722.e2. 10.1016/j.cell.2017.08.047 [DOI] [PMC free article] [PubMed] [Google Scholar]
- Wang J, Li J, Wang Q, Kong Y, Zhou F, Li Q, Li W, Sun Y, Wang Y, Guan Y, Wu M, Wen T (2018) Dcf1 deficiency attenuates the role of activated microglia during neuroinflammation. Front Mol Neurosci 11:256. 10.3389/fnmol.2018.00256 [DOI] [PMC free article] [PubMed] [Google Scholar]
- Wang T, et al. (2016) De novo genic mutations among a Chinese autism spectrum disorder cohort. Nat Commun 7:13316. 10.1038/ncomms13316 [DOI] [PMC free article] [PubMed] [Google Scholar]
- Wang X, et al. (2013) Loss of sorting nexin 27 contributes to excitatory synaptic dysfunction by modulating glutamate receptor recycling in Down's syndrome. Nat Med 19:473–480. 10.1038/nm.3117 [DOI] [PMC free article] [PubMed] [Google Scholar]
- Waye MMY, Cheng HY (2018) Genetics and epigenetics of autism: a review. Psychiatry Clin Neurosci 72:228–244. 10.1111/pcn.12606 [DOI] [PubMed] [Google Scholar]
- Yizhar O, Fenno LE, Prigge M, Schneider F, Davidson TJ, O'Shea DJ, Sohal VS, Goshen I, Finkelstein J, Paz JT, Stehfest K, Fudim R, Ramakrishnan C, Huguenard JR, Hegemann P, Deisseroth K (2011) Neocortical excitation/inhibition balance in information processing and social dysfunction. Nature 477:171–178. 10.1038/nature10360 [DOI] [PMC free article] [PubMed] [Google Scholar]
- Zhan Y, Paolicelli RC, Sforazzini F, Weinhard L, Bolasco G, Pagani F, Vyssotski AL, Bifone A, Gozzi A, Ragozzino D, Gross CT (2014) Deficient neuron-microglia signaling results in impaired functional brain connectivity and social behavior. Nat Neurosci 17:400–406. 10.1038/nn.3641 [DOI] [PubMed] [Google Scholar]
- Zhang W, Peterson M, Beyer B, Frankel WN, Zhang ZW (2014) Loss of MeCP2 from forebrain excitatory neurons leads to cortical hyperexcitation and seizures. J Neurosci 34:2754–2763. 10.1523/JNEUROSCI.4900-12.2014 [DOI] [PMC free article] [PubMed] [Google Scholar]
- Zhao D, Meng J, Zhao Y, Huo Y, Liu Y, Zheng N, Zhang M, Gao Y, Chen Z, Sun H, Wang X, Jing C, Zhang T, Zhang X, Luo H, Wang X, Zhang J, Liu FR, Li Y, Bu G, et al. (2019) RPS23RG1 is required for synaptic integrity and rescues Alzheimer's disease-associated cognitive deficits. Biol Psychiatry 86:171–184. 10.1016/j.biopsych.2018.08.009 [DOI] [PMC free article] [PubMed] [Google Scholar]
- Zheng Q, Zheng X, Zhang L, Luo H, Qian L, Fu X, Liu Y, Gao Y, Niu M, Meng J, Zhang M, Bu G, Xu H, Zhang YW (2017) The neuron-specific protein TMEM59L mediates oxidative stress-induced cell death. Mol Neurobiol 54:4189–4200. 10.1007/s12035-016-9997-9 [DOI] [PMC free article] [PubMed] [Google Scholar]
- Zhong L, Chen XF, Wang T, Wang Z, Liao C, Wang Z, Huang R, Wang D, Li X, Wu L, Jia L, Zheng H, Painter M, Atagi Y, Liu CC, Zhang YW, Fryer JD, Xu H, Bu G (2017) Soluble TREM2 induces inflammatory responses and enhances microglial survival. J Exp Med 214:597–607. 10.1084/jem.20160844 [DOI] [PMC free article] [PubMed] [Google Scholar]
Associated Data
This section collects any data citations, data availability statements, or supplementary materials included in this article.
Supplementary Materials
3D reconstruction for Iba1-CD68-PSD-95 from male 59fl/fl mice. Representative 3D surface reconstruction of Iba1+ microglia (green) containing CD68+ lysosomes (red) and engulfed PSD-95+ puncta (gray) in hippocampal CA1 region of male 59fl/fl mice (P19–P22). Scale bar: 10 µm.
3D reconstruction for Iba1-CD68-PSD-95 from male 59fl/fl;Lyz2 mice. Representative 3D surface reconstruction of Iba1+ microglia (green) containing CD68+ lysosomes (red) and engulfed PSD-95+ puncta (gray) in hippocampal CA1 region of male 59fl/fl;Lyz2 mice (P19–P22). Scale bar: 10 µm.
3D reconstruction for Iba1-CD68-PSD-95 from female 59fl/fl mice. Representative 3D surface reconstruction of Iba1+ microglia (green) containing CD68+ lysosomes (red) and engulfed PSD-95+ puncta (gray) in hippocampal CA1 region of female 59fl/fl mice (P19–P22). Scale bar: 10 µm.
3D reconstruction for Iba1-CD68-PSD-95 from female 59fl/fl;Lyz2 mice. Representative 3D surface reconstruction of Iba1+ microglia (green) containing CD68+ lysosomes (red) and engulfed PSD-95+ puncta (gray) in hippocampal CA1 region of female 59fl/fl;Lyz2 mice (P19–P22). Scale bar: 10 µm.