

Abstract
Habitat loss induced by climate warming is a major threat to biodiversity, particularly to threatened species. Understanding the genetic diversity and distributional responses to climate change of threatened species is critical to facilitate their conservation and management. Cupressus gigantea, a rare conifer found in the eastern Qinghai–Tibet Plateau (QTP) at 3000–3600 m.a.s.l., is famous for its largest specimen, the King Cypress, which is >55 m tall. Here, we obtained transcriptome data from 96 samples of 10 populations covering its whole distribution and used these data to characterize genetic diversity, identify conservation units, and elucidate genomic vulnerability to future climate change. After filtering, we identified 145,336, 26,103, and 2833 single nucleotide polymorphisms in the whole, putatively neutral, and putatively adaptive datasets, respectively. Based on the whole and putatively neutral datasets, we found that populations from the Yalu Tsangpo River (YTR) and Nyang River (NR) catchments could be defined as separate management units (MUs), due to distinct genetic clusters and demographic histories. Results of gradient forest models suggest that all populations of C. gigantea may be at risk due to the high expected rate of climate change, and the NR MU had a higher risk than the YTR MU. This study deepens our understanding of the complex evolutionary history and population structure of threatened tree species in extreme environments, such as dry river valleys above 3000 m.a.s.l. in the QTP, and provides insights into their susceptibility to global climate change and potential for adaptive responses.
Keywords: climate change, conservation units, genomic vulnerability, King Cypress, local adaptation, Qinghai–Tibetan Plateau
1. INTRODUCTION
Rapid climate change driven by human activities is one of the leading causes of global biodiversity loss in this new millennium (Thomas et al., 2004). Therefore, understanding how species will respond to future climate change and predicting their extinction risks are crucial if conservation biologists are to implement conservation efforts to protect threatened species (Brook et al., 2008; Cronk, 2016; Miraldo et al., 2016; Scheffers et al., 2016; Urban, 2015). To avoid climate‐driven extinction, species must (a) escape to suitable climatic conditions, (b) acclimate via phenotypic plasticity, or (c) adapt via natural selection based on standing genetic variation and/or new mutations. However, acclimation is limited in its effect, and rates of both mutation and migration seem unlikely to keep pace with ongoing climate change, especially for species with long lifespans, such as forest tree species (Bisbing et al., 2020; Dauphin et al., 2021). Therefore, standing adaptive variation in the gene pool is crucial for long‐lived species that face rapid climate change in the near future (Bragg et al., 2015; Du et al., 2020).
Populations living under heterogeneous conditions can adapt to local environments, and candidate genes that contribute to local adaptation are typically those that show strong environmental gradients (Coop et al., 2010) or high differentiation (e.g., F ST) between distinct habitats (Foll & Gaggiotti, 2008). Candidate gene identification was previously limited by the use of traditional molecular markers (e.g., allozymes or microsatellites), as these are mostly neutral and/or provide relatively few variable single nucleotide polymorphisms (SNPs) to detect selected signals. However, high‐throughput sequencing makes it possible to simultaneously identify thousands of SNPs associated with important traits, fitness, or environmental factors, providing new insights into population genetic mechanisms involved in local adaptation (Allendorf et al., 2010; Hohenlohe et al., 2020). Moreover, population genomic data can also address with high precision various important scientific questions concerning the conservation and management of threatened species, such as demographic history, population structure, genetic differentiation, and genetic diversity (Hohenlohe et al., 2020; Li et al., 2020, 2021).
Also advancing is modeling work that translates local adaptation‐related genomic data into spatial inferences about populations threatened by climate change (Capblancq et al., 2020; Fitzpatrick & Keller, 2015). Species distribution models (SDMs) are empirical modeling tools widely used to generate predictions about the potential distributions of populations and species under future climate change scenarios (Bakkenes et al., 2002; Guisan & Thuiller, 2005). However, these models are often criticized for their oversimplistic assumptions and for neglecting critical biological processes such as adaptation to rapid climate change via selection upon existing genetic and phenotypic variation (Alberto et al., 2013; Benito Garzón et al., 2019). To address this issue, recent studies have focused on the effects and distributions of potentially adaptive variation associated with climate, in order to predict and account for genomic mismatches between modern and future environments (Bay et al., 2018; Fitzpatrick & Keller, 2015; Jia et al., 2020; Zhao et al., 2020), especially for forest trees (Fitzpatrick & Keller, 2015; Jia et al., 2020; Zhao et al., 2020). Such emerging methods can be used to define the extent of nature reserves, identify populations that are most likely to become extinct, and help to mitigate the threat of climate change (Aitken & Bemmels, 2016; Bay et al., 2017; Fitzpatrick & Keller, 2015).
Cupressus giganteaW.C. Cheng & L.K. Fu was once considered to be a variety of C. torulosa D. Don [Cupressus torulosa D. Don var. gigantea (W.C. Cheng et L.K.); Farjon, 2005], is a rare conifer species with remarkable ecological, ornamental, and religious value, and is endemic to the eastern Qinghai–Tibet Plateau sensu lato where it is distributed in the Yalu Tsangpo River and Nyang River valleys. One famous individual, the King Cypress, stands >55 m tall and is >3000 years old; it forms a focal point in a very important sacred forest for Tibetans and attracts many tourists every year. The species is also of great ecological value because it is a keystone species in the Yalu Tsangpo River valley between 3000 and 3600 m.a.s.l. It is found in scattered stands or groves, with few large shrubs, surrounded by open dry scrubland that is often seasonally grazed. In addition, it occurs in sandy or stony fluvio‐glacial sediments or on slopes over limestone, usually on the east‐facing slopes of the valley, where it represents a unique adaptation to extreme environments (Zhou et al., 2019). However, human activity has disturbed and fragmented its range (Farjon, 2005; Zheng & Fu, 1978), and it is consequently listed as “Class I” on the Chinese National Protection List of Wild Plants (Liguo Fu & Chin, 1992) and “Vulnerable” on the IUCN Red List (Zhang et al., 2013). Previous studies have mainly focused on its biological characteristics, community structure, propagation techniques (Xin et al., 2019; Yang, 2015; Zhang, 2006), and phylogenetic relationships with congeners (Little, 2006; Mao et al., 2012; Terry et al., 2018). Its genetic diversity has been investigated, but only using traditional markers such as intersimple sequence repeat amplification (ISSR), random amplified polymorphic DNA (RAPD), simple sequence repeats (SSRs), and chloroplast DNA sequences (Fu et al., 2019; Lu et al., 2014; Xia et al., 2008; Xu et al., 2010). In addition, conifer genomes are usually of huge sizes with complex structures (>8 Gb; Nystedt et al., 2013; Scott et al., 2020), and whole‐genome resequencing is therefore not cost‐effective for population genomic analyses (Azaiez et al., 2018; De La Torre et al., 2014). Some strategies, such as reduced‐representation genome sequencing (Jia et al., 2020), exome sequencing (Neves et al., 2013), or RNA‐seq (Ru et al., 2018), have been used to reduce genome complexity and applied in conifer population genomics in recent decades. Among them, RNA‐seq has already been used to characterize gene family expansions of C. gigantea (Zhou et al., 2019) and to reveal adaptive introgression from this species to its congeners (Ma et al., 2019). Therefore, RNA sequencing and in‐depth analyses are shown to be powerful approaches when studying the evolution and conservation of C. gigantea.
In this study, we analyzed RNA sequences of 96 individuals from 10 populations of C. gigantea to address the following questions: (a) How did past climate history impact the demographic history of C. gigantea and shape its current genetic diversity and distribution pattern?; (b) Are there patterns of local adaptation, and how may the species respond to future climate change?; and (c) How many conservation units, which refers to a population of organisms that is considered distinct for purposes of conservation, are present in this species? These investigations provide a new case study on the conservation genomics of threatened species in high‐elevation environments and will shed light on their conservation and management in the face of climate change.
2. MATERIALS AND METHODS
2.1. Sampling and mRNA sequencing
Cupressus giganteais a narrow endemic conifer occurred in river valleys and hillsides in the middle reaches of the Yalu Tsangpo River and its tributary Niyang River in Southeast Tibet (Figure 1 and Figure S4). We collected fresh needle leaves from 96 C. gigantea individuals at 10 locations (Figure 1; Table S1). In addition, one individual of Juniperus microsperma and one C. funebris sampled in previous work (Ma et al., 2019) were used as outgroups. Fresh leaves were immediately placed into liquid nitrogen (below −80°C) before RNA extraction. Total RNA was isolated using the TRIzol Reagent (Life Technologies, Thermo Fisher Scientific, Waltham, MA, USA) and the RNeasy Kit (Qiagen, Hilden, Germany) according to the manufacturer's instructions. Prior to RNA fragmentation, poly(A) RNA was purified from total RNA using oligo(dT) magnetic beads. The QIAquick PCR Purification Kit (Qiagen) was used to synthesize and purify cDNA. RNA‐seq libraries were prepared and sequenced on the Illumina HiSeq X Ten platform to generate 150‐bp paired‐end raw reads. TRIMMOMATIC version 0.36 (Bolger et al., 2014) was used to trim and filter the raw reads, discarding adapter sequences, poly‐Ns, and low‐quality reads (Q < 30).
FIGURE 1.
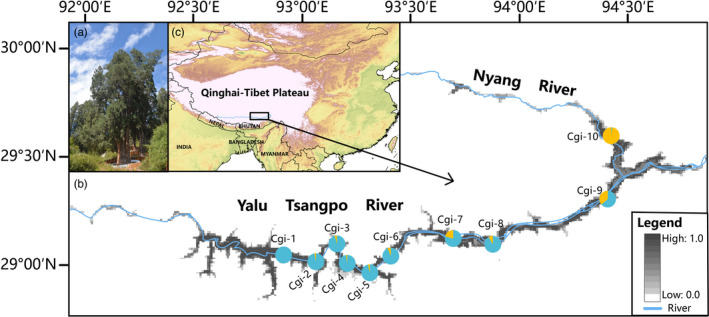
Geographic distribution of sampled Cupressus gigantea populations. (a) “The King Cypress”—the largest specimen of C. gigantea at Nyingchi, is estimated to be more than 3000 years old. (b) The geographic distribution of wild C. gigantea samples under the background of habitat suitability. (c) The location of the Qinghai–Tibet Plateau. Pie chart shows the ancestral composition of each population with K = 2 inferred from ADMIXTURE based on dataset Ⅰ, which contains all SNPs
2.2. Transcriptome de novo assembly, read mapping, and SNP calling
Clean reads from one C. gigantea individual were assembled into contigs using TRINITY version 2.8.5 (Haas et al., 2013) with default settings. Transcripts smaller than 200 bp were discarded, and the longest transcript for each gene was selected for the final assembly. CD‐HIT‐EST version 4.8.1 (Fu et al., 2012) was used to eliminate redundancies and produce unique genes (unigenes) for the final assembly. Subsequently, we removed sequences that were highly similar to contigs in the Microbial Genome Database (MBGD, http://mbgd.genome.ad.jp/; Uchiyama et al., 2010) and to any part of the complete chloroplast genome of C. gigantea (GenBank accession NC_028155.1; Li et al., 2016). Finally, a reference set of 61,597 unigenes was obtained (Table S3). We used BUSCO version 5.2.2 (Simão et al., 2015) to estimate transcriptome completeness, using the embryophyte conserved gene dataset (embryophyta_odb9) as the query databases, with default settings. TRANSDECODER version 5.5.0 (Haas et al., 2013) was used with default settings to predict the coding regions of the reference transcriptome. After obtaining candidate peptides, BLASTP was used to search for homology to known proteins via the UniProt Knowledgebase (UniProtKB) database, and the human‐readable descriptions for each gene were generated using AHRD version 3.3.3 (Hallab, 2015).
BWA‐MEM version 0.7.17 (Li & Durbin, 2009) was used with default parameters to align high‐quality reads from each C. gigantea individual and the two outgroup accessions to the reference transcriptome. We used SAMTOOLS version 1.9 (Li et al., 2009) to convert Sequence Alignment/Map (SAM) files to Binary Alignment/Map (BAM) files and to sort the BAM files. PICARD version 2.20.3 (Broad Institute, Cambridge, MA, USA; http://broadinstitute.github.io/picard/) was used to mark PCR duplicates. The RealignerTargetCreator and IndelRealigner tools in GATK version 3.7 (DePristo et al., 2011) were used to realign the regions around indels. Next, SNP calling was performed using the “mpileup” utility in SAMTOOLS version 1.9 with the parameters “‐q 20 ‐Q 20 ‐t AD,ADF,ADR,DP,SP.” (The parameter “AD,ADF,ADR,DP,SP” is interpreted as follows: “AD”: allelic depth, “ADF”: allelic depths on the forward strand, “ADR”: allelic depths on the reverse strand, “DP”: number of high‐quality bases, “SP”: Phred‐scaled strand bias p‐value.) Finally, SNPs within 5 bp from any indel were removed.
To satisfy the requirements of various analyses, three SNP datasets were created: a complete dataset (I), and subsets containing only putatively neutral (II) and adaptive (III) loci. For dataset Ⅰ (the complete dataset), SNPs with >50% missing data and a minor allele frequency (MAF) < 0.05 were removed using VCFTOOLS version 0.1.13 (Danecek et al., 2011). In addition, since conifer genomes are known to harbor complex architectures with a high proportion of repeated elements and paralogous genes, we used the program HDPlot (McKinney et al., 2017) to identify and remove putatively paralogous loci.
We used a perl script (Ru et al., 2018) to generate concatenated sequences for each individual, and only fourfold degenerate sites (4DTv) from dataset I were kept. Simultaneously, we used four methods to detect outlier SNPs based on dataset I. Two are F ST‐based methods: BAYESCAN version 2.1 (Beaumont & Balding, 2004; Foll & Gaggiotti, 2008) and R package PCADAPT version 4.3.3 (Luu et al., 2017; Oksanen et al., 2013). For BAYESCAN, we used 100 prior odds for the model, including 20 pilot runs, followed by 5000 iterations with an initial burn‐in of 50,000 iterations. To minimize false positives, we set the false discovery rate (FDR) to 0.05. For PCADAPT, outlier SNPs were detected with FDR < 0.05 using the QVALUE package in R (Dabney et al., 2010) based on K = 2. Another two are genotype–environment association (GEA) approaches: BAYESCENV (De Villemereuil & Gaggiotti, 2015) and a partial canonical redundancy analysis (RDA, (Legendre & Legendre, 2012)) using the R package VEGAN version 2.5.6 (Oksanen et al., 2013; see Section 7 for details). To create the putatively neutral dataset (dataset II), we excluded any outliers detected by BAYESCAN, PCADAPT, BAYESCENV or RDA. Based on all these analyses, dataset Ⅲ (the putatively adaptive dataset) contained the outliers detected by BAYESCAN, PCADAPT, BAYESCENV, or RDA. Dataset II was the 4DTv and excluded any outliers in the dataset Ⅲ based on dataset I.
2.3. Environmental data
A total of 19 bioclimatic variables (Table S2) were retrieved for current (1960–1990) and future (2100) periods at 2.5‐min resolution from the WorldClim database (https://www.worldclim.org/; Hijmans et al., 2005). For the future episodes, we calibrated and downscaled climatic projections representing two different future scenarios, SSP‐126 and SSP‐585, from the Sixth Phase of the Coupled Model Intercomparison Project (CMIP6) future climate projections. These reflected moderate and extreme conditions for 2100. All selected environmental layers were converted to the same resolution at grid cell size of 30″ × 30″ using ARCGIS version 10.7 (Environmental Systems Research Institute, Redlands, CA, http://www.esri.com). To avoid multicollinearity, we estimated correlation coefficients between each possible factor combination, then eliminated any factor that had a correlation coefficient greater than |0.8| with two or more other factors by calculating Pearson's correlation coefficient in R. We then randomly eliminated one out of each pair of correlated factors, ultimately retaining a subset of 4 uncorrelated BIOCLIM variables for further analysis: BIO3 (Isothermality), BIO5 (Max Temperature of the Warmest Month), BIO11 (Mean Temperature of the Coldest Quarter), and BIO15 (Precipitation Seasonality).
2.4. Genetic structure and phylogenetic inference
To detect evolutionary subdivisions of C. gigantea populations, we performed ADMIXTURE analysis based on the whole and putatively neutral datasets. The principal component analysis (PCA) was performed using all three datasets (Ⅰ‐Ⅲ). First, PLINK version 1.9 (Chang et al., 2015; Purcell et al., 2007) was used with the parameter “‐‐indep‐pairwise 50 5 0.4” to convert the input format to binary “ped” format and remove linkage disequilibrium sites. ADMIXTURE version 1.3.0 (Alexander & Lange, 2011) was used to estimate the population structure with K set to 1–8. The most likely value of K was determined by minimizing the cross‐validation error. In addition, PCA was performed using the smartpca program in EIGENSOFT version 6.1.4 (Price et al., 2006).
We conducted phylogenetic analysis using a subset of dataset II from which linkage disequilibrium sites had been removed. A maximum‐likelihood (ML) phylogenetic tree with 200 bootstrap replicates was constructed in RAxML version 8.2.9 (Stamatakis, 2014) with the GTR + GAMMA substitution model using J. microsperma and C. funebris as outgroups.
2.5. Indices of genetic diversity and population differentiation
Common measures of genetic diversity and differentiation were calculated for all datasets, considering only those eight populations with ≥5 individuals (Table S1). The nucleotide diversity (π) was calculated in VCFTOOLS version 0.1.13. Observed heterozygosity (H O), expected heterozygosity (H E), and the inbreeding coefficient (F IS) for each population were calculated using the R package HIERFSTAT version 0.5‐7 (Goudet et al., 2015). Percentage polymorphism (%Poly) was calculated in ARLEQUIN version 3.5.2 (Excoffier & Lischer, 2010). The number of private alleles (Ap) was calculated in the R package POPPR version 2.9.3 (Kamvar et al., 2014). Pairwise F ST between populations was calculated using VCFTOOLS version 0.1.13.
2.6. Demographic history
The FASTSIMCOAL2 program (FSC2; Excoffier et al., 2013) was used to infer divergence times and gene flow between C. gigantea lineages. We also used 4DTv sites for demographic inference to reduce the impact of natural selection. SNPs without MAF filtering were filtered to remove all missing data across all C. gigantea individuals. Furthermore, VCFTOOLS version 0.1.13 was used to exclude from all downstream analyses those SNPs that deviated (p < 0.001) from the Hardy–Weinberg equilibrium from all downstream analyses. We used the perl script vcf2maf.pl (https://github.com/wk8910/bio_tools/) to construct two‐dimensional joint site frequency spectra (2D‐SFS). Then, eight different evolutionary models (Figure S1) were designed and simulated in FSC2 based on the lineage delineation according to genetic structure. The Akaike information criterion (AIC) was used to determine the best model. Based on previous studies of Cupressus species (Ma et al., 2019), we set the average generation time to 50 years and the mutation rate to 7.0 × 10⁻⁹ per site per generation. Under the condition of 50 independent runs for each bootstrap, we used a parametric bootstrapping approach to construct 95% confidence intervals. In addition, we performed Stairway Plot analysis (Liu & Fu, 2015) to investigate how effective population size changed over time using the folded 1D‐SFS from 4DTv sequences.
2.7. Genomic signatures of selection and local adaptation
Two methods were used to measure the associations between all SNPs and climatic gradients: BAYESCENV (De Villemereuil & Gaggiotti, 2015) and redundancy analysis (RDA; Legendre & Legendre, 2012), representing univariate and multivariate GEA approaches, respectively. We used BAYESCENV to test for the sensitivity of each locus to environmental differentiation, using 20 pilot runs with 50,000 MCMC iterations each and an initial burn‐in of 50,000 iterations for each of the four environmental parameters. All other options were kept at the default settings.
RDA was used to explore associations between multilocus SNP. RDA is an analogue of multiple regression that allows simultaneous analysis of multivariate response data (Forester et al., 2018). Linear combinations of response variables (SNP loci) are referred to as RDA canonical axes, any of which are potentially causative, and each RDA axis is correlated with multiple predictor variables (climate variables).
Redundancy analysis and associated analyses were implemented in R using the VEGAN package version 2.5.6 (Oksanen et al., 2013). The four WorldClim climatic variables described above were included as explanatory variables in the analysis. We also checked for multicollinearity using variance inflation factors (VIFs). The value of VIF was <10 for all variables, and therefore, all variables were included in further analysis (James et al., 2013). In addition, RDA requires that the dataset does not have any missing data (i.e., missing SNP genotypes), so each gap in the data was filled with the most common genotype for that locus across individuals (Forester et al., 2018; Harrisson et al., 2017). We used the function “anova.cca” from the VEGAN package (999 permutations) to check the significance of our model through an ANOVA‐like permutation test, and all significant axes were considered to calculate outliers. Then, we determined which SNPs were candidates for local adaptation by identifying those present in the tails of a ±2.5 SD cutoff (two‐tailed p‐value = 0.012) on the SNP loadings to identify candidate SNPs (Carvalho et al., 2021). To identify the biological processes associated with the genes identified as candidates for GEA outliers, we performed a Gene Ontology (GO) enrichment analysis using the Bioconductor package TOPGO version 2.24.0 (Alexa & Rahnenführer, 2016).
2.8. Prediction of genomic vulnerability to future climate change
To describe the effect of environmental gradients more accurately on genetic variation and to identify spatial areas where gene–environment relationships are most likely to be disrupted by future climate changes, we used the gradient forest (GF) model to predict genetic compositions under future conditions using the R package GRADIENTFOREST (Ellis et al., 2012). GF is a flexible model that uses a machine‐learning regression tree approach to directly model the compositional turnover in genomic variation and efficiently accommodate nonlinear gene–environment relationships (Ellis et al., 2012; Fitzpatrick & Keller, 2015). We included only populations with ≥5 individuals to ensure robust regression, and we executed the GF model using the four uncorrelated BIOCLIM variables and the Moran's eigenvector map (MEM) (Borcard & Legendre, 2002; Dray et al., 2006), which represents the effects of spatial processes and unmeasured environmental variation. The MEM variables were calculated in the R package SPACEMAKER (Dray, 2013), and the SNP data were converted into minor allele frequencies per population. We used 500 regression trees per SNP to fit each GF model using default settings. Because false positives may be induced by rare alleles, we only included SNPs with MAF >10%. Also, to ameliorate some of the problems that arise from linkage, we retained only one SNP per contig for GF analyses. To visualize the results of the GF model across the entire distribution of C. gigantea, we created 10,000 random points and harvested BIOCLIM and MEM values.
“Genomic vulnerability,” termed “genetic offset” by Fitzpatrick and Keller (2015), is a measure of the mismatch between genotype and the future environment based on the current climate gradient. We extended the GF model to predict genomic vulnerability following Bay et al. (2018) and Fitzpatrick and Keller (2015). We evaluated the predicted genomic composition in 2100 under two shared socioeconomic pathway (SSP) scenarios, SSP‐126 and SSP‐585, which represent low and high greenhouse gas emission trajectories, respectively. We then calculated the Euclidian distance between current and future genetic compositions to identify genomic vulnerability, with the assumption that this correlates positively with the vulnerability of the population in the future. Finally, we mapped the Euclidian distance in geographic space to illustrate the distribution of C. gigantea populations.
3. RESULTS
3.1. Reference transcriptome assembly and SNP calling
The assembled reference transcriptome contained 61,597 unigenes with an average length of 904 bp and a contig N50 of 1837 bp (Table S3). The result of BUSCO quality assessments was 84.90%. A total of 26,072 unigenes were annotated using the Swiss‐Prot protein sequence database. After two F ST‐based methods, we found that PCADAPT identified 653 SNPs and BAYESCAN found 520 outlier SNPs. Two GEA methods identified 2833 outlier SNPs, 611 SNPs for BAYESCENV and 1759 SNPs for RDA (Figure S2). Under our parameter settings, three SNP datasets were obtained: (a) dataset Ⅰ (all SNPs, 145,336 SNPs), (b) dataset Ⅱ (putatively neutral dataset, 26,103 SNPs), and (c) dataset Ⅲ (putatively adaptive dataset, 2833 SNPs).
3.2. Population structure and phylogenetic hypothesis
ADMIXTURE analyses based on all SNPs (dataset I) and putatively neutral SNPs (dataset II) indicated that K = 2 (CV value = 0.54478 and 0.54674, respectively) was optimal (Figure 2a–b; Figure S3). In scenarios based on dataset I or II, Cgi‐10 was distinct from all other populations when K = 2. Therefore, there were two clear genetic lineages: the NR lineage comprising Cgi‐10 alone and the YTR lineage comprising all other populations.
FIGURE 2.
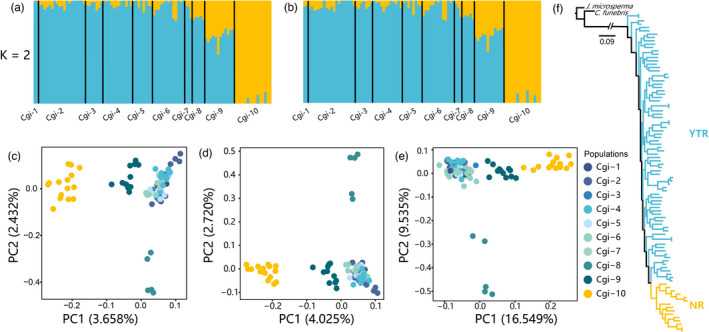
Population structure and phylogenetic inference of Cupressus gigantea. (a–b) Structure results, with different colors indicating different genetic backgrounds based on dataset Ⅰ (a) and dataset Ⅱ (b). (c–e) Results of the principal component analysis using dataset Ⅰ (c), dataset Ⅱ (d), and dataset Ⅲ (e). (f) A maximum‐likelihood phylogenetic tree based on 4DTv sites using dataset Ⅰ
The principal component analysis (PCA) revealed patterns similar to those obtained with ADMIXTURE. From datasets I and II, the first principal component (PC1, variance explained = 3.658% and 4.025%, respectively) clearly separated Cgi‐10 (NR lineage) from all other populations, although among the remaining populations (YTR lineage), Cgi‐9 was slightly separated from all others and approached Cgi‐10 slightly along PC1 (Figure 2c,d). In both datasets I and II, PC2 (2.432% and 2.720%, respectively) strongly separated Cgi‐8 from all other populations (Figure 2c,d). Within dataset III, both the PC1 and PC2 axes strongly separated Cgi‐8 from all other populations and also separated Cgi‐10 from populations 1–7, with Cgi‐9 intermediate again (Figure 2e). From all three datasets, populations 1–7 appeared completely intermixed along both axes (Figure 2c,d,e).
In the maximum‐likelihood tree of the ten populations, Cgi‐8 and Cgi‐10 were nested within the YTR lineage, although in each case, all individuals from these populations clustered together (Figure 2f).
3.3. Genetic diversity and population differentiation
Measures of genetic diversities had similar trends between dataset Ⅰ and Ⅱ (Table 1 and Table S4). Overall, most YTR populations had higher levels of diversity than the NR lineage (Cgi‐10), and within the YTR lineage, Cgi‐6 and Cgi‐4 had the highest diversity scores, including nucleotide diversity (π), observed heterozygosity (H O), and heterozygosity within populations (H E). Population Cgi‐8 had the lowest diversity scores across datasets Ⅰ and Ⅱ (Table 1 and Table S4), while in dataset III, it had the higher diversity scores than all other populations except Cgi‐10. Values of the inbreeding coefficient (F IS) ranged from −0.0283/−0.0392 (Cgi‐6) to −0.2324/−0.2350 (Cgi‐8) for datasets Ⅰ and Ⅱ and ranged from −0.3881 (Cgi‐8) to 0.0491 (Cgi‐2) for dataset Ⅲ (Table S4), indicating relatively low inbreeding in C. gigantea. The percentage polymorphism (%Poly) varied from 51.80/58.37% in Cgi‐9 to 62.58/68.11% in Cgi‐3 for datasets Ⅰ and Ⅱ and varied from 21.12% (Cgi‐2) to 55.91% (Cgi‐8) for dataset Ⅲ.
TABLE 1.
Measures of diversity and pairwise F ST for 96 Cupressus gigantea individuals from dataset Ⅰ
| Lineage | Population | N | π | H O | H E | F IS | %Poly | Ap | Pairwise F ST |
|---|---|---|---|---|---|---|---|---|---|
| YTR | Cgi‐2 | 19 | 0.0026 | 0.3321 | 0.3267 | −0.0381 | 57.28 | 18 | 0.0573 |
| Cgi‐3 | 7 | 0.0026 | 0.3249 | 0.3221 | −0.0878 | 62.58 | 0 | 0.0647 | |
| Cgi‐4 | 12 | 0.0027 | 0.3339 | 0.3326 | −0.0472 | 59.09 | 0 | 0.0600 | |
| Cgi‐5 | 8 | 0.0025 | 0.3296 | 0.3176 | −0.1016 | 62.08 | 0 | 0.0669 | |
| Cgi‐6 | 13 | 0.0054 | 0.3310 | 0.3321 | −0.0283 | 54.88 | 0 | 0.0559 | |
| Cgi‐8 | 5 | 0.0022 | 0.3288 | 0.2865 | −0.2324 | 59.11 | 0 | 0.1024 | |
| Cgi‐9 | 12 | 0.0051 | 0.3359 | 0.3225 | −0.0704 | 51.80 | 0 | 0.0502 | |
| All (comparing to NR) | 81 | 0.0054 | 0.3332 | 0.3333 | 0.0076 | 45.90 | 18 | 0.0488 | |
| NR | Cgi‐10 | 15 | 0.0049 | 0.3079 | 0.2997 | −0.0515 | 57.75 | 102 | – |
| All (comparing to YTR) | 15 | 0.0049 | 0.3079 | 0.2997 | −0.0515 | 57.75 | 102 | – | |
| ALL | ‐ | 96 | 0.0027 | 0.3313 | 0.3348 | 0.0194 | 43.57 | – | – |
In each column, warmer colors reflect higher values. N, number of individuals in the population; π, nucleotide diversity (calculated within variant loci); H O, observed heterozygosity; H E, heterozygosity within populations; F IS, inbreeding coefficient; %Poly, percentage of polymorphism; Ap, the number of private alleles; and Pairwise F ST, mean Weir and Cockerham's (1984) pairwise F ST relative to the NR lineage.
The F ST values between the YTR and NR lineages were 0.0488/0.0474/0.2199 for datasets Ⅰ–Ⅲ (Table 1 and Tables S4–S6). Cgi‐10 and Cgi‐8 had higher values of pairwise F ST (F ST = 0.1024/0.1017/0.3361), whereas Cgi‐10 and Cgi‐9 had the lowest F ST (F ST = 0.0502/0.0494/0.1444). In general, dataset III produced the highest F ST values.
3.4. Gene flow and population demography
We simulated eight candidate migration models to investigate the demographic history of C. gigantea based on the results described above. The best‐fitting model showed that the divergence between the NR and YTR lineages occurred approximately 0.649 million years ago (Ma) (Figure 3a; see Tables S7 and S8 for relative likelihood of candidate models, such as AIC values, and estimated demographic parameters of each model), and both lineages experienced sharp contractions in population size around 0.08 Ma. The estimated ancient gene flow was consistently higher from the YTR to the NR lineage than in the opposite direction, especially before 0.08 Ma when it was ca. 214 times higher, dropping to ~9 times lower between 0.08 Ma and the present.
FIGURE 3.
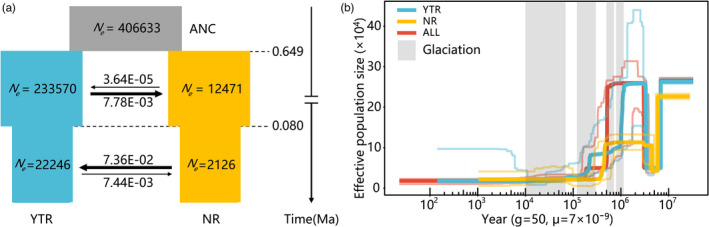
Demographic history of Cupressus gigantea. (a) Schematic diagram of demographic scenario modeled in FSC2. Estimated effective population sizes and divergence times are indicated. The numbers next to the arrows indicate the per generation migration rate between populations. (b) The detailed population demographic history of YTR, NR, and all C. gigantea individuals (ALL) over the past 10 million years based on the Stairway Plot method. The inferred effective size Ne of the C. gigantea population is plotted from present time (0) to the past. Thick lines represent the median, and thin light lines represent the 95% pseudo‐CI defined by the 2.5% and 97.5% estimates from the SFS analysis. The periods of the Xixiabangma Glaciation, the Naynayxungla Glaciation, the Guxiang Glaciation, and the Baiyu Glaciation are highlighted with gray vertical bars
We performed a Stairway Plot analysis for all SNPs based on dataset I and for the NR and YTR lineages alone. This analysis revealed slightly different demographic histories between YTR and NR (Figure 3b). All populations experienced a sharp decline in population size around 7 Ma, with recovery occurring ~4.5 Ma for NR and ~3 Ma for YTR and for the species as a whole (Figure 3b). The YTR lineage then experienced two further reductions in population size of about 1.2–0.8 Ma and 0.24–0.2 Ma, coinciding with the timing of the Xixiabangma and Guxiang Glaciations, respectively. The NR lineage experienced a sharp population contraction around 0.5 Ma at the end of the Naynayxungla Glaciation, after which it maintained an extremely small population size.
3.5. Genomic signatures of selection and local adaptation
Based on all SNPs, both BAYESCENV and RDA indicated a number of candidate loci with significant genotype‐by‐environment associations. BAYESCENV identified 611 (0.42% of 145,336 SNPs) outlier SNPs with q values <0.05. The most SNP associations were found for BIO15 (Precipitation Seasonality, 289 SNPs), followed by BIO5 (Max Temperature of the Warmest Month, 250 SNPs), BIO11 (Mean Temperature of the Coldest Quarter, 182 SNPs), and BIO3 (Isothermality, 174 SNPs; Table S9). RDA detected 1,759 (1.21%) significant associations between the environmental variables and the SNPs. One thousand and twelve SNPs (58.04%) were correlated most to BIO15, 627 SNPs (35.64%) most to BIO3, 67 SNPs (3.81%) most to BIO5, and 44 SNPs (2.51%) most to BIO11 in the RDA (Table S9). Combining the two methods, there were 60 outlier SNPs identified by both BAYESCENV and RDA, and 2310 outlier SNPs identified in total by either of the two methods. To address the potential functional relevance of the environment‐associated outlier genes, we conducted a functional annotation of the predicted gene sequences in the C. gigantea transcriptome reference. Among the 2310 environment‐associated outliers, GO categories could be assigned to 205 genes. Among these, we found that there were 28 categories to be significantly overrepresented (p < 0.01; Table S10). These categories represented a broad range of biological processes, such as stress response, metabolism, and ion and protein transport.
3.6. Spatial distribution of gene–environment associations and future genomic mismatch
We simulated the genomic change needed to track predicted climate change up until the year 2100 under two greenhouse gas scenarios (SSP‐126 and SSP‐585; Figure 4). We found that C. gigantea growing along the river bank had a lower genetic offset, but individuals that grew in the valley far from the bank suffered from higher genomic vulnerability, indicating that selection pressure due to climate would be higher. Moreover, the NR lineage had a higher genetic offset compared with YTR populations, indicating that individuals in the NR lineage may face more severe environmental selection pressure. Compared with all SNPs, we found that those showing adaptive variation were more susceptible to strong climate change. Finally, as the predicted climate becomes increasingly warm, the potential suitable habitat for C. gigantea became more threatened, and in the most extreme case (SSP‐585 2100), there was a high level of genomic vulnerability across almost the entire distribution range (Figure 4d).
FIGURE 4.
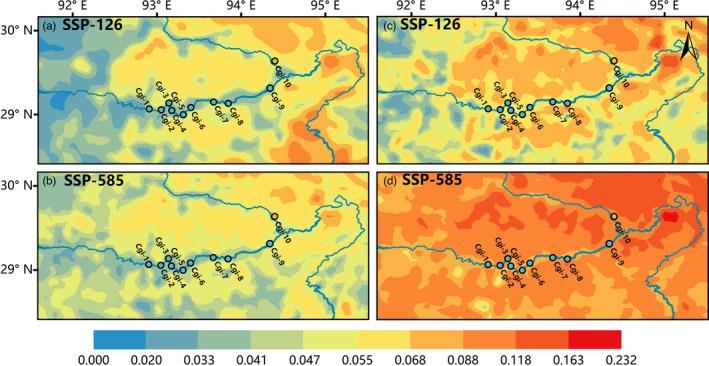
Prediction of genomic mismatch under future climate change for two shared socioeconomic pathways (SSPs) in 2100 based on the whole SNPs (a, b) and environment‐associated SNPs (c, d). Red and blue indicate high and low genomic mismatch, respectively. The circles represent the locations of Cupressus gigantea populations used in our study
4. DISCUSSION
We used up to 145,336 SNPs derived from next‐generation sequencing to survey the genetic diversity, population structure, demographic history, and potential response to future climate change of C. gigantea. This rare conifer occurs in the Yalu Tsangpo River valley (Figure S4) and is well known for its largest individual, the King Cypress. We found that the species' populations can be divided into two lineages, the YTR and NR lineages, each of which corresponds to an independent management unit (MU). The former comprises nine of the ten known populations, occupies a much wider distribution range, and exhibits higher genetic diversity. Based on current genetic–environmental associations and predictive climate modeling, we identified regions with high genetic offset in the C. gigantea distribution range and found that the population containing the King Cypress (Cgi‐10, NR) will be the most vulnerable to future climate change.
4.1. Demographic history and intraspecific divergence of Cupressus gigantea
Our analysis of demographic history using FSC2 revealed the divergence history of C. gigantea populations (Figure 3a). The divergence between YTR and NR occurred 0.649 Ma, coinciding with the Naynayxungla Glaciation (0.72–0.50 Ma) on the Qinghai–Tibet Plateau s.l. (Zheng et al., 2002). Thus, the genetic differentiation between YTR and NR lineages likely reflects regional climate fluctuations, which may have generated a gene flow barrier between them. Similar patterns of intraspecific differentiation have been observed in other Qinghai–Tibet Plateau endemic species, such as C. chengiana (Li, et al., 2020, 2021, Aconitum gymnandrum (Wang et al., 2009), and Eospalax baileyi (Tang et al., 2010).
Meanwhile, C. gigantea experienced a demographic history that included multiple bottleneck events. According to the Stairway Plot (Figure 3b), C. gigantea populations experienced three bottlenecks that occurred at about 7, 0.5, and 0.2 Ma. The periods of effective population size (Ne ) reduction preceding these coincided respectively with the decline in atmospheric surface air temperature during the late Miocene (Sun & An, 2005), the development of the Naynayxungla Glaciation (0.72–0.50 Ma), and the Guxiang Glaciation (ca. 0.30–0.13 Ma; Zheng et al., 2002). This suggests that the periods of population contractions in C. gigantea were associated with paleoclimatic changes during the Miocene and Pleistocene. Nevertheless, it is important to bear in mind that the accuracy of Stairway Plot analysis (Figure 3b) in detecting bottlenecks may decay at deeper evolutionary timescales (Liu & Fu, 2015). The slightly different demographic trajectories of YTR and NR may be attributed to the effects of interacting factors such as ecology, local topography, and geological history on the species' response to climate change (Avise, 2000; Hewitt, 1996, 2000, 2004; Scheffers et al., 2016). However, consistent with Ma et al. (2019), the effective population sizes of both YTR and NR lineages have declined to relatively low levels compared with those of other wind‐pollinated tree species, causing a higher relative risk of extinction in C. gigantea (Hutchings, 2015). Another hypothesis for the reduction in effective population size is that low genetic diversity of C. gigantea (Table 1, Tables S4 and S5) may have reduced the species' ability to adapt and survive during short‐ and long‐term environmental changes (Allendorf et al., 2010; Ellstrand & Elam, 1993; Hamilton, 2011; Lande et al., 1999).
4.2. Local adaptation of Cupressus gigantea populations
In addition to the history of divergence and demographic changes, environmental factors might have also contributed to the current genomic structure of C. gigantea. We used both univariate and multivariate methods to detect the selection characteristics related to climate change across the range of C. gigantea. Significant environment‐associated SNPs were detected in candidate genes chosen a priori based on broad functional categories, and also in random fragments with retrieved functional annotations (Table S10). We potentially identified 2310 candidate loci under selection (detected by BAYESCENV or RDA), of which 205 are within functional genes annotated in the C. gigantea transcriptome. Climate variables related to temperature and precipitation limit the survival, growth, and productivity of many forest tree species (Peterson & Peterson, 2001). Of the climate variables included in the BAYESCENV, Precipitation Seasonality (32.29%) and Max Temperature of the Warmest Month (27.93%) explained the most variance in SNP genotypes. The multivariate gene association methods identified 1759 outlier SNPs, of which 58.04% were related to Precipitation Seasonality. The GO enrichment analyses suggested that these outliers were significantly (p < 0.01) enriched in many categories related to stress responses, such as response to singlet oxygen (GO: 0000304), reactive oxygen species (GO: 0000302), hypoxia (GO: 0001666), and light stimulus (GO: 0009416). In addition, ion transport (GO: 0006811), tissue development (GO: 0009888), MAPK cascade (GO: 0000165), and ethylene biosynthetic process (GO: 0009693) were also enriched, which might have contributed to abiotic stress responses and phytohormone treatments. However, we emphasize that our study is only able to detect loci potentially associated with climate variables, while the actual agents and targets of selection need to be rigorously established through manipulation experiments.
4.3. Climate‐driven genomic vulnerability
Understanding the genetic basis of adaptation to climate change remains still a very important task (Capblancq et al., 2020). Based on current genetic–environmental associations, we attempted to assess which populations would be most vulnerable to future climate change. We used the method of Fitzpatrick and Keller (2015), which has been applied to a variety of species (Bay et al., 2018; Vranken et al., 2021; Zhao et al., 2020), to calculate the mismatch between genotypes and future predicted environments using an extension of the gradient forest (GF) analysis. The populations with the highest degree of mismatch are least likely to adapt rapidly to climate change, and this may lead to decline or extinction (Bay et al., 2018).
Further GF analysis revealed a clear signal of potential risk for C. gigantea populations under global climate change, especially with regard to adaptive variation (Figure 4). The genetic mismatch is much higher in the northeastern populations, particularly Cgi‐10 (the NR population), which have relatively lower genetic diversity and the highest differentiation relative to the other populations. Populations in these high‐risk regions will need to adapt more quickly to keep pace with the rapidly changing climate. However, like other conifers, C. gigantea has a long lifespan and generation time; these characteristics often lead to slower adaptation in response to rapid climate changes (Zhao et al., 2020). Because the Cgi‐10 population has experienced severe bottlenecks that have caused a very small effective population size, and given the low mutation rate in conifers (De La Torre et al., 2017), persistence of this population in situ in the context of global climate change seems a formidable challenge. The largest and most famous C. gigantea individual, the King Cypress, is located in Cgi‐10, and future climate change appears to pose a severe threat to the entire population and this specific individual.
The genomic vulnerability predicted here for C. gigantea is greater than that of the widely distributed Platycladus orientalis (Jia et al., 2020) and Pinus densata (Zhao et al., 2020), and indicates that climate change will likely exceed its adaptive capacity. Jia et al. (2020) showed that P. orientalis populations in the southern and northern margins would face more severe challenges. By contrast, the mismatch is higher in western P. densata populations where differentiation (relative to other populations) is highest and genetic diversity lowest according to Zhao et al. (2020). Our results showed that within its distribution range, areas far away from river channels were not suitable for C. gigantea survival, meaning that the species will most likely survive only in river channels. On a whole, in situ persistence of many C. gigantea populations will be a significant challenge under future climate regimes, especially for Cgi‐10.
However, although our results may provide new insight into how C. gigantea will respond to future climate changes, we would like to warn the readers that genomic predictions of climate (mal)adaptation, as we have conducted here, are still in their infancy and face numerous challenges and uncertainties that await further investigation (Capblancq et al., 2020).
4.4. Delineation of conservation units and conservation implications
Given the importance of genetic diversity for natural populations, especially for species that are already endangered or patchily distributed with limited dispersal ability, one of the most important current challenges is maximizing the species' evolutionary potential by delineating appropriate conservation units (CUs) before developing conservation strategies (Barbosa et al., 2018; Funk et al., 2012; Liu et al., 2020). The characterization of CUs can now benefit from greater information on species' natural and adaptive variation revealed by genomic data, and further categories are recognized: (a) evolutionarily significant units (ESUs), which are monophyletic (all individuals share a common ancestor) lineages that have experienced independent evolutionary history from, but no recent gene flow with, other ESUs; (b) management units (MUs), that is, groups of populations that are demographically independent; and (c) adaptive units (AUs), which reflect adaptive differentiation related to landscape and climate (Barbosa et al., 2018; Funk et al., 2012).
In the present study, similar patterns were detected based on all SNPs and on putatively neutral SNPs, whereas the results from the dataset of candidate positively selected SNPs were different. Based on the putatively neutral dataset, ADMIXTURE, PCA, and phylogenetic analyses revealed the existence of two genetic lineages (NR and YTR) in C. gigantea (Figure 2), corresponding to populations Cgi‐10 from the Nyang River valley, and nine populations from Yalu Tsangpo River valley, respectively. In addition, coalescent analysis suggested that the two lineages have different demographic histories. All these lines of evidence suggest that there are two MUs, the YTR and the NR (Barbosa et al., 2018; de Guia & Saitoh, 2007; Funk et al., 2012). Hence, two CUs can be recognized, but we caution that our identification of NR MU is based on a limited sampling size (Table S1), and future population genomic surveys with more samples from these two populations are needed to confirm our findings.
The appropriate delineation of effective CUs is the most important basis for successful biological conservation (Li & Ge, 2002), and each of the two CUs comprising C. gigantea faces different conservation issues. We therefore recommend that the threatened status of each CU should be assessed independently. According to our genetic–climatic association analysis based on GF models, the northeastern populations have a higher genetic offset, meaning that the NR MU is the most vulnerable in the face of climate change. Similarly, Zheng et al. (2007) found that populations of C. gigantea near the Nyang River are at the stage of population aging and that populations in the area where the Yalu Tsangpo River meets its tributary the Nyang River are also gradually shrinking in size. In view of these observations, we believe that the NR MU should be considered as a higher priority CU. Compared with other populations, the YTR MU is relatively safe, as it has higher genetic diversity, lower population differentiation, a larger estimated Ne , a lower genetic offset, and a stable age structure (Zheng et al., 2007).
In its native range in southeastern Tibet, C. gigantea has significant ecological value, but its range has become fragmented and highly restricted near the arid or semiarid valley in the middle reaches of the Yalu Tsangpo River and its tributary the Nyang River. Our study highlights the potential factors that put C. gigantea populations at risk. Specifically, three bottlenecks caused by intensive historical climate change events have led to the loss of genetic diversity and declines in effective population size. Moreover, Wang et al. (2005) have proposed that the internal factor of low seed vigor and the external factor of severe seed injury by diseases, birds, and mice have increased its vulnerability to extinction. We propose that both in situ and ex situ conservation approaches should be applied to this species. Each CU should be given independent in situ conservation and management. In addition, ex situ conservation measures such as assisted migration, seedling orchard establishment, and seed storage should be seriously considered for the whole distribution range and all conservation units.
CONFLICT OF INTEREST
None declared.
Supporting information
Supplementary Material
ACKNOWLEDGMENTS
This study was funded by the National Natural Science Foundation of China (grant numbers U20A2080 and 31622015); the Second Tibetan Plateau Scientific Expedition and Research (STEP) program (2019QZKK05020110); and Sichuan University (Fundamental Research Funds for the Central Universities, SCU2021D006 and SCU2020D003).
Yang, H. , Li, J. , Milne, R. I. , Tao, W. , Wang, Y. , Miao, J. , Wang, W. , Ju, T. , Tso, S. , Luo, J. , & Mao, K. (2022). Genomic insights into the genotype–environment mismatch and conservation units of a Qinghai–Tibet Plateau endemic cypress under climate change. Evolutionary Applications, 15, 919–933. 10.1111/eva.13377
Heng Yang and Jialiang Li contributed equally to this work.
Contributor Information
Jian Luo, Email: luojian@xza.edu.cn.
Kangshan Mao, Email: maokangshan@163.com.
DATA AVAILABILITY STATEMENT
The transcriptome sequencing data have been deposited in National Genomics Data Center (https://bigd.big.ac.cn/) under BioProject: PRJCA006268.
REFERENCES
- Aitken, S. N. , & Bemmels, J. B. (2016). Time to get moving: Assisted gene flow of forest trees. Evolutionary Applications, 9(1), 271–290. 10.1111/eva.12293 [DOI] [PMC free article] [PubMed] [Google Scholar]
- Alberto, F. J. , Aitken, S. N. , Alía, R. , González‐Martínez, S. C. , Hänninen, H. , Kremer, A. , Lefèvre, F. , Lenormand, T. , Yeaman, S. , Whetten, R. , & Savolainen, O. (2013). Potential for evolutionary responses to climate change‐evidence from tree populations. Global Change Biology, 19(6), 1645–1661. 10.1111/gcb.12181 [DOI] [PMC free article] [PubMed] [Google Scholar]
- Alexa, A. , & Rahnenführer, J. (2016). Gene set enrichment analysis with topGO. R package version 2.24.0. http://www.bioconductor.org/packages/release/bioc/html/topGO.html [Google Scholar]
- Alexander, D. H. , & Lange, K. (2011). Enhancements to the ADMIXTURE algorithm for individual ancestry estimation. BMC Bioinformatics, 12(1), 246. 10.1186/1471-2105-12-246 [DOI] [PMC free article] [PubMed] [Google Scholar]
- Allendorf, F. W. , Hohenlohe, P. A. , & Luikart, G. (2010). Genomics and the future of conservation genetics. Nature Reviews Genetics, 11(10), 697–709. 10.1038/nrg2844 [DOI] [PubMed] [Google Scholar]
- Avise, J. C. (2000). Phylogeography: The history and formation of species. Harvard University Press. [Google Scholar]
- Azaiez, A. , Pavy, N. , Gérardi, S. , Laroche, J. , Boyle, B. , Gagnon, F. , Mottet, M. J. , Beaulieu, J. , & Bousquet, J. (2018). A catalog of annotated high‐confidence SNPs from exome capture and sequencing reveals highly polymorphic genes in Norway spruce (Picea abies). BMC Genomics, 19(1), 1–13. 10.1186/s12864-018-5247-z [DOI] [PMC free article] [PubMed] [Google Scholar]
- Bakkenes, M. , Alkemade, J. R. M. , Ihle, F. , Leemans, R. , & Latour, J. B. (2002). Assessing effects of forecasted climate change on the diversity and distribution of European higher plants for 2050. Global Change Biology, 8(4), 390–407. 10.1046/j.1354-1013.2001.00467.x [DOI] [Google Scholar]
- Barbosa, S. , Mestre, F. , White, T. A. , Paupério, J. , Alves, P. C. , & Searle, J. B. (2018). Integrative approaches to guide conservation decisions: Using genomics to define conservation units and functional corridors. Molecular Ecology, 27(17), 3452–3465. 10.1111/mec.14806 [DOI] [PubMed] [Google Scholar]
- Bay, R. A. , Harrigan, R. J. , Le Underwood, V. , Gibbs, H. L. , Smith, T. B. , & Ruegg, K. (2018). Genomic signals of selection predict climate‐driven population declines in a migratory bird. Science, 359(6371), 83–86. 10.1126/science.aan4380 [DOI] [PubMed] [Google Scholar]
- Bay, R. A. , Rose, N. , Barrett, R. , Bernatchez, L. , Ghalambor, C. K. , Lasky, J. R. , Brem, R. B. , Palumbi, S. R. , & Ralph, P. (2017). Predicting responses to contemporary environmental change using evolutionary response architectures. The American Naturalist, 189(5), 463–473. 10.1086/691233 [DOI] [PubMed] [Google Scholar]
- Beaumont, M. A. , & Balding, D. J. (2004). Identifying adaptive genetic divergence among populations from genome scans. Molecular Ecology, 13(4), 969–980. 10.1111/j.1365-294X.2004.02125.x [DOI] [PubMed] [Google Scholar]
- Benito Garzón, M. , Robson, T. M. , & Hampe, A. (2019). ΔTrait SDMs: Species distribution models that account for local adaptation and phenotypic plasticity. New Phytologist, 222(4), 1757–1765. 10.1111/nph.15716 [DOI] [PubMed] [Google Scholar]
- Bisbing, S. M. , Urza, A. K. , Buma, B. J. , Cooper, D. J. , Matocq, M. , Angert, A. L. , & Lambrinos, J. (2020). Can long‐lived species keep pace with climate change? Evidence of local persistence potential in a widespread conifer. Diversity and Distributions, 27(2), 296–312. 10.1111/ddi.13191 [DOI] [Google Scholar]
- Bolger, A. M. , Lohse, M. , & Usadel, B. (2014). Trimmomatic: A flexible trimmer for Illumina sequence data. Bioinformatics, 30(15), 2114–2120. 10.1093/bioinformatics/btu170 [DOI] [PMC free article] [PubMed] [Google Scholar]
- Borcard, D. , & Legendre, P. (2002). All‐scale spatial analysis of ecological data by means of principal coordinates of neighbour matrices. Ecological Modelling, 153(1–2), 51–68. 10.1016/S0304-3800(01)00501-4 [DOI] [Google Scholar]
- Bragg, J. G. , Supple, M. A. , Andrew, R. L. , & Borevitz, J. O. (2015). Genomic variation across landscapes: Insights and applications. New Phytologist, 207(4), 953–967. 10.1111/nph.13410 [DOI] [PubMed] [Google Scholar]
- Brook, B. W. , Sodhi, N. S. , & Bradshaw, C. J. A. (2008). Synergies among extinction drivers under global change. Trends in Ecology & Evolution, 23(8), 453–460. 10.1016/j.tree.2008.03.011 [DOI] [PubMed] [Google Scholar]
- Capblancq, T. , Fitzpatrick, M. C. , Bay, R. A. , Exposito‐Alonso, M. , & Keller, S. R. (2020). Genomic prediction of (mal) adaptation across current and future climatic landscapes. Annual Review of Ecology, Evolution, and Systematics, 51, 245–269. 10.1146/annurev-ecolsys-020720-042553 [DOI] [Google Scholar]
- Carvalho, C. S. , Forester, B. R. , Mitre, S. K. , Alves, R. , Imperatriz‐Fonseca, V. L. , Ramos, S. J. , Resende‐Moreira, L. C. , Siqueira, J. O. , Trevelin, L. C. , Caldeira, C. F. , Gastauer, M. , & Jaffé, R. (2021). Combining genotype, phenotype, and environmental data to delineate site‐adjusted provenance strategies for ecological restoration. Molecular Ecology Resources, 21(1), 44–58. 10.1111/1755-0998.13191 [DOI] [PubMed] [Google Scholar]
- Chang, C. C. , Chow, C. C. , Tellier, L. C. A. M. , Vattikuti, S. , Purcell, S. M. , & Lee, J. J. (2015). Second‐generation PLINK: Rising to the challenge of larger and richer datasets. Gigascience, 4(1), s13742–s13015. 10.1186/s13742-015-0047-8 [DOI] [PMC free article] [PubMed] [Google Scholar]
- Coop, G. , Witonsky, D. , Di Rienzo, A. , & Pritchard, J. K. (2010). Using environmental correlations to identify loci underlying local adaptation. Genetics, 185(4), 1411. 10.1534/genetics.110.114819 [DOI] [PMC free article] [PubMed] [Google Scholar]
- Cronk, Q. (2016). Plant extinctions take time. Science, 353(6298), 446–447. 10.1126/science.aag1794 [DOI] [PubMed] [Google Scholar]
- Dabney, A. , Storey, J. D. , & Warnes, G. R. (2010). qvalue: Q‐value estimation for false discovery rate control. R package version, 2.20.0. https://rdrr.io/bioc/qvalue/ [Google Scholar]
- Danecek, P. , Auton, A. , Abecasis, G. , Albers, C. A. , Banks, E. , DePristo, M. A. , Handsaker, R. E. , Lunter, G. , Marth, G. T. , Sherry, S. T. , McVean, G. , & Durbin, R. (2011). The variant call format and VCFtools. Bioinformatics, 27(15), 2156–2158. 10.1093/bioinformatics/btr330 [DOI] [PMC free article] [PubMed] [Google Scholar]
- Dauphin, B. , Rellstab, C. , Schmid, M. , Zoller, S. , Karger, D. N. , Brodbeck, S. , Guillaume, F. , & Gugerli, F. (2021). Genomic vulnerability to rapid climate warming in a tree species with a long generation time. Global Change Biology, 27(6), 1181–1195. 10.1111/gcb.15469 [DOI] [PubMed] [Google Scholar]
- de Guia, A. P. O. , & Saitoh, T. (2007). The gap between the concept and definitions in the Evolutionarily Significant Unit: The need to integrate neutral genetic variation and adaptive variation. Ecological Research, 22(4), 604–612. 10.1007/s11284-006-0059-z [DOI] [Google Scholar]
- De La Torre, A. R. , Birol, I. , Bousquet, J. , Ingvarsson, P. K. , Jansson, S. , Jones, S. J. M. , Keeling, C. I. , MacKay, J. , Nilsson, O. , Ritland, K. , Street, N. , Yanchuk, A. , Zerbe, P. , & Bohlmann, J. (2014). Insights into conifer giga‐genomes. Plant Physiology, 166(4), 1724–1732. 10.1104/pp.114.248708 [DOI] [PMC free article] [PubMed] [Google Scholar]
- De La Torre, A. R. , Li, Z. , Van de Peer, Y. , & Ingvarsson, P. K. (2017). Contrasting rates of molecular evolution and patterns of selection among gymnosperms and flowering plants. Molecular Biology and Evolution, 34(6), 1363–1377. 10.1093/molbev/msx069 [DOI] [PMC free article] [PubMed] [Google Scholar]
- De Villemereuil, P. , & Gaggiotti, O. E. (2015). A new F ST‐based method to uncover local adaptation using environmental variables. Methods in Ecology and Evolution, 6(11), 1248–1258. 10.1111/2041-210X.12418 [DOI] [Google Scholar]
- DePristo, M. A. , Banks, E. , Poplin, R. , Garimella, K. V. , Maguire, J. R. , Hartl, C. , Philippakis, A. A. , del Angel, G. , Rivas, M. A. , Hanna, M. , McKenna, A. , Fennell, T. J. , Kernytsky, A. M. , Sivachenko, A. Y. , Cibulskis, K. , Gabriel, S. B. , Altshuler, D. , & Daly, M. J. (2011). A framework for variation discovery and genotyping using next‐generation DNA sequencing data. Nature Genetics, 43(5), 491. 10.1038/ng.806 [DOI] [PMC free article] [PubMed] [Google Scholar]
- Dray, S. (2013). SpacemakeR: Spatial modelling. R package version 0.0‐5. https://r‐forge.r‐project.org/R/?group_id=195 [Google Scholar]
- Dray, S. , Legendre, P. , & Peres‐Neto, P. R. (2006). Spatial modelling: A comprehensive framework for principal coordinate analysis of neighbour matrices (PCNM). Ecological Modelling, 196(3–4), 483–493. 10.1016/j.ecolmodel.2006.02.015 [DOI] [Google Scholar]
- Du, F. K. , Wang, T. R. , Wang, Y. Y. , Ueno, S. , & de Lafontaine, G. (2020). Contrasted patterns of local adaptation to climate change across the range of an evergreen oak, Quercus aquifolioides . Evolutionary Applications, 13(9), 2377–2391. 10.1111/eva.13030 [DOI] [PMC free article] [PubMed] [Google Scholar]
- Ellis, N. , Smith, S. J. , & Pitcher, C. R. (2012). Gradient forests: Calculating importance gradients on physical predictors. Ecology, 93(1), 156–168. 10.1890/11-0252.1 [DOI] [PubMed] [Google Scholar]
- Ellstrand, N. C. , & Elam, D. R. (1993). Population genetic consequences of small population size: Implications for plant conservation. Annual Review of Ecology and Systematics, 24(1), 217–242. 10.1146/annurev.es.24.110193.001245 [DOI] [Google Scholar]
- Excoffier, L. , Dupanloup, I. , Huerta‐Sánchez, E. , Sousa, V. C. , & Foll, M. (2013). Robust demographic inference from genomic and SNP data. PLoS Genetics, 9(10), e1003905. 10.1371/journal.pgen.1003905 [DOI] [PMC free article] [PubMed] [Google Scholar]
- Excoffier, L. , & Lischer, H. E. L. (2010). Arlequin suite ver 3.5: A new series of programs to perform population genetics analyses under Linux and Windows. Molecular Ecology Resources, 10(3), 564–567. 10.1111/j.1755-0998.2010.02847.x [DOI] [PubMed] [Google Scholar]
- Farjon, A. (2005). Monograph of Cupressaceae and Sciadopitys. Royal Botanic Gardens, Kew. [Google Scholar]
- Fitzpatrick, M. C. , & Keller, S. R. (2015). Ecological genomics meets community‐level modelling of biodiversity: Mapping the genomic landscape of current and future environmental adaptation. Ecology Letters, 18(1), 1–16. 10.1111/ele.12376 [DOI] [PubMed] [Google Scholar]
- Foll, M. , & Gaggiotti, O. (2008). A genome‐scan method to identify selected loci appropriate for both dominant and codominant markers: A Bayesian perspective. Genetics, 180(2), 977–993. 10.1534/genetics.108.092221 [DOI] [PMC free article] [PubMed] [Google Scholar]
- Forester, B. R. , Lasky, J. R. , Wagner, H. H. , & Urban, D. L. (2018). Comparing methods for detecting multilocus adaptation with multivariate genotype–environment associations. Molecular Ecology, 27(9), 2215–2233. 10.1111/mec.14584 [DOI] [PubMed] [Google Scholar]
- Fu, L. , & Chin, C. M. (1992). China plant red data book. Science Press. [Google Scholar]
- Fu, L. M. , Niu, B. F. , Zhu, Z. W. , Wu, S. T. , & Li, W. Z. (2012). CD‐HIT: Accelerated for clustering the next‐generation sequencing data. Bioinformatics, 28(23), 3150–3152. 10.1093/bioinformatics/bts565 [DOI] [PMC free article] [PubMed] [Google Scholar]
- Fu, Y. R. , Li, S. K. , Guo, Q. Q. , Zheng, W. L. , Yang, R. , & Li, H. (2019). Genetic diversity and population structure of two endemic Cupressus (Cupressaceae) species on the Qinghai‐Tibetan plateau. Journal of Genetics, 98(1), 14. 10.1007/s12041-019-1059-4 [DOI] [PubMed] [Google Scholar]
- Funk, W. C. , McKay, J. K. , Hohenlohe, P. A. , & Allendorf, F. W. (2012). Harnessing genomics for delineating conservation units. Trends in Ecology & Evolution, 27(9), 489–496. 10.1016/j.tree.2012.05.012 [DOI] [PMC free article] [PubMed] [Google Scholar]
- Goudet, J. , Jombart, T. , & Goudet, M. J. (2015). Package ‘hierfstat’. R package version 0.04‐22. http://www.r‐project.org; http://github.com/jgx65/hierfstat [Google Scholar]
- Guisan, A. , & Thuiller, W. (2005). Predicting species distribution: Offering more than simple habitat models. Ecology Letters, 8(9), 993–1009. 10.1111/j.1461-0248.2005.00792.x [DOI] [PubMed] [Google Scholar]
- Haas, B. J. , Papanicolaou, A. , Yassour, M. , Grabherr, M. , Blood, P. D. , Bowden, J. , Couger, M. B. , Eccles, D. , Li, B. O. , Lieber, M. , MacManes, M. D. , Ott, M. , Orvis, J. , Pochet, N. , Strozzi, F. , Weeks, N. , Westerman, R. , William, T. , Dewey, C. N. , … Regev, A. (2013). De novo transcript sequence reconstruction from RNA‐seq using the Trinity platform for reference generation and analysis. Nature Protocols, 8(8), 1494–1512. 10.1038/nprot.2013.084 [DOI] [PMC free article] [PubMed] [Google Scholar]
- Hallab, A. (2015). Protein Function Prediction Using Phylogenomics, Domain Architecture Analysis, Data Integration, and Lexical Scoring. [Google Scholar]
- Hamilton, M. (2011). Population genetics. John Wiley & Sons. [Google Scholar]
- Harrisson, K. A. , Amish, S. J. , Pavlova, A. , Narum, S. R. , Telonis‐Scott, M. , Rourke, M. L. , Lyon, J. , Tonkin, Z. , Gilligan, D. M. , Ingram, B. A. , Lintermans, M. , Gan, H. M. , Austin, C. M. , Luikart, G. , & Sunnucks, P. (2017). Signatures of polygenic adaptation associated with climate across the range of a threatened fish species with high genetic connectivity. Molecular Ecology, 26(22), 6253–6269. 10.1111/mec.14368 [DOI] [PubMed] [Google Scholar]
- Hewitt, G. M. (1996). Some genetic consequences of ice ages, an d their role in divergence and speciation. Biological Journal of the Linnean Society, 58(3), 247–276. 10.1111/j.1095-8312.1996.tb01434.x [DOI] [Google Scholar]
- Hewitt, G. (2000). The genetic legacy of the Quaternary ice ages. Nature, 405(6789), 907–913. 10.1038/35016000 [DOI] [PubMed] [Google Scholar]
- Hewitt, G. M. (2004). Genetic consequences of climatic oscillations in the Quaternary. Philosophical Transactions of the Royal Society of London. Series B: Biological Sciences, 359(1442), 183–195. 10.1098/rstb.2003.1388 [DOI] [PMC free article] [PubMed] [Google Scholar]
- Hijmans, R. J. , Cameron, S. E. , Parra, J. L. , Jones, P. G. , & Jarvis, A. (2005). Very high resolution interpolated climate surfaces for global land areas. International Journal of Climatology: A Journal of the Royal Meteorological Society, 25(15), 1965–1978. 10.1002/joc.1276 [DOI] [Google Scholar]
- Hohenlohe, P. A. , Funk, W. C. , & Rajora, O. P. (2020). Population genomics for wildlife conservation and management. Molecular Ecology, 30(1), 62–82. 10.1111/mec.15720 [DOI] [PMC free article] [PubMed] [Google Scholar]
- Hutchings, J. A. (2015). Thresholds for impaired species recovery. Proceedings of the Royal Society B: Biological Sciences, 282(1809), 20150654. 10.1098/rspb.2015.0654 [DOI] [PMC free article] [PubMed] [Google Scholar]
- James, G. , Witten, D. , Hastie, T. , & Tibshirani, R. (2013). An introduction to statistical learning (Vol. 112, pp. 18). Springer. [Google Scholar]
- Jia, K. H. , Zhao, W. , Maier, P. A. , Hu, X. G. , Jin, Y. , Zhou, S. S. , & Wang, X. R. (2020). Landscape genomics predicts climate change‐related genetic offset for the widespread Platycladus orientalis (Cupressaceae). Evolutionary Applications, 13(4), 665–676. 10.1111/eva.12891 [DOI] [PMC free article] [PubMed] [Google Scholar]
- Kamvar, Z. N. , Tabima, J. F. , & Grünwald, N. J. (2014). Poppr: An R package for genetic analysis of populations with clonal, partially clonal, and/or sexual reproduction. PeerJ, 2, e281. 10.7717/peerj.281 [DOI] [PMC free article] [PubMed] [Google Scholar]
- Lande, R. , Landweberg, L. , & Dobson, A. (1999). Extinction risks from anthropogenic, ecological, and genetic factors. In Genetics and the Extinction of Species: DNA and the Conservation of Biodiversity (pp. 1–22). [Google Scholar]
- Legendre, P. , & Legendre, L. (2012). Numerical ecology. Elsevier. [Google Scholar]
- Li, A. , & Ge, S. (2002). Advances in plant conservation genetics. Chinese Biodiversity, 10(1), 61–71. 10.17520/biods.2002009 [DOI] [Google Scholar]
- Li, H. , & Durbin, R. (2009). Fast and accurate short read alignment with Burrows‐Wheeler transform. Bioinformatics, 25(14), 1754–1760. 10.1093/bioinformatics/btp324 [DOI] [PMC free article] [PubMed] [Google Scholar]
- Li, H. , Guo, Q. Q. , & Zheng, W. L. (2016). The complete chloroplast genome of Cupressus gigantea, an endemic conifer species to Qinghai‐Tibetan Plateau. Mitochondrial DNA Part A, 27(5), 3743–3744. 10.3109/19401736.2015.1079885 [DOI] [PubMed] [Google Scholar]
- Li, H. , Handsaker, B. , Wysoker, A. , Fennell, T. , Ruan, J. , Homer, N. , Marth, G. , Abecasis, G. , & Durbin, R. (2009). The sequence alignment/map format and SAMtools. Bioinformatics, 25(16), 2078–2079. 10.1093/bioinformatics/btp352 [DOI] [PMC free article] [PubMed] [Google Scholar]
- Li, J. L. , Milne, R. I. , Ru, D. F. , Miao, J. B. , Tao, W. J. , Zhang, L. , & Mao, K. S. (2020). Allopatric divergence and hybridization within Cupressus chengiana (Cupressaceae), a threatened conifer in the northern Hengduan Mountains of western China. Molecular Ecology, 29(7), 1250–1266. 10.1111/mec.15407 [DOI] [PubMed] [Google Scholar]
- Li, J. L. , Zhong, L. L. , Wang, J. , Ma, T. , Mao, K. S. , & Zhang, L. (2021). Genomic insights into speciation history and local adaptation of an alpine aspen in the Qinghai‐Tibet Plateau and adjacent highlands. Journal of Systematics and Evolution, 59(6), 1220–1231. 10.1111/jse.12665 [DOI] [Google Scholar]
- Little, D. P. (2006). Evolution and circumscription of the true cypresses (Cupressaceae: Cupressus). Systematic Botany, 31(3), 461–480. [Google Scholar]
- Liu, D. T. , Zhang, L. , Wang, J. H. , & Ma, Y. P. (2020). Conservation genomics of a threatened Rhododendron: Contrasting patterns of population structure revealed from neutral and selected SNPs. Frontiers in Genetics, 11, 757. 10.3389/fgene.2020.00757 [DOI] [PMC free article] [PubMed] [Google Scholar]
- Liu, X. M. , & Fu, Y. X. (2015). Exploring population size changes using SNP frequency spectra. Nature Genetics, 47(5), 555–559. 10.1038/ng.3254 [DOI] [PMC free article] [PubMed] [Google Scholar]
- Lu, X. , Xu, H. Y. , Li, Z. H. , Shang, H. Y. , Adams, R. P. , & Mao, K. S. (2014). Genetic diversity and conservation implications of four Cupressus species in China as revealed by microsatellite markers. Biochemical Genetics, 52(3–4), 181–202. 10.1007/s10528-013-9638-1 [DOI] [PubMed] [Google Scholar]
- Luu, K. , Bazin, E. , & Blum, M. G. B. (2017). pcadapt: An R package to perform genome scans for selection based on principal component analysis. Molecular Ecology Resources, 17(1), 67–77. 10.1111/1755-0998.12592 [DOI] [PubMed] [Google Scholar]
- Ma, Y. Z. , Wang, J. I. , Hu, Q. , Li, J. L. , Sun, Y. Z. , Zhang, L. , Abbott, R. J. , Liu, J. Q. , & Mao, K. S. (2019). Ancient introgression drives adaptation to cooler and drier mountain habitats in a cypress species complex. Communications Biology, 2(1), 1–12. 10.1038/s42003-019-0445-z [DOI] [PMC free article] [PubMed] [Google Scholar]
- Mao, K. S. , Milne, R. I. , Zhang, L. B. , Peng, Y. L. , Liu, J. Q. , Thomas, P. , Mill, R. R. , & Renner, S. S. (2012). Distribution of living Cupressaceae reflects the breakup of Pangea. Proceedings of the National Academy of Sciences, 109(20), 7793–7798. 10.1073/pnas.1114319109 [DOI] [PMC free article] [PubMed] [Google Scholar]
- McKinney, G. J. , Waples, R. K. , Seeb, L. W. , & Seeb, J. E. (2017). Paralogs are revealed by proportion of heterozygotes and deviations in read ratios in genotyping‐by‐sequencing data from natural populations. Molecular Ecology Resources, 17(4), 656–669. 10.1111/1755-0998.12613 [DOI] [PubMed] [Google Scholar]
- Miraldo, A. , Li, S. , Borregaard, M. K. , Flórez‐Rodríguez, A. , Gopalakrishnan, S. , Rizvanovic, M. , Wang, Z. , Rahbek, C. , Marske, K. A. , & Nogués‐Bravo, D. (2016). An Anthropocene map of genetic diversity. Science, 353(6307), 1532–1535. 10.1126/science.aaf4381 [DOI] [PubMed] [Google Scholar]
- Neves, L. G. , Davis, J. M. , Barbazuk, W. B. , & Kirst, M. (2013). Whole‐exome targeted sequencing of the uncharacterized pine genome. The Plant Journal, 75(1), 146–156. 10.1111/tpj.12193 [DOI] [PubMed] [Google Scholar]
- Nystedt, B. , Street, N. R. , Wetterbom, A. , Zuccolo, A. , Lin, Y.‐C. , Scofield, D. G. , Vezzi, F. , Delhomme, N. , Giacomello, S. , Alexeyenko, A. , Vicedomini, R. , Sahlin, K. , Sherwood, E. , Elfstrand, M. , Gramzow, L. , Holmberg, K. , Hällman, J. , Keech, O. , Klasson, L. , … Jansson, S. (2013). The Norway spruce genome sequence and conifer genome evolution. Nature, 497(7451), 579–584. 10.1038/nature12211 [DOI] [PubMed] [Google Scholar]
- Oksanen, J. , Blanchet, F. G. , Kindt, R. , Legendre, P. , Minchin, P. R. , O’hara, R. B. , & Wagner, H. (2013). Package ‘vegan’: Community Ecology Package. R package version 2.3‐0. https://cran.r‐project.org/web/packages/vegan/index.html [Google Scholar]
- Peterson, D. W. , & Peterson, D. L. (2001). Mountain hemlock growth responds to climatic variability at annual and decadal time scales. Ecology, 82(12), 3330–3345. [Google Scholar]
- Price, A. L. , Patterson, N. J. , Plenge, R. M. , Weinblatt, M. E. , Shadick, N. A. , & Reich, D. (2006). Principal components analysis corrects for stratification in genome‐wide association studies. Nature Genetics, 38(8), 904–909. 10.1038/ng1847 [DOI] [PubMed] [Google Scholar]
- Purcell, S. , Neale, B. , Todd‐Brown, K. , Thomas, L. , Ferreira, M. A. R. , Bender, D. , Maller, J. , Sklar, P. , de Bakker, P. I. W. , Daly, M. J. , & Sham, P. C. (2007). PLINK: A tool set for whole‐genome association and population‐based linkage analyses. The American Journal of Human Genetics, 81(3), 559–575. 10.1086/519795 [DOI] [PMC free article] [PubMed] [Google Scholar]
- Ru, D. F. , Sun, Y. S. , Wang, D. L. , Chen, Y. , Wang, T. J. , Hu, Q. J. , Abbott, R. J. , & Liu, J. Q. (2018). Population genomic analysis reveals that homoploid hybrid speciation can be a lengthy process. Molecular Ecology, 27(23), 4875–4887. 10.1111/mec.14909 [DOI] [PubMed] [Google Scholar]
- Scheffers, B. R. , De Meester, L. , Bridge, T. C. L. , Hoffmann, A. A. , Pandolfi, J. M. , Corlett, R. T. , Butchart, S. H. M. , Pearce‐Kelly, P. , Kovacs, K. M. , Dudgeon, D. , Pacifici, M. , Rondinini, C. , Foden, W. B. , Martin, T. G. , Mora, C. , Bickford, D. , & Watson, J. E. M. (2016). The broad footprint of climate change from genes to biomes to people. Science, 354(6313), 10.1126/science.aaf7671 [DOI] [PubMed] [Google Scholar]
- Scott, A. D. , Zimin, A. V. , Puiu, D. , Workman, R. , Britton, M. , Zaman, S. , Caballero, M. , Read, A. C. , Bogdanove, A. J. , Burns, E. , Wegrzyn, J. , Timp, W. , Salzberg, S. L. , & Neale, D. B. (2020). A reference genome sequence for giant sequoia. G3: Genes, Genomes, Genetics, 10(11), 3907–3919. 10.1534/g3.120.401612 [DOI] [PMC free article] [PubMed] [Google Scholar]
- Simão, F. A. , Waterhouse, R. M. , Ioannidis, P. , Kriventseva, E. V. , & Zdobnov, E. M. (2015). BUSCO: Assessing genome assembly and annotation completeness with single‐copy orthologs. Bioinformatics, 31(19), 3210–3212. 10.1093/bioinformatics/btv351 [DOI] [PubMed] [Google Scholar]
- Stamatakis, A. (2014). RAxML version 8: A tool for phylogenetic analysis and post‐analysis of large phylogenies. Bioinformatics, 30(9), 1312–1313. 10.1093/bioinformatics/btu033 [DOI] [PMC free article] [PubMed] [Google Scholar]
- Sun, Y. B. , & An, Z. S. (2005). Late Pliocene‐Pleistocene changes in mass accumulation rates of eolian deposits on the central Chinese Loess Plateau. Journal of Geophysical Research: Atmospheres, 110(D23). 10.1029/2005JD006064 [DOI] [Google Scholar]
- Tang, L. Z. , Wang, L. Y. , Cai, Z. Y. , Zhang, T. Z. , Ci, H. X. , Lin, G. H. , Su, J. P. , & Liu, J. Q. (2010). Allopatric divergence and phylogeographic structure of the plateau zokor (Eospalax baileyi), a fossorial rodent endemic to the Qinghai–Tibetan Plateau. Journal of Biogeography, 37(4), 657–668. 10.1111/j.1365-2699.2009.02232.x [DOI] [Google Scholar]
- Terry, R. G. , Schwarzbach, A. E. , & Bartel, J. A. (2018). A molecular phylogeny of the Old World cypresses (Cupressus: Cupressaceae): Evidence from nuclear and chloroplast DNA sequences. Plant Systematics and Evolution, 304(10), 1181–1197. 10.1007/s00606-018-1540-1 [DOI] [Google Scholar]
- Thomas, C. D. , Cameron, A. , Green, R. E. , Bakkenes, M. , Beaumont, L. J. , Collingham, Y. C. , Erasmus, B. F. N. , de Siqueira, M. F. , Grainger, A. , Hannah, L. , Hughes, L. , Huntley, B. , van Jaarsveld, A. S. , Midgley, G. F. , Miles, L. , Ortega‐Huerta, M. A. , Townsend Peterson, A. , Phillips, O. L. , & Williams, S. E. (2004). Extinction risk from climate change. Nature, 427(6970), 145–148. 10.1038/nature02121 [DOI] [PubMed] [Google Scholar]
- Uchiyama, I. , Higuchi, T. , & Kawai, M. (2010). MBGD update 2010: Toward a comprehensive resource for exploring microbial genome diversity. Nucleic Acids Research, 38(suppl_1), D361–D365. 10.1093/nar/gkp948 [DOI] [PMC free article] [PubMed] [Google Scholar]
- Urban, M. C. (2015). Accelerating extinction risk from climate change. Science, 348(6234), 571–573. 10.1126/science.aaa4984 [DOI] [PubMed] [Google Scholar]
- Vranken, S. , Wernberg, T. , Scheben, A. , Severn‐Ellis, A. A. , Batley, J. , Bayer, P. E. , Edwards, D. , Wheeler, D. , & Coleman, M. A. (2021). Genotype‐environment mismatch of kelp forests under climate change. Molecular Ecology, 30(15), 3730–3746. 10.1111/mec.15993 [DOI] [PubMed] [Google Scholar]
- Wang, J. S. , Zheng, W. L. , & Pan, G. (2005). Relation between being endangered and seed vigor about Cupressus gigantea in Tibet. Scientia Silvae Sinicae, 41(4), 37. [Google Scholar]
- Wang, L. Y. , Abbott, R. J. , Zheng, W. , Chen, P. , Wang, Y. J. , & Liu, J. Q. (2009). History and evolution of alpine plants endemic to the Qinghai‐Tibetan Plateau: Aconitum gymnandrum (Ranunculaceae). Molecular Ecology, 18(4), 709–721. 10.1111/j.1365-294X.2008.04055.x [DOI] [PubMed] [Google Scholar]
- Weir, B. S. , & Cockerham, C. C. (1984). Estimating F‐statistics for the analysis of population structure. Evolution, 38(6), 1358–1370. [DOI] [PubMed] [Google Scholar]
- Xia, T. , Meng, L. B. , Mao, K. S. , Tian, B. , Miehe, G. , & Liu, J. Q. (2008). Genetic variation in the Qinghai‐Tibetan plateau endemic and endangered conifer Cupressus gigantea, detected using RAPD and ISSR markers. Silvae Genetica, 57(1–6), 85–92. 10.1515/sg-2008-0014 [DOI] [Google Scholar]
- Xin, F. M. , Wang, Y. T. , & Li, S. M. (2019). Effects of different temperatures on photosynthesis and rooting of Cupressus gigantea seedlings. Journal of Zhejiang University (Agriculture and Life Sciences), 45(1), 102–108. 10.3785/j.issn.1008-9209.2017.12.151 [DOI] [Google Scholar]
- Xu, T. T. , Abbott, R. J. , Milne, R. I. , Mao, K. S. , Du, F. K. , Wu, G. L. , Ciren, Z. X. , Miehe, G. , & Liu, J. Q. (2010). Phylogeography and allopatric divergence of cypress species (Cupressus L.) in the Qinghai‐Tibetan Plateau and adjacent regions. BMC Evolutionary Biology, 10(1), 1–10. 10.1186/1471-2148-10-194 [DOI] [PMC free article] [PubMed] [Google Scholar]
- Yang, N. (2015). Current status and protection of Cupressus gigantea Cheng et L. K. Fu communities in Nyingchi of Tibet. Central South Forest Inventory & Planning, 34(2). 10.16166/j.cnki.cn43-1095.2015.02.013 [DOI] [Google Scholar]
- Zhang, D. , Qin, H. N. , Christian, T. , & Rushforth, K. (2013). Cupressus torulosa var. gigantea. The IUCN Red List of Threatened Species 2013. 10.2305/IUCN.UK.2013-1.RLTS.T32336A2815433.en [DOI] [Google Scholar]
- Zhang, G. (2006). Studies on the biological and ecological characteristics of endangered plant Cupressus gigantea in Tibet. Forestry Science & Technology, 31(2), 1–5. [Google Scholar]
- Zhao, W. , Sun, Y. Q. , Pan, J. , Sullivan, A. R. , Arnold, M. L. , Mao, J. F. , & Wang, X. R. (2020). Effects of landscapes and range expansion on population structure and local adaptation. New Phytologist, 228(1), 330–343. 10.1111/nph.16619 [DOI] [PubMed] [Google Scholar]
- Zheng, B. X. , Xu, Q. Q. , & Shen, Y. P. (2002). The relationship between climate change and Quaternary glacial cycles on the Qinghai‐Tibetan Plateau: Review and speculation. Quaternary International, 97, 93–101. 10.1016/s1040-6182(02)00054-x [DOI] [Google Scholar]
- Zheng, W. J. , & Fu, L. G. (1978). Cupressus linn. In Editorial Committee of Flora Reipublicae Popularis Sinicae (Ed.) Flora Reipublicae Popularis Sinicae Tomus (Vol. 7, pp. 328–336). [Google Scholar]
- Zheng, W. L. , Xue, H. Y. , Luo, D. Q. , Wang, J. S. , & Luo, J. (2007). Eco‐geographic Distribution and Coenology Characteristics of Cupressus gigantea . Entia Silvae Sinicae, 43(12), 8–15. 10.11707/j.1001-7488.20071202 [DOI] [Google Scholar]
- Zhou, S. S. , Xing, Z. , Liu, H. , Hu, X. G. , Gao, Q. , Xu, J. , Jiao, S. Q. , Jia, K. H. , Jin, Y. Q. , Zhao, W. , Porth, I. , El‐Kassaby, Y. A. , & Mao, J. F. (2019). In‐depth transcriptome characterization uncovers distinct gene family expansions for Cupressus gigantea important to this long‐lived species adaptability to environmental cues. BMC Genomics, 20(1), 1–14. 10.1186/s12864-019-5584-6 [DOI] [PMC free article] [PubMed] [Google Scholar]
Associated Data
This section collects any data citations, data availability statements, or supplementary materials included in this article.
Supplementary Materials
Supplementary Material
Data Availability Statement
The transcriptome sequencing data have been deposited in National Genomics Data Center (https://bigd.big.ac.cn/) under BioProject: PRJCA006268.